School of Pharmaceutical Sciences, Henan Key Laboratory of Nanomedicine for Targeting Diagnosis and Treatment, Zhengzhou University, Zhengzhou 450001, China
b.
Medical Research Center, The First Affiliated Hospital of Zhengzhou University, The Center of Infection and Immunity, Academy of Medical Sciences, Zhengzhou University, Zhengzhou 450001, China
Received Date:
03 September 2024 Accepted Date:
02 December 2024 Revised Date:
21 November 2024 Available Online:
15 September 2025
Abstract:
Nanomaterials that can sequentially respond to internal and external stimuli, functioning as a sequential gate, have great potential for targeting different aspects of antitumor immunity. Herein, we construct a mannose-modified, pH and reactive oxygen species (ROS) sequential-responsive, transformable dual-immunofunction nanoprodrug (MpRTNP). This nanoprodrug encapsulates a transforming growth factor-β (TGF-β) receptor inhibitor SD-208 (MpRTNP@SD), to simultaneously alleviate the immunosuppressive effects of TGF-β and tumor-associated macrophages (TAMs). In the weakly acidic tumor microenvironment (TME), the vesicle-micelle morphology transformation occurs owing to the protonation of PC7A, which is accompanied by SD-208 release to inhibit cancer-associated fibroblasts and regulatory T cells. The transformed micelles then target TAMs via mannose receptor-mediated endocytosis. Upon laser irradiation, the thioketal linker is cleaved, releasing conjugated chlorin e6 and generating ROS, which facilitates TAM polarization. The PC7A+ segment activates the stimulator of the interferon gene in TAMs with elevated phosphorylation of TANK binding kinase 1 and interferon regulatory factor 3, and type Ⅰ interferon secretion. MpRTNP@SD displays superior abscopal effects and robust antitumor immunity, as evidenced by increased CD8+/CD4+ T cell infiltration and reduced regulatory T cell (Treg) ratios. Mouse survival time is prolonged after combination with the CD47 antibody. This study provides a novel strategy for potent antitumor immunotherapy through pH and ROS sequential-gated spatiotemporal regulation of the TME.
The immunosuppressive tumor microenvironment (iTME) hinders therapeutic efficacy by enabling immunosurveillance escape and reducing lymphocyte activity [1-6]. Transforming growth factor-β (TGF-β) contributes to activating cancer-associated fibroblasts (CAFs) and regulatory T cells (Tregs) [7], thereby targeting TGF-β signaling being a promising strategy to enhance immunotherapeutic efficacy [8,9]. Tumor-associated macrophages (TAMs) are another crucial component of the iTME, frequently manifesting as the anti-inflammatory M2 phenotype, which secretes TGF-β and enables immunosurveillance evasion [10-13]. Consequently, polarizing M2-TAMs into the pro-inflammatory M1 phenotype is deemed an effective therapeutic strategy in antitumor immunotherapy [14-19]. Reactive oxygen species (ROS) generated by photodynamic therapy are considered as strong TAM-polarizing agent candidates [20,21]. Notably, the action sites of TGF-β receptor inhibitor and photodynamic therapy are completely separate in the tumor microenvironment (TME) modulation. The former mainly focuses on the TGF-β receptor inhibition on immunosuppressive cells surface, and the latter tends to induce TAMs polarization in cells. Therefore, it is essential to design rational combined drug delivery systems to achieve the spatiotemporal orchestration of each drug.
Nanomaterials that can sequentially respond to internal and external stimuli, functioning as a sequential gate, hold significant potential in focusing on different targets for enhanced antitumor immunity [22-28]. Compared to normal tissues, the TME is characterized by the weak acidity (pH 6.8), with even greater acidity (pH 2.0–5.0) in the intracellular endo/lysosomes [29]. These distinct characteristics have promoted the development of various intelligent nanomedicines for selective drug release [30-36]. Among these, intelligent nanoprodrug delivery systems can rationally design prodrug molecules by chemically conjugation, thereby improving bioavailability and achieving more accurate spatiotemporal controlled drug release at target sites [37-44]. Such strategies effectively reduce adverse reactions and co-deliver multi-immunomodulators to produce synergistic antitumor immunity.
The stimulator of interferon genes (STING) is a key signal transduction molecule in the innate immune response triggered by exogenous or damaged DNA, leading to elevated expression of TANK binding kinase 1 (TBK1) and interferon regulatory factor 3 (IRF3) and the secretion of type Ⅰ interferons (e.g., IFN-β) [45-49]. The STING pathway in TAMs is essential for M1 macrophage polarization and IFN-β secretion [50,51]. Common STING agonists, such as cyclic dinucleotides and derivatives, face rapid clearance and poor membrane permeability [52]. PC7A, a functional polymer which is able to better cope with the above issues, can also act as a polyvalent STING agonist [53,54]. This significantly advances the development of immunofunctional nanomaterials that can induce antitumor immunity [55].
Herein, we constructed a mannose-modified pH and ROS sequential-gated transformable chlorin e6 (Ce6) nanoprodrug (MpRTNP) loaded with SD-208 (MpRTNP@SD) (Fig. 1a). In the weakly acidic TME (pH 6.8), the hydrophobic block PC7A transformed into hydrophilic PC7A+, causing MpRTNP to reassemble into the mannose-modified ROS-responsive nanoprodrug (MRNP) with concurrent SD-208 release. SD-208 blocked the TGF-β signaling axis in the TME, decreased CAFs and Tregs, and recruited T lymphocytes with tumor infiltration, while MRNP actively targeted TAMs via mannose receptor-mediated endocytosis. After laser irradiation, substantial ROS were generated, resulting in thioketal (TK) linker breakage and Ce6 release. The ROS subsequently polarized TAM into M1 phenotype, and PC7A in the polymer skeleton served as a STING agonist to activate the innate immunity (Fig. 1b). The in vivo near-infrared imaging results revealed enhanced tumor accumulation of MpRTNP, enabling early diagnosis via magnetic resonance imaging (MRI) after coordination with gadolinium (Gd3+). In vivo results revealed that MpRTNP remodeled the TME and inhibited the primary and distant tumors growth. After combination with anti-CD47, mouse survival time was significantly prolonged. This study thus presents a novel strategy for the rational design of a smart nanoplatform aimed at enhancing antitumor immunotherapy via the spatiotemporal regulation of the TME.
Figure 1
Figure 1.
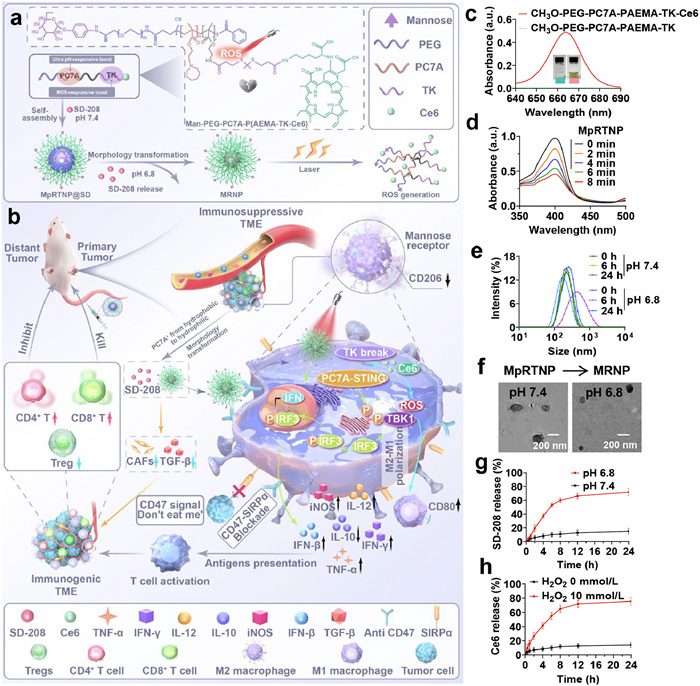
Schematic illustration and characterization of the preparation and action of the sequential-gated transformable nanoprodrug. (a) Illustration of the preparation and responsiveness of MpRTNP@SD. (b) Illustration of the mechanism of MpRTNP@SD in enhancing antitumor immunity through TME modulation and STING activation. (c) UV–vis spectra and images of polymers with or without Ce6 conjugation. (d) Singlet oxygen consumption of MpRTNP at different time points. (e) pH-responsiveness of MpRTNP. (f) TEM images of MpRTNP at pH 7.4 and 6.8, respectively. Scale bar: 200 nm. (g) In vitro SD-208 release from MpRTNP under pH 7.4 or 6.8 within 24 h (n = 3). (h) In vitro Ce6 release from MpRTNP with 10 mmol/L or without H2O2 treatment within 24 h (n = 3). Data are presented as mean ± standard deviation (SD).
1H nuclear magnetic resonance (1H NMR) spectrum in Fig. S1 (Supporting information) showed the successful synthesis of the pH-responsive monomer C7A. The chain transfer agent (COOH-)polyethylene glycol (PEG)-cyano-4-(phenylcarbonothioylthio)pentanoic acid N-succinimidyl ester (CPPA) was prepared as previously described (Figs. S2 and S3 in Supporting information) [56]. The triblock copolymer (COOH-)PEG-PC7A-(2-Boc-amino)ethyl methacrylate (PBAEMA) was synthesized using classic reversible addition-fragmentation chain transfer (RAFT) polymerization (Figs. S4 and S5 in Supporting information). The degree of polymerization was calculated to be PEG-PC7A12-PBAEMA8 and COOH-PEG-PC7A13-PBAEMA8. Mannose modification in the block polymer was achieved via a condensation reaction (Fig. S6 in Supporting information). The -Boc group was then deprotected in the presence of trifluoroacetic acid (TFA). Fig. S7 (Supporting information) showed the increased peak at 335 nm, indicating the successful conversion of -NHBoc to -NH2 on the polymer skeleton. The ROS-responsive linker was synthesized as previously described (Fig. S8 in Supporting information) [57]. Finally, TK and Ce6 were linked using a classic condensation reaction. The structures of PEG-PC7A-P(AEMA-TK) were confirmed through 1H NMR spectra in Fig. S9 (Supporting information). Additionally, ultraviolet–visible (UV–vis) spectra and dark green images confirmed the conjugation of Ce6 (Fig. 1c and Fig. S10 in Supporting information). Subsequently, 1,3-diphenylisobenzofuran (DPBF) served as a fluorescent probe to detect ROS production by Ce6 following irradiation (660 nm, 100 mW2) (Fig. 1d).
The average hydrodynamic size of MpRTNP was 220.0 nm (Fig. S11 in Supporting information). The transformed MRNP had a reduced size (190.0 nm) at pH 6.8 (Fig. 1e). Transmission electron microscopy (TEM) images showed the typical vesicular and micellar morphologies of MpRTNP at pH 7.4 and 6.8, respectively (Fig. 1f). This phenomenon may attribute to the hydrophobic PC7A transitioning to hydrophilic PC7A+, leading to the reassembly and vesicle-to-micelle transformation of MpRTNP. After loading with SD-208, the size of MpRTNP@SD increased to 255.2 nm (Fig. S12 in Supporting information). The loading content and efficiency of SD-208 were 7.39% and 66.67%, respectively (Fig. S13 in Supporting information). According to Fig. S14 (Supporting information), negligible size changes of MpRTNP@SD were observed within 72 h, displaying its good stability. As shown in Fig. 1g, only 14.97% of SD-208 was released at pH 7.4 within 24 h, whereas approximate 71.80% was released at pH 6.8. Similar release profiles were observed for Ce6 (Fig. 1h). The rapid release of SD-208 and Ce6 was primarily attributed to the reassembly and dissociation of MpRTNP@SD under acidic and ROS conditions, respectively.
Cellular uptake of MpRTNP was assessed via the fluorescence intensity of Ce6. As shown in Fig. S15 (Supporting information), faint red fluorescence was initially observed in cells incubated with different treatments for the first 2 h. With prolonged incubation time, stronger red fluorescence was observed. Compared to pH and ROS sequential-responsive, transformable dual-immunofunction nanoprodrug (pRTNP), cells incubated with MpRTNP exhibited significantly stronger red fluorescence across all observation time points, indicating the active cellular uptake capacity of mannose modification. Similar results were observed via flow cytometry (Fig. S16 in Supporting information).
The ROS generation of MpRTNP in RAW264.7 cells was assessed using 2′,7′-dichlorodihydrofluorescein diacetate (DCFH-DA) as the probe. Upon oxidation, DCFH-DA converts to 2′,7′-dichlorodihydrofluorescein (DCF), emiting green fluorescence. As shown in Fig. S17 (Supporting information), the fluorescence intensities of DCF in Ce6 (+) and MpRTNP (+) were higher than those of Ce6 (−) and MpRTNP (−), respectively, indicating abundant ROS generation following laser irradiation (Fig. S17). Here, "+" means formulations with laser irradiation treatment and "−" means without laser irradiation. Similar results were observed via confocal laser scanning microscopy (CLSM) (Fig. S18 in Supporting information).
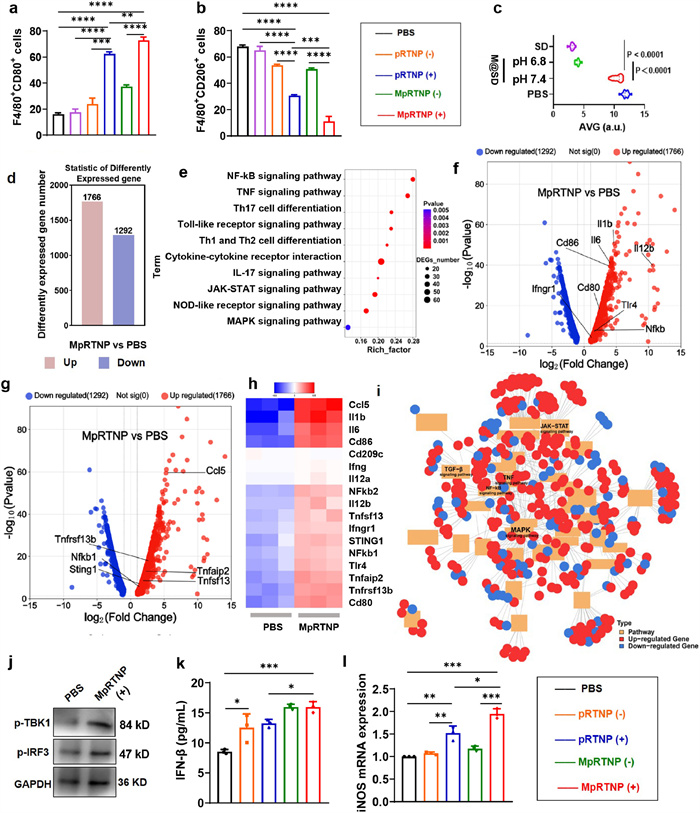
We then examined the effects of MpRTNP (+) on macrophage polarization. We hope MpRTNP (+) mainly induce macrophages polarization while not kill them, thereby the cytotoxicity of MpRTNP (+) being investigated in Fig. S19 (Supporting information). The cell viability of RAW264.7 cells was > 85% at the Ce6 concentration of 5 µg/mL while < 70% cell viability was observed at 10 µg/mL, thereby the former concentration being chosen to explore macrophages polarization. Figs. 2a, b and Figs. S20a, b (Supporting information) showed that compared with phosphate buffer saline (PBS), the expression of CD80 (an M1 marker) in cells treated with pRTNP (+) and MpRTNP (+) increased, while slight increments were observed in pRTNP (−) (23.83% ± 2.63%) and MpRTNP (−) (37.33% ± 0.77%). Additionally, CD206 (an M2 marker) expression notably decreased in cells treated with pRTNP (+) and MpRTNP (+), compared to pRTNP (−) and MpRTNP (−), indicating that ROS generation facilitated macrophage polarization. Compared to pRTNP (+), the elevated CD80 and decreased CD206 expression in MpRTNP (+) were attributed to mannose receptor-mediated active targeting. Finally, pro-inflammatory and anti-inflammatory cytokines were evaluated via enzyme-linked immunosorbent assay (ELISA) when MpRTNP (+) displayed higher interleukin-12 (IL-12) and lower IL-10 levels compared with pRTNP (+) (Fig. S21 in Supporting information). Negligible calreticulin exposure was detected in MpRTNP (+) compared with PBS, probably due to the selectively targeting to macrophages resulting in very limited internalization by cancer cells (Fig. S22 in Supporting information).
Figure 2
Figure 2.In vitro macrophage polarization, antifibrosis and transcriptome analysis. (a, b) Semi-quantitative analysis of F480+CD80+ (a) and F480+CD206+ (b) cell populations in RAW264.7 cells with different treatments. (c) Semi-quantitative analysis of α-SMA expression in NIH3T3 cells after different treatments. (d) Differentially expressed genes. (e) Upregulated top KEGG pathway analysis. (f, g) Macrophage polarization volcano plot. (h) Hierarchical cluster analysis for the gene expression of other inflammatory agents (gene ontology (GO) database). Genes were selected from the complete gene list with cut-off |log2FC| > 0.25. (i) KEGG grid diagram of organic systems. (j) Western blot analysis of markers p-TBK1 and p-IRF3 of RAW264.7 cells. Glyceraldehyde-3-phosphate dehydrogenase (GAPDH) served as a loading control. (k) Expression of IFN-β in RAW264.7 cells measured by ELISA. (l) Reverse transcription real-time quantitative polymerase chain reaction (RT-qPCR) analysis of iNOS expression in RAW264.7 cells under various treatments. Data are presented as mean ± SD (n = 3). (−): No laser, (+): With laser irradiation (660 nm, 100 mW/cm2, 3.5 min). Statistical significance was analyzed by one-way ANOVA with Tukey's multiple comparisons test. P < 0.05, **P < 0.01, ***P < 0.001, ****P < 0.0001.
The TGF-β signaling pathway is widely recognized as a key factor in tumor fibrosis, regulating the activation and differentiation of CAFs. Immunofluorescence (IF) staining results showed that MpRTNP@SD (pH 7.4), MpRTNP@SD (pH 6.8), and SD-208 markedly reduced α‐smooth muscle actin (α-SMA) protein levels in NIH3T3 cells by 1.06-, 3.49-, and 3.59-fold, respectively, compared to the PBS group (Fig. 2c, Fig. S23 in Supporting information). The reason for this phenomenon is that only in the weakly acidic medium (pH 6.8) did the hydrophobic block PC7A transform into hydrophilic PC7A+, causing MpRTNP to reassemble into MRNP with concurrent SD-208 release.
The results in transcriptome analysis revealed differentially expressed genes (DEGs) between the MpRTNP and PBS groups (Fig. 2d). The Kyoto encyclopedia of genes and genomes (KEGG) analysis showed that these DEGs were significantly associated with cytokine-cytokine receptor interaction, nuclear factor kappa B (NF-κB), tumor-necrosis factor (TNF), Toll-like receptor (TLR), NOD-like receptor, and Janus kinase/signal transducers and activators of transcription (JAK-STAT) signaling pathways (Fig. 2e). These pathways mediate several downstream immune and inflammatory cascades, highlighting the strong relationship between MpRTNP treatment and immune-related pathways. The RNA-seq analysis showed high expression levels of CD80/86, TLR4, NF-κB, IFN-γ, C—C motif chemokine ligand 5 (CCL5), and STING genes between MpRTNP and PBS, as illustrated by the volcano plots, highlighting that MpRTNP could induce macrophage polarization and activate STING (Figs. 2f and g). Hierarchical cluster analysis of the heat map further confirmed these differences (Fig. 2h). Additionally, the KEGG regulatory network diagram indicated significant differences in organismal system pathways, including upregulated TNF, NF-κB, JAK-STAT, and mitogen activated protein kinase (MAPK) and downregulated TGF-β genes (Fig. 2i). These findings suggest that multiple immune-related regulatory pathways are activated in macrophages after MpRTNP treatment.
The cyclic guanosine monophosphate (cGMP)-adenosine monophosphate (AMP) (cGAMP)-STING signaling pathway-an innate cytoplasmic DNA sensing mechanism has garnered significant attention for its role in activating innate and adaptive immunity [45,47]. STING activation induces polarization of M2-TAMs toward an antitumor M1-like phenotype [50,51]. It has been reported that PC7A binds non-competitively to STING surface sites, forming STING-PC7A aggregates and activating antitumor immune responses via the STING pathway in dendritic cells (DCs) [53]. Here, we found that RAW264.7 cells treated with MpRTNP also showed significantly upregulated p-IRF3 and p-TBK1 levels compared with PBS (Fig. 2j). ELISA analysis further revealed increased IFN-β expression in cells treated with MpRTNP and pRTNP compared with PBS (Fig. 2k). The most inducible nitric oxide synthase (iNOS) amount was measured in the MpRTNP (+) group, aligning with the observed polarization results (Fig. 2l). These findings suggest that MpRTNP (+) polarizes macrophages through the activated STING pathway and Ce6-induced ROS.
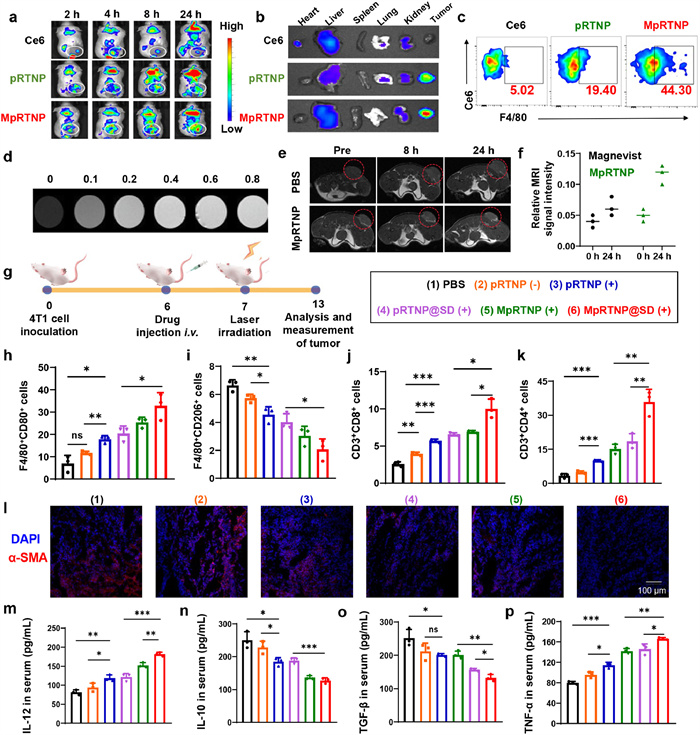
To investigate the tumor accumulation of MpRTNP, 4T1 tumor-bearing BALB/c mice (~100 mm3) were randomly divided into three groups. All animal studies were performed under the approved protocol of Zhengzhou University Animal Care and Use Committee (ZZU ACUC syxk (yu) 2018–0004). The results showed that free Ce6 accumulated rapidly at tumor sites within 2 h post-injection and peaked at 4 h before gradually decreasing. The Ce6 fluorescence intensity in pRTNP and MpRTNP accumulated gradually, peaking at 8 and 24 h, respectively (Fig. 3a and Fig. S24 in Supporting information). These results indicated that free Ce6 could accumulate at tumor sites but was cleared quickly. However, pRTNP and MpRTNP demonstrated enhanced tumor accumulation via the enhanced permeability and retention (EPR) effect and active targeting of mannose modification. Ex vivo IVIS images at 24 h post-injection further confirmed these findings (Fig. 3b and Fig. S25 in Supporting information). Fig. 3c and Fig. S26 (Supporting information) showed that more Ce6+F4/80+ cell ratios were detected in MpRTNP than that of pRTNP, demonstrating the TAM-targetability of MpRTNP. Subsequently, T1-weighted MRI of Gd3+-loaded MpRTNP was assessed. Fig. 3d showed the increased MRI signal intensity of MpRTNP with Gd3+ concentration increment. Especially, MpRTNP generated significantly higher T1 contrast in 4T1 tumor-bearing mice than Magnevist (Fig. 3e) and it was three-fold higher at 24 h (Fig. 3f). These results highlight the potential of MpRTNP for FI and MRI double-modal imaging-guided precise therapy.
Figure 3
Figure 3.In vivo tumor accumulation and TME regulation. (a) In vivo tumor accumulation at different time points. (b) Ex vivo images at 24 h post-injection. (c) Detection of Ce6 fluorescence in macrophages using flow cytometry. (d) T1-MRI images of MpRTNP chelated with Gd3+ at different concentrations. (e, f) T1-weighted MRI images (e) of tumor-bearing mice before and after i.v. injection of Magnevist and MpRTNP chelated with Gd3+in vivo, along with the semi-quantitative analysis (f). (g) Schematic representation and grouping of the in vivo biodistribution and TME remodeling experimental design for panels (h–p). (h, i) Semi-quantitative analysis of CD80+ (h) and CD206+ (i) cells in mice after different treatments. (j, k) Semi-quantitative analysis of CD3+CD8+ (j) and CD3+CD4+ (k) T cells in tumor tissue after different treatments, as measured by flow cytometry. (l) α-SMA staining for characterizing CAFs in tumor tissue following various treatments. Cell nuclei were stained with 4′, 6-diamidino-2-phenylindole (DAPI). (m–p) Detection of cytokines IL-12 (m), IL-10 (n), TGF-β (o), and TNF-α (p) in serum via ELISA after treatments. Data are presented as mean ± SD (n = 3). P < 0.05, **P < 0.01, ***P < 0.001 by one-way ANOVA with Tukey's post hoc test. ns, no significance.
We next explored the TME remodeling of MpRTNP@SD (+) in vivo (Fig. 3g). Mice were irradiated (660 nm, 200 mW/cm2, 10 min) at the tumor site at 24 h post-injection. Figs. 3h, i and Figs. S27, S28 (Supporting information) showed that compared to PBS, the pRTNP (−) group showed increased F4/80+CD80+ and decreased F4/80+CD206+ cell ratios, owing to STING activation by PC7A segment. Higher F4/80+CD80+ and lower F4/80+CD206+ cells were detected in pRTNP (+) due to ROS production following Ce6 irradiation. The MpRTNP (+) group, benefiting from mannose active targeting, exhibited higher F4/80+CD80+ and lower F4/80+CD206+ cells than pRTNP (+). Synergistic polarization effects were observed in the MpRTNP@SD (+) group, with the most F4/80+CD80+ cells and the least F4/80+CD206+ cells.
T cell ratios and infiltration at tumor sites were also detected via flow cytometry and CLSM. Figs. 3j, k and Figs. S29, S30 (Supporting information) showed that MpRTNP@SD (+) induced the most CD3+CD8+ and CD3+CD4+ T cell populations. As presented in Fig. S31 (Supporting information), the most intense CD8+ T cell infiltration (red color) was observed in the MpRTNP@SD (+) group. As a novel TGF-β receptor inhibitor, SD-208 can inhibit vascular formation and the activation of CAFs, thereby remodeling the iTME. Fig. S32 (Supporting information) and Fig. 3l showed the lowest green (CD31) and red (α-SMA) fluorescence intensities in the MpRTNP@SD (+) group. Finally, the results in Figs. 3m–p revealed the highest IL-12 and TNF-α levels but the lowest IL-10 and TGF-β levels in the MpRTNP@SD (+) group. There were negligible changes in creatinine (Cre), alanine aminotransferase (ALT), aspartate aminotransferase (AST), urea and white cells observed after blood biochemical and routine analysis, indicating the good biosafety of the nanoformulation (Fig. S33 in Supporting information).
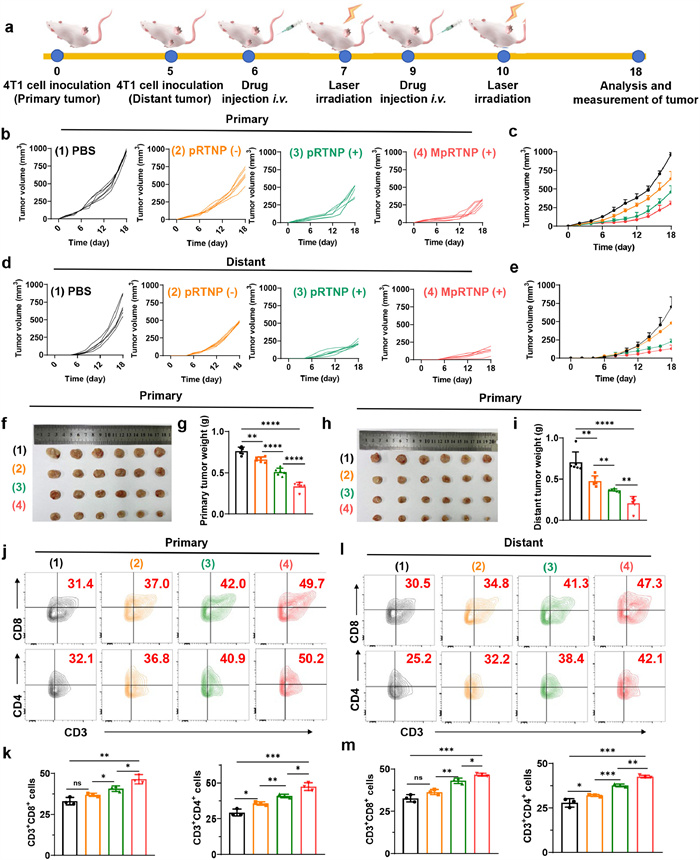
We then investigated the distal effect of MpRTNP (+) in subcutaneous 4T1 bilateral tumor-bearing mice (Fig. 4a). Figs. 4b–e showed that the pRTNP (−) slightly inhibit tumor growth, with the tumor reaching about ~700 (primary) and ~500 (distant) mm3 on day 18. However, pRTNP (+) significantly suppressed tumor growth to ~500 (primary) and ~250 (distant) mm3 on day 18, which was approximately 1.4- and 2.5-fold inhibition, respectively. The MpRTNP (+) treatment further suppressed tumor growth to ~250 (primary) and ~100 (distant) mm3, which was approximate 2.0- and 2.5-fold inhibition, respectively, compared to the pRTNP (+) group, owing to mannose receptor-mediated active targeting. The least primary and distant tumor volumes in MpRTNP (+) group were further confirmed in Figs. 4f and h, which were consistent with results of tumor weights in Figs. 4g and i. The negligible body weight changes suggested low biological toxicity of the nanosystems (Fig. S34 in Supporting information). Hematoxylin and eosin (H & E) staining revealed severe injury and necrosis of tumor cells and negligible toxicity to major organs in the MpRTNP (+) group (Fig. S35 in Supporting information). To further evaluate the antitumor immunity of MpRTNP (+), we assessed CD4+ and CD8+ T cell ratios using flow cytometry (Figs. 4j–m). The percentages of CD3+CD8+ and CD3+CD4+ T cell ratios increased in the order of PBS < pRTNP (−) < pRTNP (+) < MpRTNP (+) in both primary and distant tumors.
Figure 4
Figure 4.In vivo distant efficiency of MpRTNP nanoparticles. (a) Schematic illustration of primary and distant tumor inoculation, drug administration, tumor volume monitoring, and analysis. Individual (b) and average (c) primary tumor volume growth curves following different treatments (n = 6 per group). Individual (d) and average (e) distal tumor volume growth curves. Images of primary tumors (f) and tumor weights (g) in mice on day 18. Distal tumor images (h) and tumor weight (i) for mice on day 18. Representative percentages (j) and semi-quantitative analysis (k) of CD3+CD8+ in primary tumor tissue, as measured by flow cytometry. Representative percentages (l) and semi-quantitative analysis (m) of CD3+CD4+ T cells in distal tumor tissues after different treatments. Data are presented as mean ± SD. P < 0.05, **P < 0.01, ***P < 0.001, ****P < 0.0001 by one-way ANOVA with Tukey's post hoc test.
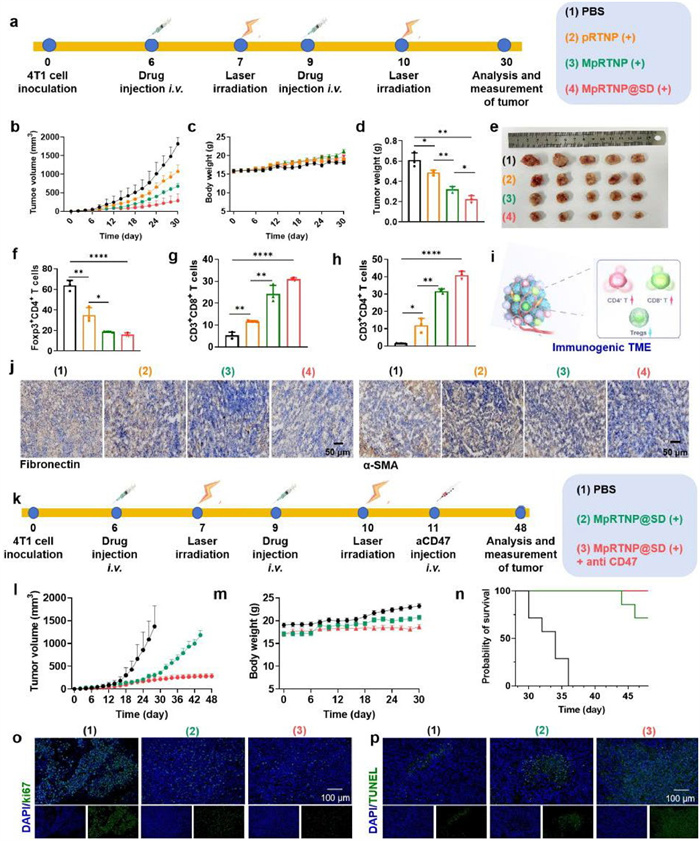
We integrated SD-208 into the MpRTNP (MpRTNP@SD) to target TGF-β in the iTME of subcutaneous 4T1 tumor-bearing mice (Fig. 5a). Compared to PBS, pRTNP (+) inhibited tumor growth and reduced the tumor volume from ~2000 mm3 to ~1000 mm3 on day 30 (Fig. 5b and Fig. S36 in Supporting information). The MpRTNP (+) treatment significantly suppressed tumor growth to ~700 mm3 on day 30, which was approximately 1.37-fold greater inhibition than that of pRTNP (+). The MpRTNP@SD (+) treatment further suppressed tumor growth to ~300 mm3, which was approximately 1.58-fold greater inhibition than that of MpRTNP (+). This was attributed to the synergetic effect of SD-208 and TAM polarization. The body weight of the mice remained stable throughout the study (Fig. 5c). Tumor weights were consistent with volume measurements (Fig. 5d). Fig. 5e showed the representative tumor images. Consistent with prior observations, MpRTNP@SD (+) induced the most CD3+CD4+ and CD3+CD8+ T cell percentages, while the lowest CD4+Foxp3+ T cell ratios compared with other groups (Figs. 5f–i and Figs. S37–S39 in Supporting information). IF staining of CD4/8 in Fig. S40 (Supporting information) demonstrated the highest green (CD4) and red (CD8) fluorescence intensity in the MpRTNP@SD (+) group. Moreover, the collagen I expression was significantly reduced in the MpRTNP@SD (+) group (Fig. S41 in Supporting information), suggesting that SD-208 effectively blocked the TGF-β signaling pathway. Immunohistochemical staining revealed significantly reduced α-SMA and fibronectin content in the MpRTNP@SD (+) group, signifying the deactivation of CAFs (Fig. 5j).
Figure 5
Figure 5.In vivo antitumor efficacy and survival experiment with MpRTNP@SD nanoparticles. (a) Schematic illustration of tumor inoculation, drug administration, tumor volume monitoring, and analysis. (b) Average tumor volume growth curves after treatment (n = 5 per group). (c) Body weight changes over the treatment period. (d) Tumor weights at the therapeutic endpoint. (e) Images of tumors from mice on day 30. (f–h) Semi-quantitative analysis of CD4+Foxp3+ (f), CD8+CD3+ (g), and CD4+CD3+ (h) percentages in tumor tissues following treatment, as measured by flow cytometry. (i) Schematic illustration of the immunogenic TME. (j) Immunohistochemical staining of α-SMA and fibronectin in 4T1 tumors. (k) Schematic illustration of tumor inoculation, drug administration, tumor volume monitoring, and analysis (n = 8 per group). (l) Average tumor volume growth curves. (m) Body weight changes. (n) Survival curves showing the impact of different treatments. (o, p) Tumor tissue analysis using Ki67 (o) and TUNEL (p) staining. Data are presented as mean ± SD. P < 0.05, **P < 0.01, ***P < 0.001, ****P < 0.0001 by one-way ANOVA with Tukey's post hoc test.
CD47 is highly expressed on tumor cells and inhibits macrophage-mediated tumor killing by binding to ligands on the surface of macrophages, which could be blocked by anti-CD47. Therefore, we detected the combined antitumor efficacy of MpRTNP@SD (+) and anti-CD47 (Fig. 5k). The MpRTNP@SD (+) group showed a good antitumor activity (Fig. 5l and Fig. S42 in Supporting information). The combination group- MpRTNP@SD (+) + anti-CD47-further enhanced the antitumor efficacy (Fig. 5l) with prolonged survival time (Fig. 5n). Body weight remained stable throughout the monitoring period (Fig. 5m). The combination therapy outperformed MpRTNP@SD (+) alone, indicating the necessity of anti-CD47 in exerting antitumor response. The significant tumor cell injury and necrosis were observed in the MpRTNP@SD (+) + anti-CD47 group from H & E and TdT-mediated dUTP-biotin nick end labeling (TUNEL) staining results, and the notable tumor cell proliferation inhibition was observed in Ki-67 antibody staining (Figs. 5o and p, Fig. S43 in Supporting information).
In summary, we constructed a pH and ROS sequential-responsive nanomedicine, MpRTNP, based on a mannose-modified, vesicle-to-micelle transformable nanoprodrug encapsulating with SD-208. The ultra-pH sensitivity of PC7A in the polymer skeleton enabled its transformation to hydrophilic PC7A+ in the acidic TME (pH 6.8). This triggered MpRTNP to reassemble, with vesicle-to-micelle conversion and SD-208 release. Subsequently, the mannose ligands on the transformed micelles facilitated internalization into M2-TAMs via mannose receptors. Following 660 nm laser irradiation, the ROS-responsive TK linker was cleaved, releasing Ce6 and generating substantial ROS. This ROS production, along with PC7A, polarized the anti-inflammatory M2-phenotype TAMs into the antitumor M1 phenotype and activated STING-mediated TAM-related innate immunity. SD-208 blocked the interaction of TGF-β with its receptor on immune cells, inhibited CAFs, and reduced Tregs. In vitro and in vivo results showed that the vesicle-to-micelle-convertible nanoprodrug remodeled the TME and elicited antitumor immunity. MpRTNP@SD exhibited an abscopal effect, reducing Tregs and enhancing CD8+ and CD4+ T cell infiltration in primary and distal tumors. When combined with anti-CD47, it also inhibited metastatic tumor growth and extended mouse survival time. Taken together, our intelligent nanoplatform represents a promising targeted antitumor agent, enabling simultaneous spatiotemporal inhibition of immunosuppressive factors and activation of immune stimulators in immunotherapy, addressing major challenges in combination immunotherapy. Although the nanoplatform displays potent potential in possible clinical translation, the wide gap between humans and rodent animals, the difficulty in large-scale production and the thorough purity without any organic solvent residue, may increase the challenges.
Declaration of competing interest
The authors declare that they have no known competing financial interests or personal relationships that could have appeared to influence the work reported in this paper.
This research was supported by National Natural Science Foundation of China (Nos. 52103190 and 52103191), Special Program for Supporting Innovative Youth Talent Teams (No. 32320683) and Start-up Grant (Nos. 32340311 and 35220151) from Zhengzhou University, Natural Science Foundation of Henan Province (No. 242300420127).
Supplementary materials
Supplementary material associated with this article can be found, in the online version, at doi:10.1016/j.cclet.2024.110704.
[1]
S. Gao, X. Yang, J. Xu, et al., ACS Nano 15 (2021) 12567–12603. doi: 10.1021/acsnano.1c02103
[2]
Y. Zhu, X. Yu, S.D. Thamphiwatana, et al., Acta Pharm. Sin. B 10 (2020) 2054–2074. doi: 10.1016/j.apsb.2020.08.010
M. Luo, H. Wang, Z. Wang, et al., Nat. Nanotechnol. 12 (2017) 648–654. doi: 10.1038/nnano.2017.52
[55]
G. Yang, J. Ding, X. Chen, WIRES Nanomed. Nanobiotechnol. 16 (2024) e1985. doi: 10.1002/wnan.1985
[56]
W. Yang, G. Zhu, S. Wang, et al., ACS Nano 13 (2019) 3083–3094. doi: 10.1021/acsnano.8b08346
[57]
J. Wan, L. Ren, X. Li, et al., Proc. Natl. Acad. Sci. U. S. A. 120 (2023) e2210385120. doi: 10.1073/pnas.2210385120
Figure 1
Schematic illustration and characterization of the preparation and action of the sequential-gated transformable nanoprodrug. (a) Illustration of the preparation and responsiveness of MpRTNP@SD. (b) Illustration of the mechanism of MpRTNP@SD in enhancing antitumor immunity through TME modulation and STING activation. (c) UV–vis spectra and images of polymers with or without Ce6 conjugation. (d) Singlet oxygen consumption of MpRTNP at different time points. (e) pH-responsiveness of MpRTNP. (f) TEM images of MpRTNP at pH 7.4 and 6.8, respectively. Scale bar: 200 nm. (g) In vitro SD-208 release from MpRTNP under pH 7.4 or 6.8 within 24 h (n = 3). (h) In vitro Ce6 release from MpRTNP with 10 mmol/L or without H2O2 treatment within 24 h (n = 3). Data are presented as mean ± standard deviation (SD).
Figure 2In vitro macrophage polarization, antifibrosis and transcriptome analysis. (a, b) Semi-quantitative analysis of F480+CD80+ (a) and F480+CD206+ (b) cell populations in RAW264.7 cells with different treatments. (c) Semi-quantitative analysis of α-SMA expression in NIH3T3 cells after different treatments. (d) Differentially expressed genes. (e) Upregulated top KEGG pathway analysis. (f, g) Macrophage polarization volcano plot. (h) Hierarchical cluster analysis for the gene expression of other inflammatory agents (gene ontology (GO) database). Genes were selected from the complete gene list with cut-off |log2FC| > 0.25. (i) KEGG grid diagram of organic systems. (j) Western blot analysis of markers p-TBK1 and p-IRF3 of RAW264.7 cells. Glyceraldehyde-3-phosphate dehydrogenase (GAPDH) served as a loading control. (k) Expression of IFN-β in RAW264.7 cells measured by ELISA. (l) Reverse transcription real-time quantitative polymerase chain reaction (RT-qPCR) analysis of iNOS expression in RAW264.7 cells under various treatments. Data are presented as mean ± SD (n = 3). (−): No laser, (+): With laser irradiation (660 nm, 100 mW/cm2, 3.5 min). Statistical significance was analyzed by one-way ANOVA with Tukey's multiple comparisons test. P < 0.05, **P < 0.01, ***P < 0.001, ****P < 0.0001.
Figure 3In vivo tumor accumulation and TME regulation. (a) In vivo tumor accumulation at different time points. (b) Ex vivo images at 24 h post-injection. (c) Detection of Ce6 fluorescence in macrophages using flow cytometry. (d) T1-MRI images of MpRTNP chelated with Gd3+ at different concentrations. (e, f) T1-weighted MRI images (e) of tumor-bearing mice before and after i.v. injection of Magnevist and MpRTNP chelated with Gd3+in vivo, along with the semi-quantitative analysis (f). (g) Schematic representation and grouping of the in vivo biodistribution and TME remodeling experimental design for panels (h–p). (h, i) Semi-quantitative analysis of CD80+ (h) and CD206+ (i) cells in mice after different treatments. (j, k) Semi-quantitative analysis of CD3+CD8+ (j) and CD3+CD4+ (k) T cells in tumor tissue after different treatments, as measured by flow cytometry. (l) α-SMA staining for characterizing CAFs in tumor tissue following various treatments. Cell nuclei were stained with 4′, 6-diamidino-2-phenylindole (DAPI). (m–p) Detection of cytokines IL-12 (m), IL-10 (n), TGF-β (o), and TNF-α (p) in serum via ELISA after treatments. Data are presented as mean ± SD (n = 3). P < 0.05, **P < 0.01, ***P < 0.001 by one-way ANOVA with Tukey's post hoc test. ns, no significance.
Figure 4In vivo distant efficiency of MpRTNP nanoparticles. (a) Schematic illustration of primary and distant tumor inoculation, drug administration, tumor volume monitoring, and analysis. Individual (b) and average (c) primary tumor volume growth curves following different treatments (n = 6 per group). Individual (d) and average (e) distal tumor volume growth curves. Images of primary tumors (f) and tumor weights (g) in mice on day 18. Distal tumor images (h) and tumor weight (i) for mice on day 18. Representative percentages (j) and semi-quantitative analysis (k) of CD3+CD8+ in primary tumor tissue, as measured by flow cytometry. Representative percentages (l) and semi-quantitative analysis (m) of CD3+CD4+ T cells in distal tumor tissues after different treatments. Data are presented as mean ± SD. P < 0.05, **P < 0.01, ***P < 0.001, ****P < 0.0001 by one-way ANOVA with Tukey's post hoc test.
Figure 5In vivo antitumor efficacy and survival experiment with MpRTNP@SD nanoparticles. (a) Schematic illustration of tumor inoculation, drug administration, tumor volume monitoring, and analysis. (b) Average tumor volume growth curves after treatment (n = 5 per group). (c) Body weight changes over the treatment period. (d) Tumor weights at the therapeutic endpoint. (e) Images of tumors from mice on day 30. (f–h) Semi-quantitative analysis of CD4+Foxp3+ (f), CD8+CD3+ (g), and CD4+CD3+ (h) percentages in tumor tissues following treatment, as measured by flow cytometry. (i) Schematic illustration of the immunogenic TME. (j) Immunohistochemical staining of α-SMA and fibronectin in 4T1 tumors. (k) Schematic illustration of tumor inoculation, drug administration, tumor volume monitoring, and analysis (n = 8 per group). (l) Average tumor volume growth curves. (m) Body weight changes. (n) Survival curves showing the impact of different treatments. (o, p) Tumor tissue analysis using Ki67 (o) and TUNEL (p) staining. Data are presented as mean ± SD. P < 0.05, **P < 0.01, ***P < 0.001, ****P < 0.0001 by one-way ANOVA with Tukey's post hoc test.

 DownLoad:

 下载:
下载:


 下载:
下载:
