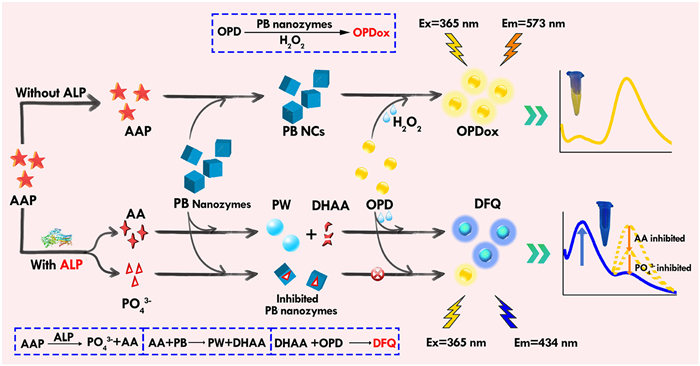
Scheme 1.
Schematic illustration of ratiometric fluorescent sensing of ALP with PB nanozymes-powered commercially available chromogen.
A simplified ratiometric fluorescent sensing strategy for enhanced detection of alkaline phosphatase employing Prussian blue nanozymes and commercially available chromogen
Mingyue Luo , Kehui Zhang , Honghong Rao , Jianying Li , Xin Xue , Panpan Sun , Xiaoquan Lu , Zhonghua Xue

Fluorescence-based strategies have been widely employed in the development of advanced sensors due to their inherent advantages such as high sensitivity and low background noise [1]. To date, the existing fluorescent sensors can be mainly classified into three categories according to their signal generation mechanisms: “turn on”, “turn off”, and ratiometric fluorescence [2,3]. The sensing signals in “turn on” and “turn off” fluorescent methods are often influenced by various factors including probe concentration, instrumental noise, and sample conditions. In contrast, ratiometric fluorescence assays with functional dual-signal responsive features, usually exhibit reduced interference from false signals and yield more reliable detection results [4]. It therefore is well-received attention for ratiometric fluorescence platforms in many sensing applications, such as early disease detection, food safety, and environmental monitoring [5,6]. Nevertheless, current methods for ratiometric fluorescence sensing predominantly rely on the differential responses of target analytes to two distinct fluorescent probes [7]. In many cases, the incorporation of additional fluorescent probes, such as carbon dots, quantum dots, luminescent particles, and clusters, is deemed necessary. For instance, Li et al. developed a ratiometric fluorescence strategy for sarcosine detection utilizing the oxidase-like activity of manganese dioxide nanosheets (MnO2 NSs) alongside blue fluorescent carbon dots [8]. Similarly, Su et al. reported a ratiometric fluorescence method for acetylcholinesterase activity sensing using a single-atom iron-containing nanozyme with POD-like activity and copper nanoclusters [9]. Unfortunately, these approaches frequently necessitate complex preliminary designs and the preparation of fluorescent probes. To address this issue, it is crucial to establish a simplified ratiometric fluorescence method.
It is noteworthy that certain chromogens, such as o-phenylenediamine (OPD) and Amplex Red, can produce fluorescence signal in the given solution systems containing nanozymes or oxidants. For example, OPD, can function as a lone signaling indicator for constructing ratiometric fluorescence sensing systems. In our previous research, the direct catalytic oxidation of OPD by MnO2 NSs was employed to successfully construct a ratiometric fluorescence bioassay for alkaline phosphatase (ALP) detection [10]. As an innovative approach, both blue and yellow fluorescent signal indicators of ratiometric fluorescence system were simply achieved by using single fluorescent signal precursor of OPD. However, MnO2 NSs with an intrinsic oxidizing property were typically utilized as fluorescence quenchers, therefore can too easily lead to fluorescence quenching and potential interferences for detection results [11]. For instance, MnO2 NSs have been demonstrated to significantly quench blue fluorescence emitted by carbon dots and luminol [12,13]. And the wider ultraviolet absorption of MnO2 NSs may also lead to potential false-negative results. Therefore, the employment of oxidizing agents and chromogenic substrates in the development of a ratiometric fluorescence sensor has inherent limitations. In this regard, nanozymes exhibit a good compatibility with chromogens, and this conclusion can be clearly drawn from an increasing development of nanozymes-based colorimetric sensors. Since the pivotal discovery of Fe3O4 nanoparticles as mimetics of peroxidase-like enzymes in 2007, nanozymes have attracted considerable interests over the last decade [14,15]. Among these widely concerned domains of nanozymes research, the formulation of straightforward ratiometric fluorescence strategies is more essential for their practical application. For example, researchers have reported the use of nanozymes with intrinsic fluorescence and chromogens OPD to fabricate ratiometric fluorescent sensors, which is also very simple in sensor design [16,17]. However, the matching of the excitation wavelength of dual fluorescent signals as well as the intensity of nanozymes with intrinsic fluorescence cannot be ignored in the design. Therefore, we consider constructing simpler ratiometric fluorescence systems triggered by the target based on one chromogen generating two fluorescence signals.
Prussian blue (PB) nanoparticles have been demonstrated to be more advantages in various application, such as excellent biocompatibility, straightforward fabrication, cost-effectiveness, controllable morphology, and remarkable stability [18]. Furthermore, PB has been documented to possess multiple enzyme-like activities, therefore rendering it more suitable for sensing applications [19]. Taking this benefit, we herein designed an enhanced ratiometric fluorescence system for ALP detection only using PB nanozymes and commercially available chromogen of OPD (Scheme 1). PB nanozymes with POD-like activity could effectively catalyze the oxidation of OPD to yield 2,3-diaminophenazine (OPDox) with an intense yellow fluorescence. With the addition of ALP, ascorbic acid 2-phosphate (AAP) may be hydrolyzed to produce phosphate and ascorbic acid (AA), the resultant phosphate further absorbing onto the surface of PB nanozymes and inhibiting PB nanozymes enzymatic activity, resulting in an obvious reduction of OPDox generation. Simultaneously, another hydrogenated product of AA with strong reducing capability could further reduce PB to Prussian white (PW), which further diminishing OPDox production due to the lack of enzyme-like activity. As a result, both hydrolysis products effectively reduced the yellow fluorescent compound OPDox via different process mechanism, thus would amplify the sensing signal of OPDox generation so as to enhance the sensing sensitivity. Furthermore, in this design, AA was oxidized to dehydroascorbic acid (DHAA), which could exclusively react with OPD to generate the blue fluorescent product of 3-(dihydroxyethyl)furo[3,4-b]quinoxaline-1-one (DFQ). Ultimately, the enhanced ratiometric fluorescence sensing platform was successfully established, evidenced by the decrease of the OPDox signal at 573 nm and the increase of the DFQ signal at 434 nm, facilitating the fluorescent visual detection of ALP.
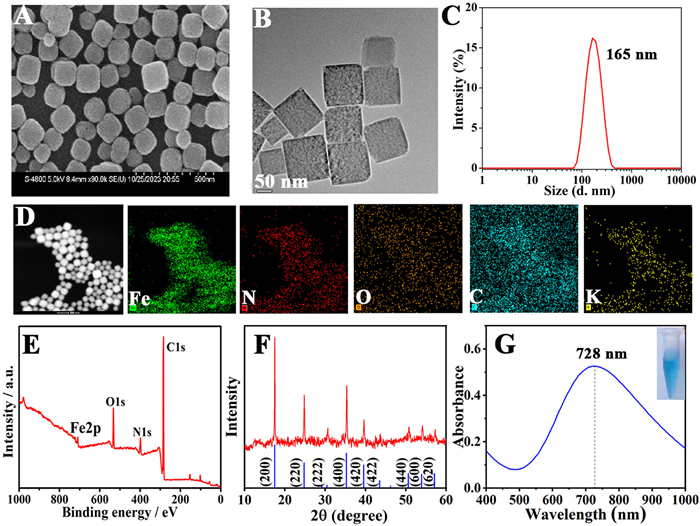
The morphology, and composition of the obtained PB nanocubes (PB NCs) were characterized by using scanning electron microscopy (SEM), transmission electron microscopy (TEM), dynamic light scattering (DLS), energy dispersive X-ray (EDX) mapping, X-ray photoelectron spectroscopy (XPS), X-ray diffraction (XRD), and ultraviolet-visible (UV–vis) spectroscopy, respectively. As illustrated in Figs. 1A and B, the SEM and TEM images confirm that the PB NCs exhibit a characteristic cubic morphology, with an average size of approximately 150 nm, while the kinetic hydration diameter is measured at 165 nm (Fig. 1C). Elemental mapping (Fig. 1D) and EDX analysis (Fig. S1 in Supporting information) validate the presence of Fe, N, O, C and K within the PB NCs, further confirming the successful synthesis of polyvinylpyrrolidine (PVP)-stabilized PB NCs. XPS analysis was conducted to investigate the surface and near-surface elemental composition, the observed peaks at 285.1, 397.8, and 532.6 eV correspond to C 1s, N 1s, and O 1s (Fig. 1E), revealing the existence of C, N, O, and Fe [20,21]. While the weaker signals at 721.9 eV and 708.9 eV correspond to Fe 2p, exhibiting two pairs of doublets identified as Fe 2p1/2 and 2p3/2. Further peak deconvolution indicate that distinct peaks at 708.8 and 721.8 eV are attributed to Fe2+ (Fig. S2 in Supporting information), whereas the less intense peaks at 713.3 and 727.0 eV correspond to Fe3+ [22]. The XRD patterns further corroborate the formation of PB NCs (Fig. 1F), with peaks at 17.5°, 24.8°, 30.6°, 35.3°, 39.6°, 43.6°, 50.7°, 54.1°, and 57.2° attributed to the (200), (220), (222), (400), (420), (422), (440), (600), and (620) diffraction planes of PB crystals (JCPDS PDF #52–1907) [23]. The PB NCs displayed a broad absorption band between 500 nm and 1000 nm, with a prominent peak at 728 nm. Additionally, PB nanoparticles were observed to be well-dispersed in aqueous solution, exhibiting a blue coloration (inset in Fig. 1G). All these observations strongly indicate the successful synthesis of PB NCs.
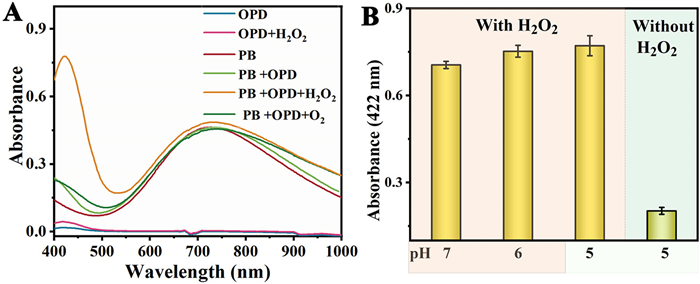
To evaluate the enzyme-mimetic activity of PB NCs, the UV–vis absorption spectra of various components within the PB NCs-OPD colorimetric reaction system were initially assessed. As shown in Fig. 2A, when the two substrates of OPD and H2O2 coexist, the solution color changes from colorless to yellow and a strong absorption peak at 422 nm, which corresponding to the generation of OPD oxidation product (OPDox) during the colorimetric reactions. The oxidation product of OPD was identified by mass spectra Fig. S3. Correspondingly, there were no color changes with a single substrate and PB NCs or when two substrates existed alone. This phenomenon indicated that PB NCs had POD-like activity. Given the reliance of oxidase-like (OXD-like) activity on molecular oxygen [24], PB NCs displayed negligible OXD-like activity. The pH was identified as a critical factor that influencing the activity of nanozymes [25]. As shown in Fig. 2B, the absorbance values at 422 nm of OPDox by PB nanozymes catalyzed reaction at pH values of 5, 6 and 7 were relatively consistent. Furthermore, the oxidation reactions were compared in the presence and absence of H2O2. Notably, OPD oxidation did not occur under acidic conditions without H2O2. And the steady-state kinetics were further conducted (Fig. S4, Table S1). It is acknowledged that a lower Km and a higher Vmax indicates an enzyme's high affinity and conversion efficiency for the substrate. In comparison to other catalysts, including HRP enzymes and various nanozymes, PB nanozymes exhibit relatively lower Km and higher Vmax values, thus demonstrating a stronger substrate affinity and conversion efficiency. These observations further confirm the desired POD-like activity of PB nanozymes, even in neutral pH.
Additionally, the presence of •OH and O2•− was verified using electron paramagnetic resonance (EPR) spectroscopy with DMPO as the trapping agent. As depicted in Fig. S5A (Supporting information), the characteristic EPR peaks displayed an intensity ratio of 1:2:2:1, indicative of the DMPO/•OH product, which implies that the production of •OH from H2O2 reduction was catalyzed by PB nanozymes. Similarly, the EPR spectra exhibited four prominent peaks with an intensity ratio of 1:1:1:1 (Fig. S5B in Supporting information), indicating the generation of the O2•− radical. These experimental findings suggest that the possible sensing mechanism operates via the free reactive oxygen species (ROS) pathway [26]. Initially, H2O2 is adsorbed onto the surface of PB nanozymes. Subsequently, the O-O bond of H2O2 is catalytically cleaved by PB nanozymes, resulting in the formation of •OH (Eq. 1). Then the produced •OH then reacts with H2O2 to yield O2•− (Eq. 2). Finally, the colorless OPD molecule undergoes further oxidation by •OH and O2•−, leading to the formation of the yellow product OPDox (Eq. 3).
|
|
(1) |
|
|
(2) |
|
|
(3) |
In this work, ALP was selected as the detection model due to its significance as a critical phosphohydrolase within the human body that involving with numerous physiological processes [27,28]. While numerous fluorescent methods for detecting ALP have been documented, there is a paucity of literature pertaining to assay principles that employ the simultaneous utilization of both generated hydrolysis products. As depicted in Fig. 3A, the hydrolysis products AA and phosphate both interact with PB nanozymes in our design. Initially, we assessed the oxidation of OPD by PB nanozymes with and without phosphate across different buffer solutions under identical experimental conditions (Fig. 3B). It was observed that in acetate buffer, the oxidation of OPD was markedly inhibited before and after phosphate addition. This behavior may be attributed to acetate's properties as a weak monodentate acid salt complexing agent, which exhibits limited adsorption on material surfaces and may be readily replaced by stronger ligands [29]. Under this condition, phosphate may preferentially adsorb onto the PB nanozymes surface, thereby inhibiting the enzymatic activity. Then, various phosphate types were introduced into the system for further evaluation. The addition of different concentrations of sodium hydrogen phosphate and disodium hydrogen phosphate had no significant effect on the oxidation of OPD, but the addition of sodium phosphate significantly inhibited the oxidation of OPD, and with the increase of sodium phosphate concentration, the oxidation inhibition was more significant (Fig. 3C and Fig. S6 in Supporting information). And the fluorescence spectra also verified the above experimental results (Fig. 3D).
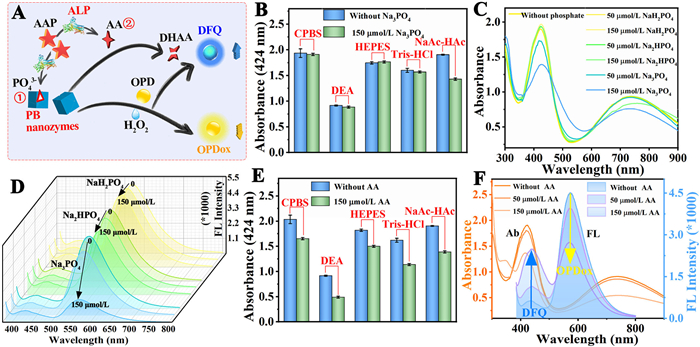
Subsequently, as depicted in Fig. 3E, the addition of AA significantly inhibited the oxidation of OPD in all tested buffers, which can be attributed to the strong reducing ability of AA [30]. Following the introduction of AA, a notable decrease on the absorbance of oxidized OPD (OPDox) at 424 nm and PB at 728 nm was observed. Additionally, a decrease in the fluorescence emission peak at 573 nm was observed upon excitation at 365 nm, while a new fluorescence emission peak emerged at 434 nm (Fig. 3F). This was accompanied by a gradual change in the fluorescence of the solution from bright yellow to light blue (Fig. S6D). These findings were closely associated to the formation of DFQ. Furthermore, high-resolution mass spectrometry was employed to substantiate this reaction mechanism (as discussed in Fig. S7 in Supporting information). In summary, multiple approaches confirmed that both phosphate and AA influence the OPD oxidation process that catalyzed by PB nanozymes, with clear identification of the key products DFQ and OPDox.
To validate the sensing principle, the interactions were characterized using UV–vis spectroscopy, Fourier-transform infrared spectroscopy (FT-IR), and isothermal titration calorimetry (ITC). During feasibility assessments, a significant modification in the characteristic absorption peak of PB around 700 nm was recorded (Figs. 3C and F). This change is attributable to the structural composition of PB, which consists of Fe(Ⅱ), Fe(Ⅲ), and cyano (-CN-) groups [31]. As illustrated in Fig. 4A, the absorbance at 728 nm exhibited a rapid decline from 1.0 to ~0.5 upon AA addition, with completion of the reaction occurring within 5 min. Based on the structural properties of PB, it is hypothesized that the potent reducing action of AA converts Fe3+-CN in PB nanozymes to Fe2+-CN, leading to an obvious decrease on absorbance at 728 nm. And we also confirmed that AA is more likely to react with PB nanozymes rather than H2O2 in this system (Fig. S8 in Supporting information). Additionally, a gradual decrease on absorbance at 728 nm was noted over 30 min following phosphate introduction, indicating a potential interaction between phosphate and Fe3+ during this process.
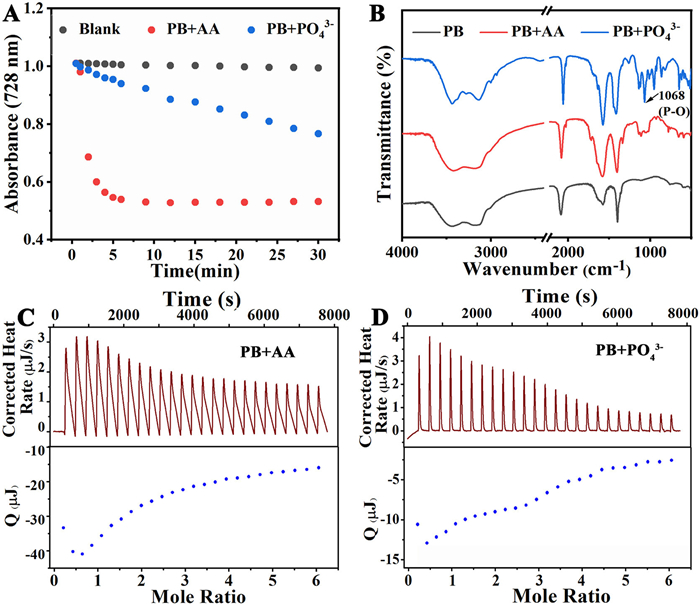
The reaction mechanism was further corroborated by FT-IR analysis. Following the addition of AA and phosphate, no obvious change on the characteristic cyanide peak at 2087 cm−1 in the infrared spectrum of PB nanocomposites (NCs) could be observed (Fig. 4B) [32], suggesting no structural alteration of PB NCs occurred. Notably, as depicted by the blue line in Fig. 4B, new peaks emerged within the range of 500–1250 cm−1 after adding phosphate, with the peak at 1068 cm−1 corresponding to the P-O bond, confirming the successful adsorption of phosphate onto PB NCs [33,34]. Furthermore, a minor peak at 1200 cm−1 may be attributed to the formation of metal phosphate bonds between phosphate and PB NCs, indicating that phosphate interacts with Fe2+/Fe3+ in the PB NCs [34].
ITC serves as a sophisticated technique to concurrently assesses all pertinent binding parameters under designated experimental conditions, relying on precise measurements of the thermal changes associated with complex formation [35]. Figs. 4C and D illustrate the ITC curves corresponding to the interactions between AA, phosphate, and PB nanozymes, and the comprehensive thermodynamic parameters are detailed in Table S2 (Supporting information). Initial titrations of PB nanozymes with blank buffer revealed no significant thermal variations (Fig. S9 in Supporting information). However, substantial thermal changes were evident upon the addition of AA and phosphate. For the AA and PB nanozymes interaction, an enthalpy change (ΔH) of <0 and an entropy change (ΔS) of <0 indicate an exothermic and entropy-decreasing process. This suggests that the interaction is predominantly enthalpy-driven, likely involving van der Waals forces and hydrogen bonding [36]. In the case of phosphate binding to PB nanozymes, thermodynamic parameters indicate ΔH <0 and ΔS >0, reflecting a mild exothermic reaction accompanied by an increase in entropy. This process is driven by both enthalpy and entropy, primarily through hydrophobic interactions and hydrogen bonds [35]. The TEM images directly showed the morphologic changes of PB nanozymes before and after ALP addition to further investigate the proposed sensing mechanism. As displayed in Fig. S10 (Supporting information), it could be observed that the original cubic structure of the PB nanozymes collapsed and the morphology of some PB nanozymes became irregular after reacting with ALP. With the increase of ALP concentration, the collapse of the cube morphology of PB nanozyme was more obvious. It indicated that the PB nanozymes to PW morphological evolution is obviously dependent on the reaction between ALP and PB nanozymes. Given the above, all these results confirm that PB nanozymes, as a sensing medium, could effectively adsorb phosphate and engage in redox reactions with AA, thereby facilitating subsequent ALP analysis.
Under optimized experimental conditions (Figs. S11 and S12 in Supporting information), fluorescence spectrum for both phosphate and AA with different concentrations were measured individually (Fig. S13 in Supporting information). The feasibility of the PB nanozymes-OPD-H2O2 reaction system for ALP detection was initially investigated. As demonstrated in Fig. 5A and Fig. S14 (Supporting information), a distinct green color was observed only in the presence of PB nanozymes, OPD, and H2O2. Concurrently, a pronounced UV absorption peak at 425 nm and a significant fluorescence peak at 573 nm were recorded. The mixture of the inherent blue of PB nanozymes with the yellow product resulted in a green hue. The simultaneous presence of AAP and ALP induced observable color transitions from green to yellow-green. Additionally, a reduction in absorbance at 425 nm was accompanied by a decrease in fluorescence intensity at 573 nm, alongside an increase in fluorescence at 434 nm. This phenomenon is associated with ALP-mediated production of AA and phosphate, which inhibits the activity of PB nanozymes and generates the specific substrate DFQ.
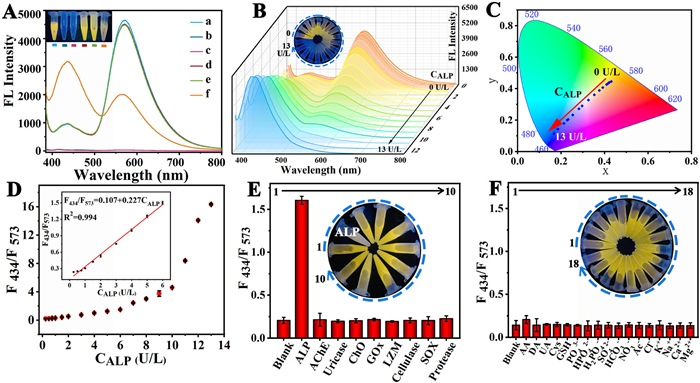
Subsequently, after the optimization of AAP concentration and incubation time (Fig. S15 in Supporting information), the sensing performance of the proposed ratiometric fluorescent sensor for ALP was assessed. As illustrated in Fig. 5B, a fluctuation in ALP concentration from 0 to 13 U/L resulted in a gradual decrease in fluorescence intensity at 573 nm, accompanied by a corresponding increase at 434 nm. The CIE chromaticity diagram in Fig. 5C demonstrates that the prominent yellow fluorescence became progressively lighter while the blue fluorescence intensified. As shown in Fig. 5D, a linear relationship was established between the fluorescence ratio F434/F573 and ALP concentration within the range of 0.25–6 U/L. The quantitative relationship was expressed as F434/F573 = 0.107 + 0.227 CALP, with an R2 value of 0.994. The calculated detection limit for ALP was determined to be 0.112 U/L (signal to noise ratio (S/N) = 3), significantly lower than the diagnostic threshold for ALP detection. A comparison between the sensing performances of various nanozyme-based ratiometric fluorescence methods for ALP detection was made, as demonstrated in Table S3 (Supporting information). The established ratio fluorescence method, not only enables the detection of ALP activity under neutral conditions but also offers a relatively simple and convenient approach without the need for additional fluorescent probes or dual excitation wavelengths.
To assess the selectivity of the proposed ratiometric fluorescence sensing strategy, the fluorescence response of the reaction system was examined upon the addition of certain interferents. The effects of eight natural enzymes were investigated as potential interferents in ALP determination. As depicted in Fig. 5E, only ALP induced a significant alteration in the fluorescence intensity ratio, while the other interfering substances showed negligible impact on the determination results, even at a concentration 10 times greater than that of ALP. In consideration of practical applications in detecting actual biological samples (such as serum, saliva, and urine), the concentration range of reducing substances in serum samples was investigated (Table S4 in Supporting information). Based on the maximum concentration of these substances, they were introduced into the reaction system to identify any potential interference factors. The experimental results, illustrated in Fig. 5F, indicated that low concentrations of reducing substances did not significantly affect fluorescence intensity. Similarly, no notable changes in fluorescence intensity were observed in the presence of common anions, cations, and amino acids (Fig. S16 in Supporting information). Collectively, these results signify that the established sensing system demonstrates high selectivity for ALP detection, thereby indicating promising application potential in real biological sample analysis. But since the detection principle of our proposed approach is based on the reducing capacity of AA and the inhibiting effect of phosphate, and thereby the existence of high concentration of AA, phosphate and some biologically reducing molecules may also affect the results of the detection. For interference from these small molecules in real sample, a pretreatment was needed, such as adding masking reagent or centrifugation against an ultrafilter [37].
The accuracy of the methods were further ascertained for the detection of ALP from human serum samples via standard-addition method, with percentage recoveries in the range from 100.3% to 104.0%, and 98% and 102% for two samples, respectively, as shown in Table S5 (Supporting information). To further evaluate the practicality of the proposed sensing platform, direct addition of 10 µL untreated human serum samples into the reaction system was performed for the determination of ALP content. The average F434/F573 obtained from sample 1 and sample 2 were approximately 0.262 and 0.196, respectively. By substituting these values into the linear equation established for ALP quantification through the proposed ratiometric fluorescence method, the determined ALP concentrations for the final two samples were calculated to be 137 and 78 U/L, respectively. The concentration of ALP in the sample was determined to be within the reference range for normal adults (40–160 U/L), indicating that it originated from a source of normal adult individuals. After further verification by the p-nitropheny phosate (pNPP) standard determination method (Fig. S17 in Supporting information), the ALP concentrations in the two real samples were determined to be 139 ± 2.6 and 74 ± 2.8 U/L, respectively. The results obtained by the two methods are basically the same, as shown in Table S6 (Supporting information). These experimental results show that the proposed ratiometric fluorescence sensor can accurately and reliably determine the ALP level in real samples. Furthermore, the repeatability and stability of the proposed ratiometric fluorescence platform was demonstrated (Fig. S18 in Supporting information).
In conclusion, a simple and effective ratiometric fluorescence approach utilizing PB nanozymes and commercially available chromogen has been developed for the highly sensitive and selective detection of ALP. The hydrolysis products AA and phosphate could effectively decrease the OPDox generation via a dual-path based inhibition on the PB nanozymes POD-like activity, thereby supporting sensitive ALP detection. Additionally, the specific interaction between DHAA (the oxidation product of AA and OPD enhances the potential for selective ALP detection. This strategy offers advantages of sensitivity, selectivity, simplicity, and practicality, serving as a significant reference for the advancement of more efficient ratiometric fluorescence analyses based on nanozymes. It is worth noting that the role of PB nanozymes in our design is diversified, such as the direct use of PB nanozymes and the color of the chromogen OPD to construct multi-colorimetric sensing, and simply employing of smart phones to achieve sensitive point-of-care testing in the future.
Human serum specimens were collected from healthy adult volunteers at Hospital 940 of PLA Joint Logistics Support Force, Lanzhou, China. We state that all experiments were performed in accordance with the principles of the Helsinki Declaration, and approved by the Ethics Committee at Northwest Normal University and Hospital 940 of PLA Joint Logistics Support Force (No. 2022KYLL076), and informed consent was obtained from the volunteers participating in the present study.
The authors declare that they have no known competing financial interests or personal relationships that could have appeared to influence the work reported in this paper.
Mingyue Luo: Writing – original draft, Validation, Methodology, Investigation, Formal analysis, Data curation, Conceptualization. Kehui Zhang: Investigation, Formal analysis. Honghong Rao: Validation, Resources, Funding acquisition, Formal analysis, Data curation. Jianying Li: Investigation, Formal analysis. Xin Xue: Investigation, Formal analysis. Panpan Sun: Formal analysis, Data curation. Xiaoquan Lu: Methodology, Conceptualization. Zhonghua Xue: Writing – review & editing, Supervision, Resources, Project administration, Methodology, Funding acquisition, Formal analysis, Conceptualization.
This work was supported by the National Natural Science Foundation of China (No. 22064014), the Science and Technology Development Plan Project of Lanzhou (No. 2021–1-146), the Science and Technology Project of Gansu Province (Nos. 21YF5FA071, 21JR7RA538), the Industrial Support Programme for Higher Education Institutions Project (Nos. 2023CYZC-69, 2024CYCZ-05), and the 2023 Gansu Provincial Key Talent Project (No. 2023RCXM26).
Supplementary material associated with this article can be found, in the online version, at doi:
G.Y. Chen, T.Q. Chai, H. Zhang, F.Q. Yang, Coord. Chem. Rev. 508 (2024) 215761. doi: 10.1016/j.ccr.2024.215761
Z. Luo, Y. Li, P. Zhang, et al., TrAC Trends Anal. Chem. 151 (2022) 116582. doi: 10.1016/j.trac.2022.116582
B.B. Chen, M.L. Liu, Y.T. Gao, et al., Nano Res. 16 (2023) 1064–1083. doi: 10.1007/s12274-022-4840-2
Z. Lu, M. Chen, M. Li, et al., Chem. Eng. J. 439 (2022) 135686. doi: 10.1016/j.cej.2022.135686
Y. Shen, Y. Wei, C. Zhu, et al., Coord. Chem. Rev. 458 (2022) 214442. doi: 10.1016/j.ccr.2022.214442
R. Gui, H. Jin, X. Bu, et al., Coord. Chem. Rev. 383 (2019) 82–103. doi: 10.1016/j.ccr.2019.01.004
W. Chen, Y. Chen, C. Shen, et al., Sensors Actuators B: Chem. 414 (2024) 135947. doi: 10.1016/j.snb.2024.135947
W. Li, T. Li, S. Chen, et al., Sensors Actuators B: Chem. 355 (2022) 131341. doi: 10.1016/j.snb.2021.131341
M. Wang, L. Liu, X. Xie, et al., Sensors Actuators B: Chem. 313 (2020) 128023. doi: 10.1016/j.snb.2020.128023
R. Wang, Z. Wang, H. Rao, et al., Chem. Commun. 57 (2021) 4444–4447. doi: 10.1039/d1cc00244a
S.D. Hiremath, M. Banerjee, A. Chatterjee, ACS Appl. Nano Mater. 5 (2022) 17373–17412. doi: 10.1021/acsanm.2c03470
Q. Su, L. Gan, Y. Zhu, X. Yang, Sensors Actuators B: Chem. 335 (2021) 129715. doi: 10.1016/j.snb.2021.129715
H. Sha, B. Yan, Nanoscale 13 (2021) 20205–20212. doi: 10.1039/d1nr05376k
J. Zhang, J. Liu, Luminescence 35 (2020) 1185–1194. doi: 10.1002/bio.3893
K. Feng, Z. Wang, S. Wang, et al., Nat. Commun. 15 (2024) 5908. doi: 10.1038/s41467-024-50344-7
C. Zhang, P. Ni, B. Wang, et al., Chin. Chem. Lett. 33 (2022) 757–761. doi: 10.1016/j.cclet.2021.08.017
Y. Xia, K. Sun, Y.N. Zuo, S. Zhu, X.E. Zhao, Chin. Chem. Lett. 33 (2022) 2081–2085. doi: 10.1016/j.cclet.2021.08.083
M. Shukla, N.V. Verma, Z. Mohanta, et al., Coord. Chem. Rev. 496 (2023) 215414. doi: 10.1016/j.ccr.2023.215414
H. He, M. Long, Y. Duan, N. Gu, Nanoscale 15 (2023) 12818–12839. doi: 10.1039/d3nr01741a
C. Xu, Y. Shan, M. Bilal, et al., Chem. Eng. J. 395 (2020) 125093. doi: 10.1016/j.cej.2020.125093
M. Veerapandian, S. Sadhasivam, J. Choi, K. Yun, Chem. Eng. J. 209 (2012) 558–567. doi: 10.1016/j.cej.2012.08.054
L. Guo, Y.J. Zhang, Y.L. Yu, J.H. Wang, Anal. Chem. 92 (2020) 14806–14813. doi: 10.1021/acs.analchem.0c03575
C.Q.X. Lim, T. Wang, E.W.Y. Ong, Z.K. Tan, Adv. Mater. Interfaces 7 (2020) 2000853. doi: 10.1002/admi.202000853
C. Fan, J. Zhao, Y. Tang, Y. Lin, J. Anal. Testing 7 (2023) 272–284. doi: 10.1007/s41664-023-00257-z
K. Feng, G. Wang, S. Wang, et al., Adv. Mater. 36 (2024) 2401619. doi: 10.1002/adma.202401619
Y. Xu, Z. Zhou, N. Deng, et al., Sci. China Chem. 66 (2023) 1318–1335. doi: 10.1007/s11426-022-1529-y
X. Zhou, M. Wang, M. Wang, X. Su, ACS Appl. Nano Mater. 4 (2021) 7888–7896. doi: 10.1021/acsanm.1c01220
Y. Zhang, Y. Cao, Y. Liu, et al., Nano Res. 16 (2023) 11250–11258. doi: 10.1007/s12274-023-5863-z
M. Raineri, E.L. Winkler, T.E. Torres, et al., Nanoscale 11 (2019) 18393–18406. doi: 10.1039/c9nr05799d
W. Zhang, Y. Lan, D.F. Chai, et al., J. Mol. Struct. 1302 (2024) 137507. doi: 10.1016/j.molstruc.2024.137507
Z. Qin, Y. Li, N. Gu, Adv. Healthc. Mater. 7 (2018) 1800347. doi: 10.1002/adhm.201800347
L.C. Wang, P.Y. Chiou, Y.P. Hsu, et al., Nat. Commun. 14 (2023) 4709. doi: 10.1007/s11071-022-08050-w
E. Burattini, M. Cavagna, R. Dell’Anna, et al., Vibrat. Spectrosc. 47 (2008) 139–147. doi: 10.1016/j.vibspec.2008.04.007
W. Chen, G. Gao, Y. Jin, C. Deng, Talanta 216 (2020) 120930. doi: 10.1016/j.talanta.2020.120930
D. Prozeller, S. Morsbach, K. Landfester, Nanoscale 11 (2019) 19265–19273. doi: 10.1039/c9nr05790k
S. Guo, Y. Liang, S. Tricard, et al., Chem. Phys. Lett. 710 (2018) 180–187. doi: 10.1016/j.cplett.2018.09.003
S.G. Liu, L. Han, N. Li, et al., Sensors Actuators B: Chem. 283 (2019) 515–523. doi: 10.1016/j.snb.2018.12.052

Scheme 1 Schematic illustration of ratiometric fluorescent sensing of ALP with PB nanozymes-powered commercially available chromogen.

Figure 1 Characterization of the obtained PBNCs. (A) SEM image, (B) TEM image, (C) DLS measurements, (D) elemental mapping, (E) XPS survey spectra, (F) XRD spectra, (G) UV–vis absorption spectra and the photo of the solution (inset).

Figure 2 (A) UV–vis spectra of PB nanozymes-OPD system solution under different conditions. (B) The oxidation of OPD by PB nanozyme at different pH and with or without H2O2. Data are presented as mean ± standard deviation (SD) (n = 3).

Figure 3 (A) Schematic illustration of the ratio fluorescence system for ALP detection. (B) Oxidation of OPD in the presence and absence of phosphate in different buffers. (C) UV absorption spectra and (D) fluorescence spectra of the proposed system in the presence and absence of different types of phosphates. (E) Oxidation of OPD in the presence and absence of AA in different buffers. (F) UV absorption spectra and fluorescence spectra of the proposed system in the presence and absence of AA. Data are presented as mean ± SD (n = 3).

Figure 4 (A) Scatter plot of absorbance values at 728 nm versus time for PB reacted with 150 µmol/L of AA and phosphate. (B) FT-IR of PB after reaction with AA and phosphate in buffer solution. ITC traces of titrating (C) AA and (D) phosphate into PB nanozymes.

Figure 5 (A) ALP detection feasibility analyses corresponding to fluorescence spectra (a: PB+OPD+H2O2, b: ALP +OPD+H2O2, c: AAP+OPD+H2O2, d: ALP+PB+OPD+H2O2, e: AAP+PB+OPD+H2O2, f: AAP+ALP+PB+OPD+H2O2). (B) 3D fluorescence spectra of ALP at concentrations of 0–13 U/L were present. (C) CIE chromatograms with 0–13 U/L ALP. (D) Correlation between F434/F573 and ALP concentration. Inset: linear correlation between F434/F573 and ALP concentration (0.25–6 U/L). (E) Fluorescence intensity ratios in the presence of ALP and different kinds of natural enzymes and (F) different kinds of reducing substances, anions and cations.

 扫一扫看文章

扫一扫关注我们
 DownLoad:
 下载:
下载:
 下载:
下载: