yzhuang@simm.ac.cn (Y. Huang). 1 These authors contributed equally to this work.
Received Date:
16 July 2024 Accepted Date:
20 November 2024 Revised Date:
13 November 2024 Available Online:
15 September 2025
Abstract:
Rheumatoid arthritis (RA) is a refractory autoimmune disease with limited treatment options. Plant-derived exosomes-like nanovesicles (PDENs) have emerged as a novel nanomedical approach, with the inherent bioactive compounds from their source plants. The roots of Morinda officinalis How. (MO), a Chinese herb, exhibit notable anti-inflammatory activities and hold promising therapeutic value. We engineered a joint-targeting delivery system (termed MOE@EM) by masking MO-derived exosomes-like nanovesicles (MOE) with erythrocyte membrane (EM). This biomimetic strategy, using EM camouflage, is intended to improve the in vivo fate of MOE. We investigated the antioxidative and anti-inflammatory activities, immunogenicity, drug accumulation in the joint, and therapeutic efficacy to ascertain its suitability for RA therapy. UV irradiation significantly increased the activities of catalase and peroxidase of MOE, and enhanced the anti-inflammatory effects via the Wnt/β-catenin pathway. Furthermore, MOE@EM markedly attenuated dendritic cell activation. MOE@EM exhibited joint-specific delivery, with substantial reduction in paw swelling, and favorable modulation of immune microenvironment.
In 2020, approximately 17.6 million individuals were afflicted with rheumatoid arthritis (RA), and the number was estimated to increase to 31.7 million by 2050 [1]. RA is characterized by chronic cellular activation that leads to autoimmunity in the joints and other organs [2], resulting in persistent inflammation and progressive destruction of articular cartilage and joint capsule, causing joint deformity with a high incidence of disability, thus seriously impairing the life quality of the patients [3]. Clinical treatment for RA primarily employs anti-inflammatory drugs [4], including non-steroidal anti-inflammatory drugs (NSAIDs), disease-modifying anti-rheumatic drugs (DMARDs), and biological agents. However, long-term use of NSAIDs and DMARDs comes with significant side effects, such as gastrointestinal reactions and liver and kidney toxicities [5], while biologics may elicit the production of anti-drug antibodies that diminishing therapeutic efficacy [6]. Consequently, there is a critical demand for novel RA treatments that are both effective and safe.
Extracellular vesicles (EVs) are cell-derived nanovesicles (40–160 nm) [7]. EVs contain multiple components such as nucleic acids, proteins, and metabolites, which often possess potential therapeutic functions akin to their donors [8]. Recently, plant-derived exosomes-like nanovesicles (PDENs) have gained increasing attention for their wide availability and cost-effectiveness in comparison to mammalian EVs [9]. PDENs harbor active compounds from their plant origins [10], thereby providing a valuable source to obtain therapeutic EVs from well-characterized medicinal plants [11]. In traditional Chinese medicine, a number of herbs have been utilized in RA treatment, with activities of relieving synovitis and improving joint pain and mobility without noticeable side toxicities [12]. Among them, the roots of Morinda officinalis How. (MO), known as Ba Ji Tian (Chinese herb name) in the Chinese herbal name, has been demonstrated with anti-inflammatory and anti-osteoporotic effects [13,14], representing a promising herb resource in RA therapy [15]. Nevertheless, the therapeutic potential of MO-derived exosomes-like nanovesicles (termed MOE) for RA remains unexplored.
It is important to note two primary obstacles against the medical translation of PDENs—immunogenicity and low yields [16]. PDENs can be rapidly cleared by the immune system due to their exogenous macro-biomolecules and may even provoke antigenicity [17]. Additionally, the production yields of PDENs are very low, imposing a challenge of practical use [18]. There is an old saying that “For every problem, nature has a solution”, inspiring us seek a biomimetic solution. Regarding PDENs as a class of biochemical and informational carriers secreted by plants, its secretion can be stimulated by external factors [19,20], including heat, hypoxia, and radiation [21]. We hypothesized that ultraviolet (UV) light exposure could serve as an engineering strategy to stimulate PDEN production. To mitigate the immunogenicity associated with PDENs in injectable applications, we drew inspiration from erythrocytes’ long-circulating effects. Erythrocytes use membrane proteins to release a “don't eat me” signal to the immune system, significantly extending their in vivo circulation time to up to 4 months [22]. Consequently, erythrocyte membrane (EM) has been widely used to camouflage nanomedicines for long-circulation and reduced immunogenicity [23]. In this study, we employed EM as a second engineering strategy to overcome the immunogenicity of PDENs. This biomimetic engineering strategy combining UV pretreatment and EM camouflage, aims to enhance the translational application of PDENs in the anti-RA treatment.
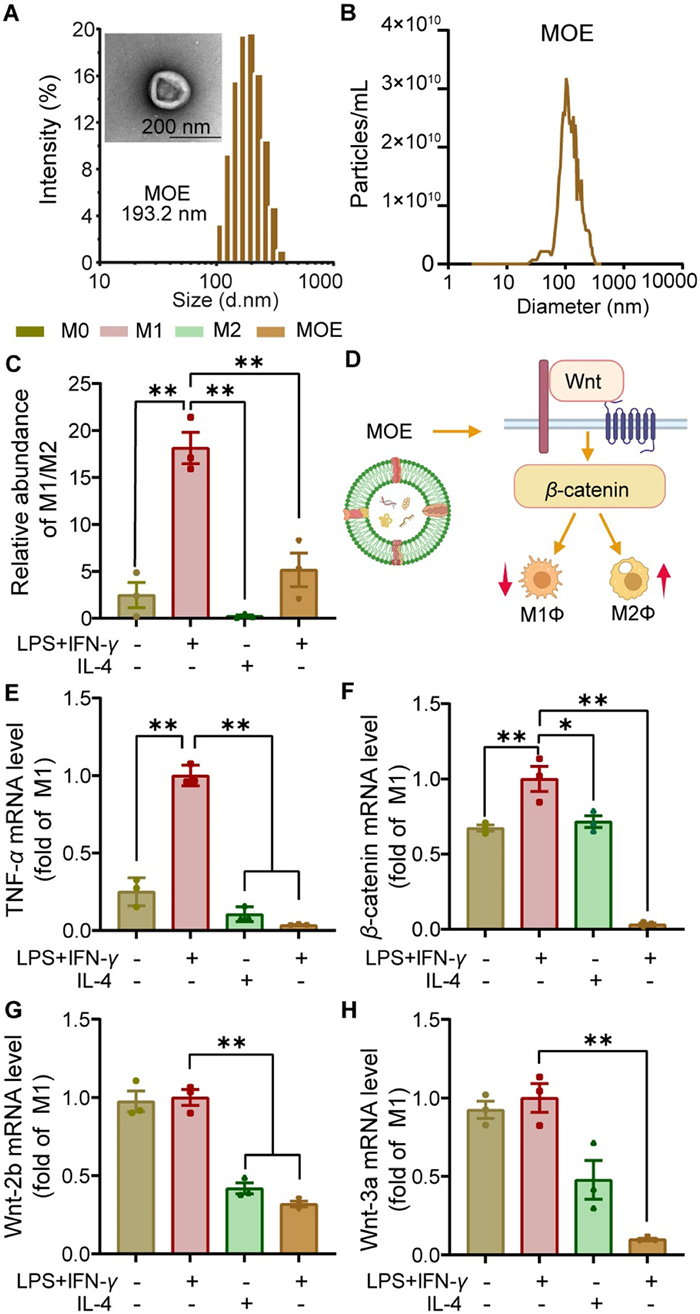
Initially, we obtained MOE via the differential centrifugation and size exclusion chromatography (SEC). The size and morphologic characterization of MOE was shown in Fig. 1A. For 1 kg of fresh MO, 15 mL of purified MOE was obtained, with a particle concentration of 6.2 × 10¹¹ particles/mL (Fig. 1B). Unlike chemical active ingredients, PDENs are nanovesicles containing bioactive components. The protein concentration in the product was calculated to be 0.8 mg/mL, significantly higher than the protein content in MO (Fig. S1 in Supporting information). High performance liquid chromatography (HPLC) analysis demonstrated that monotropein (an anti-inflammatory compound of MO) was 3.5% in MOE (per mg proteins) (Fig. S1), slightly higher than that in MO (0.71%–2.18%) [13].
Figure 1
Figure 1.
Physical and biological characterization of MOE. (A) Particle size diagram of MOE and electron microscopic view of MOE (193.2 nm, scale bar: 200 nm). (B) The particle concentration and size distribution of MOE, known as the nanoparticle tracking analysis (NTA) plot. (C) Flow cytometric quantification of MOE on the repolarization of M1-type macrophages (lipopolysaccharide (LPS) + IFN-γ) to M2-type macrophages (primed by IL-4). (D) Illustration of the MOE promoting M1Φ to M2Φ repolarization through the Wnt/β-catenin pathway. (E) RT-qPCR was used to analyze the mRNA expression level of TNF-α by MOE in M1Φ. RT-qPCR was used to analyze the mRNA expression levels of β-catenin (F), Wnt-2b (G), and Wnt-3a (H) in the Wnt/β-catenin signaling pathway (M1Φ). All data are expressed as mean ± SD (n = 3). P < 0.05, **P < 0.01 (one-way ANOVA followed by Bonferroni's post hoc test).
Cell viability of RAW264.7 (a murine macrophage cell line), human umbilical vein endothelial cell (HUVEC), and hemolytic potential (Fig. S2 in Supporting information) of MOE were evaluated. MOE caused no cytotoxicity and no hemolysis, indicating good safety. Flow cytometric assay showed that MOE efficiently converted M1-macrophages (M1Φ) to M2-macrophages (M2Φ) (Fig. 1C and Fig. S3 in Supporting information). The Wnt/β-catenin signaling pathway plays an important role in synovitis and bone destruction, driving RA progression [24]. In the inflammatory state, Wnt signaling promotes the M1Φ polarization [25], which is a key player in RA [26]. Therefore, Wnt-mediated M1Φ polarization may be a potential target for RA treatment (Fig. 1D). The reverse transcription-quantitative polymerase chain reaction (RT-qPCR) results showed that mRNA expression levels of M1-related tumor necrosis factor-α (TNF-α), β-catenin, and Wnt-related proteins (Wnt-2b and Wnt-3a) were all downregulated (Figs. 1E–H), suggesting suppression of the Wnt/β-catenin pathway and M1Φ. Notably, the anti-inflammatory effect of MOE could also be related to the suppression of Wnt/β-catenin and M1Φ polarization [27,28], highlighting MOE's potential in RA treatment.
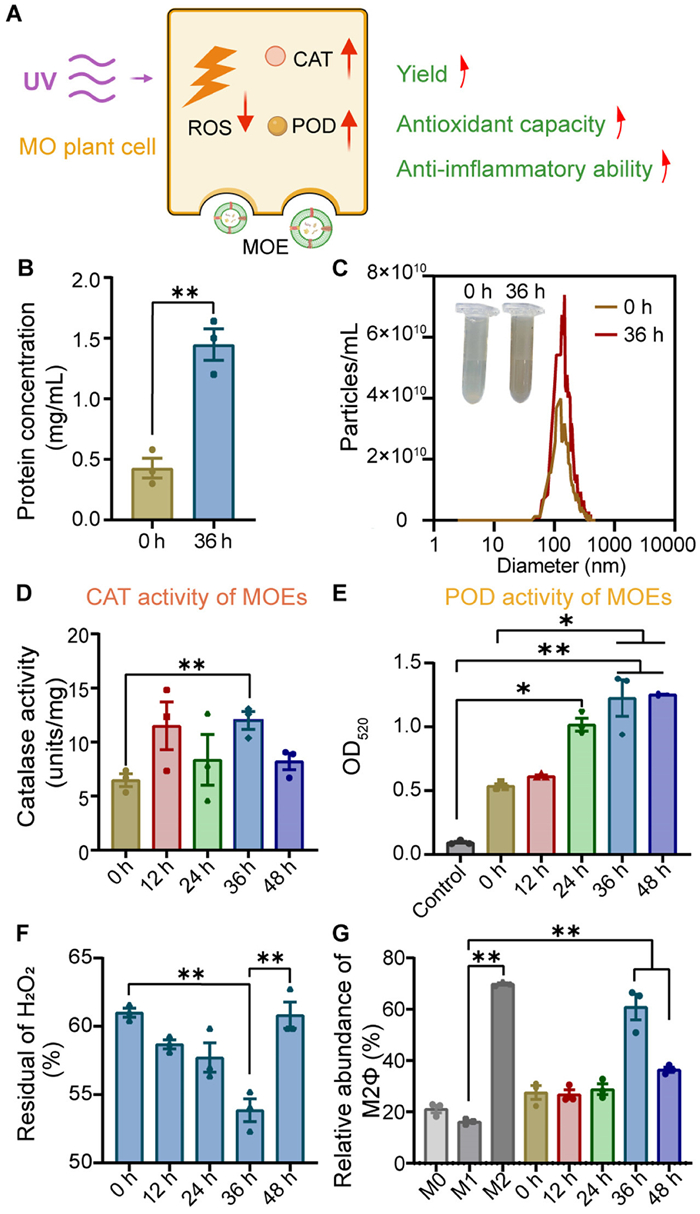
PDENs, as a novel carrier of pharmacological active ingredients, open up new avenues for modern pharmacological research. However, the yield of MOE obtained through traditional extraction methods is rather low. Previous studies have employed the methods such as heat, hypoxia, and radiation to increase PDENs' yield [19,20]. These external stimuli can trigger inherent stress responses in plants [29], which in turn, regulate biochemical pathways in plant cells to produce antagonistic components to cope with stress and repair stress-induced damage [30,31]. This stress response mechanism forms the biochemical basis for engineering strategies to increase PDENs' yield. Here, we selected UV exposure as an external stressor. UV light can effectively promote the synthesis of substances in plant cells [32]. This is helpful for the plant cells combating against the stress and the UV-induced production of damage factors (e.g., reactive oxygen species (ROS)) [33]. It was expected that the UV-induced MOE may contain active compounds benefiting repair process, potentially enhancing RA treatment efficacy (Fig. 2A).
Figure 2
Figure 2.
Effect of UV irradiation on MOE production and activity. (A) Conceptual diagram of changes of MOE after UV irradiation. (B) The total protein concentrations of MOE irradiated with UV at 0 and 36 h (C). NTA and appearance of MOE irradiated with UV at 0 and 36 h. Effects of different UV irradiation times on CAT (D) and POD (E) activities in vitro. (F) Hydrogen peroxide scavenging ability of MOE extracted under different UV irradiation times at 200 µg/mL concentrations. (G) The relative abundance of M2 macrophages by MOE at different UV irradiation time. All data are expressed as mean ± SD (n = 3). P < 0.05, **P < 0.01 (Kruskal-Wallis's post hoc test).
By exposing MO roots to UV radiation (280 nm, 28 W), the yield of MOE as represented by concentrations of total proteins and nano-sized particles, was significantly enhanced, measured to be a 2- and 3-fold increase, respectively, compared to non-UV treated group (Figs. 2B and C). Additionally, the color of the collected MOE from the UV-treated group was darker than that without UV treatment (Fig. 2C). This might be attributed to the increased MOE yield and the consequent higher concentrations of secreted compounds. It provided a new strategy with facile procedures to enhance the production yield of PDENs.
As a self-protective mechanism, plants under stress conditions can adjust their primary metabolism (photosynthesis) and secondary metabolism to counteract external harmful factors [33]. For instance, UV radiation not only enhances secondary metabolites such as phenolic acids and flavonoids (commonly pharmacodynamic agents in traditional Chinese medicine) but also increases the secretion of antioxidant enzymes (e.g., peroxidase (POD), catalase (CAT), glutathione peroxidase (GPX)) to remove ROS and protect cells from UV induced oxidative damage [34,35]. Given that PDENs are carriers of bioactive components, we investigated the impact of UV treatment on antioxidant enzyme activities (POD, CAT) in MOE. Fig. 2D shows UV irradiation increased CAT enzyme activity of MOE, peaking at the 36 h. Similarly, POD enzyme activity demonstrated a time-dependent increase with prolonged UV irradiation and reached a maximum at 36 h (Fig. 2E). The maximal efficiency of hydrogen peroxide scavenging was also observed at 36 h, while the scavenging capacity declined at 48 h (Fig. 2F and Fig. S4 in Supporting information). Further assessment of the anti-inflammatory effects of UV-treated MOE on M1Φ revealed that MOE collected after 36 h UV radiation had the strongest ability to repolarize M1Φ toward M2Φ (Fig. 2G and Fig. S5 in Supporting information). These results were consistent with the enzyme activity data, suggesting 36 h is an optimal UV-exposure time. Notably, this UV-based strategy for enhancing efficacy is also applicable to other PDENs. We validated this approach using another RA treatment herb, Millettia speciosa Champ. (MC), and found that UV-treated MC-derived exosomes-like nanovesicles (MCE) had a higher protein content (Figs. S6A and B in Supporting information), and greater anti-inflammatory activity (Figs. S6C and D in Supporting information). These results indicate that UV treatment can enhance PDENs' production, antioxidant, and anti-inflammatory activities, which holds significant potential for future PDEN research.
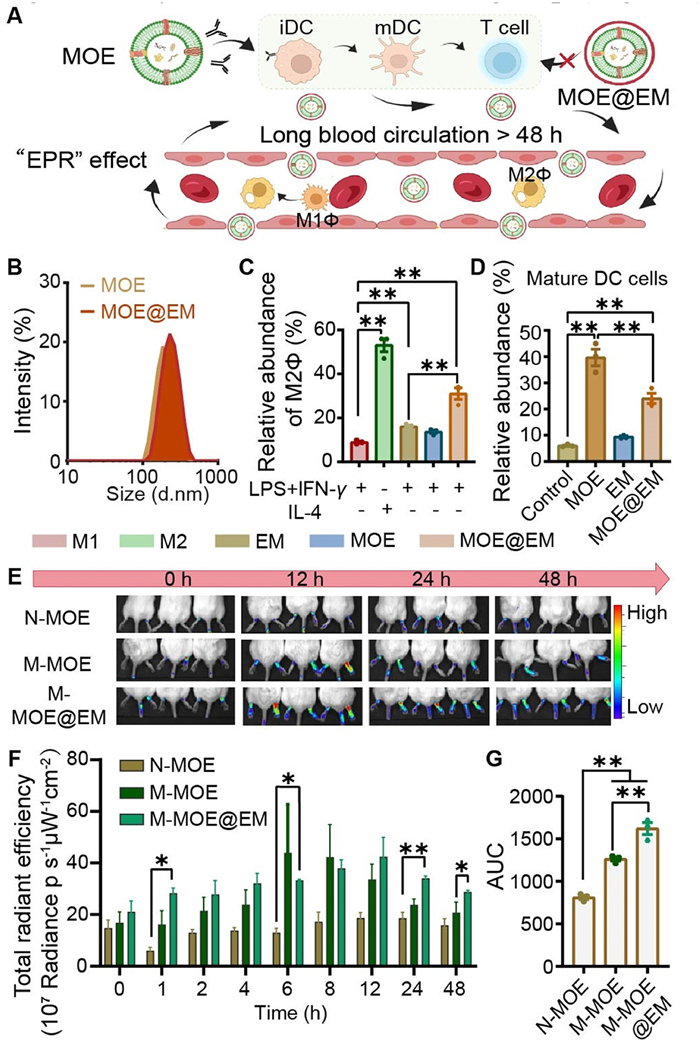
A major concern regarding the use of PDENs for parenteral administration in humans is the potential immunogenicity due to the payload plant proteins. Erythrocytes contain multiple membrane proteins including CD47, C8 binding protein (C8 bp), and homologous restriction protein (HRP), and these membrane proteins act as self-tags to prevent immune engulfment and the recognition of complement system, thereby reducing immunogenicity and extending the circulation time of EM-camouflaged nanoparticles [36]. We encapsulated MOE with EM (MOE@EM), which was prepared using a method adopted from [37], to reduce the its immunogenicity and improve the in vivo bio-fate (Fig. 3A). The particle sizes, polydispersity index (PDI), and zeta potential of MOE and MOE@EM were illustrated in Fig. 3B and Fig. S7 (Supporting information). Sodium dodecyl sulfate polyacrylamide gel electrophoresis (SDS-PAGE) results showed that MOE@EM had similar bands as EM, indicating that MOE@EM retained membrane proteins of EM (Fig. S8A in Supporting information). The transmission electron microscopy (TEM) images show that MOE@EM had a spheroid core-shell structure (Fig. S8B in Supporting information). M1Φ treated with MOE@EM exhibited repolarization toward the M2 phenotype, evidenced by an increase of M2Φ ratio (Fig. 3C) and decrease of M1Φ (Fig. S9 in Supporting information). These findings suggested that the EM coating did not compromise the anti-inflammatory effect of MOE. Dendritic cells (DCs) are the most potent antigen-presenting cells, playing a central role in activating lymphocytes. Exogenous antigens are predominantly recognized by DCs, initiating immune responses. Hence, to further demonstrate the immunogenicity-reducing potential of EM, we performed a stimulation test on DC2.4 cells. Compared with the control group, MOE increased the mature DCs population, whereas MOE@EM exhibited a significantly lower rate than MOE group (Fig. 3D).
Figure 3
Figure 3.
(A) Illustration of MOE@EM decreasing immunogenicity and increasing drug accumulation at sites of inflammation. (B) MOE (193.2 nm) and MOE@EM (226.8 nm) particle size map. (C) Flow cytometric quantification of MOE@EM on M2Φ effect. (D) Flow cytometry quantification of MOE@EM on DC2.4 cells after coating. (E) In vivo imaging of each group between 0 h and 48 h. (F) Total fluorescence intensity of normal-MOE, model-MOE, and model-MOE@EM at different times. (G) AUC quantification based on ig. 3F chart. All data are expressed as mean ± SD (n = 3). P < 0.05, **P < 0.01 (Fig. 3C: one-way ANOVA followed by Tukey's post hoc test; Figs. 3D, F, G: one-way ANOVA followed by Bonferroni's post hoc test).
In RA, recurrent inflammatory events cause enlarged gaps between synovial vascular endothelial cells, similar to the increased leakage vasculatures in tumor neovascularization. This pathological feature of RA synovial vascular endothelial cells provides an opportunity for passive targeting of nanoscale carriers via the “enhanced permeability and retention effect (EPR)” effect [38]. It was expected that MOE@EM would inherit the biological functions of EM, not only prolonging circulation time but also serving as camouflage to evade immune capture, thus potentially enhancing the passive targeting of MOE to the inflamed arthritis. We assessed the in vivo biodistribution of MOE (M-MOE) and MOE@EM (M-MOE@EM) using an adjuvant-induced arthritis (AIA) model in BALB/c mice, with a group of healthy mice receiving IR780-labeled MOE as a control (N-MOE). All animal protocols were approved by the Institutional Animal Care and Use Committee of Zhongshan Institute for Drug Discovery, SIMM, CAS. The time-dependent paw fluorograms of each group were showed in Fig. 3E. The paw fluorescence of MOE in the model group was significantly higher than that in the normal group, indicating that MOE could increase accumulation in arthritic paws by passive targeting in the AIA model mice. Compared with the MOE group, the retention time of MOE@EM in the paws was significantly prolonged (Fig. 3F). Reportedly, EM can help the coated nanoparticles prolong systemic circulation time, weaken immunogenicity, and increase joint distribution through the “EPR” effect [39]. The bioavailability of MOE and MOE@EM within 48 h was obtained by calculating the area under the curve (AUC). The accumulation of intra-articular MOE in the M-MOE@EM group was significantly increased (Fig. 3G), compared to the M-MOE group. We also found that MOE mainly distributed in the liver, suggesting its capture by the reticuloendothelial system (Fig. S10 in Supporting information). However, the M-MOE@EM group had more liver accumulation at 48 h than the M-MOE group, probably due to the longer circulation time of M-MOE@EM and the consequent enhanced accumulation in the liver.
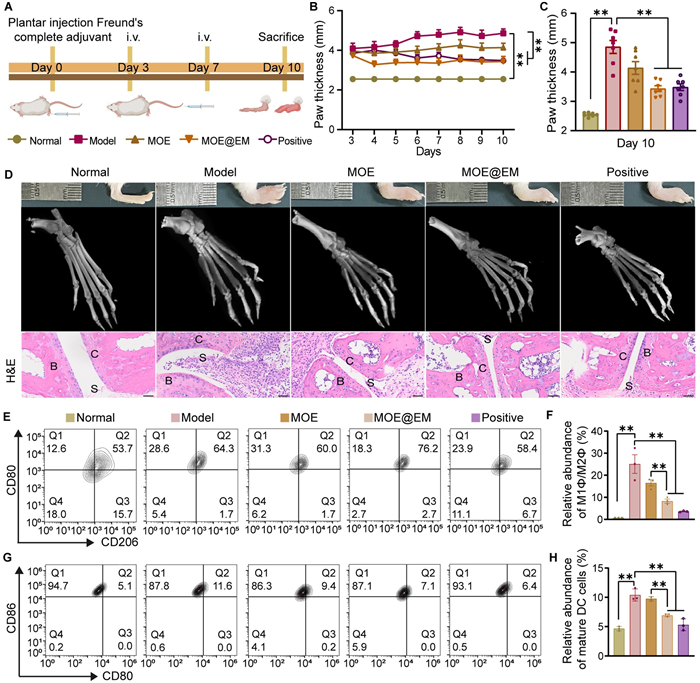
Finally, we evaluated the therapeutic effects of MOE@EM using AIA mice model (Fig. 4A). In the model, mice showed continuous weight loss, and the positive (Methotrexate) group also decreased by 15% of body weight compared with the normal group, indicating significant side effects of methotrexate (Fig. S11 in Supporting information). In the MOE@EM group, paw thickness improved significantly on day 4 and then declined, compared with the model group (Fig. 4B). On day 10, MOE@EM significantly reduced paw thickening and prevented further deterioration of RA compared to the model group (Fig. 4C). Excessive joint inflammation often leads to bone erosion. To investigate the potential of MOE@EM in alleviating bone erosion, we conducted computed tomography (CT) scans (Fig. 4D). Images revealed that the model group had bone spurs, indicative of inflammation-induced bone erosion. Bone erosion can result in an increase in bone surface area and a decrease in both bone volume and density, as well as thinner trabecular thickness [40]. Our results demonstrated a significant reduction in bone erosion in the MOE@EM group. Moreover, there was an increase in both bone mineral density (BMD) and bone volume fraction (BV/TV), while the ratio of bone surface to volume (BS/BV) decreased significantly, along with an increase in trabecular thickness (Tb.Th) in the MOE@EM group (Fig. S12 in Supporting information). The histological analysis (Fig. 4D), safranin O/fast green staining and immunohistochemical staining (TNF-α, interleukin (IL)-1β, and IL-6) (Figs. S13 and S14 in Supporting information) revealed that synovial hyperplasia was effectively suppressed while maintaining relatively intact cartilage and osteogenesis after treatment.
Figure 4
Figure 4.
MOE@EM relieved paw swelling and bone erosion. (A) Flow chart of animal experiment. (B) Paw thickness changes in different groups (n = 7). (C) Analysis of paw thickness on the last day of treatment. (D) Paw swelling, CT scans of different groups (scale bar: 1 mm), and hematoxylin-eosin (H&E) staining (scale bar: 100 µm). B represents bone, C represents cartilage, and S represents synovial tissue. (E) Flow cytometry and (F) the relative abundance analysis of M1Φ/M2Φ in synovial fluid. (G) Flow cytometry profile and (H) the relative abundance analysis of mature DCs in the spleen (n = 3). All data are expressed as mean ± SD. P < 0.05, **P < 0.01 (Figs. 4B and C: Welch followed by Dunnett T3’s post hoc test; Figs. 4F, H: One-way ANOVA followed by Tukey's post hoc test).
The pathogenesis of RA involves an autoimmune response, wherein persistent inflammation plays a pivotal role in the progression of RA. Macrophages in RA is inclined to M1 differentiation, secreting inflammatory factors and activating synovial fibroblasts [41]. MOE@EM treatment reduced the population of M1Φ and increased M2Φ population (Figs. 4E and F). In addition, compared with other groups, the MOE@EM treatment group significantly reduced the amounts of Th1 (interferon-γ (IFN-γ) positive) and Th17 cells (IL-17A positive), and the abundance of RA related myeloid-derived suppressor cells (MDSCs), synovial fibroblasts and endothelial cells (Figs. S15–S17 in Supporting information). Notably, compared with the MOE group, MOE@EM exhibited a more pronounced efficacy in RA treatment. Moreover, MOE@EM treatment reduced the population of mature DCs (Figs. 4G and H), aligning consistently with our cellular experiments. This suggests that MOE@EM can significantly reduce the number of DCs in vivo, thereby reducing T-cell antigen presentation, inflammatory effects, and the immunogenicity of MOE. In vivo toxicity studies revealed no significant changes in the organ coefficients following MOE@EM administration (Figs. S18A–D in Supporting information). Notably, the spleen coefficient of the MOE@EM group was lower than that of the MOE group (Fig. S18E in Supporting information). Serum measurements of hepatic and renal markers showed no significant differences among the experimental groups (Fig. S19 in Supporting information). No evident pathological damage was observed in the MOE@EM group (Fig. S20 in Supporting information). Collectively, these results indicated the safety of MOE@EM.
In conclusion, we demonstrated that UV pretreatment increased both the anti-inflammatory activity and production yield of MOE. Basing on this finding, we proposed a novel strategy to mitigate the immunogenicity of MOE by biomimetically disguising them with EM. The biomimetic camouflage of EM not only increased drug accumulation in the joints but also diminished immunogenicity. The MOE@EM formulation prevented the maturation of DCs and substantially reduced M1Φ differentiation, thereby modulating the immune microenvironment. This led to decreased bone erosion and paw swelling. Our strategy effectively treated RA and could be valuable in advancing the therapeutic application of MOE and PDENs.
Declaration of competing interest
The authors declare that they have no known competing financial interests or personal relationships that could have appeared to influence the work reported in this paper.
This work was supported by the National Key Research and Development Program of China (Nos. 2021YFC2400600, 2022YFE0203600), National Natural Science Foundation of China (Nos. 81925035, 82304842, 82204628), High-level Innovative Research Institute (No. 2021B0909050003), Chinese Academy of Sciences President's International Fellowship Initiative (No. 2024VBB0004), the Scientific and Technological Innovation Projects in Zhongshan City (Nos. LJ2021001, CXTD2022011), the Social Welfare and Basic Research Projects in Zhongshan (No. 221014134359625), the Special Projects in Key Areas of Colleges and Universities in Guangdong Province (No. 2022ZDZX2015), the Science and Technology Program of Guangzhou (No. 2024A04J4899), and Young Talent Project of Guangzhou University of Chinese Medicine (No. A1–2601–24–414–110Z76).
Supplementary materials
Supplementary material associated with this article can be found, in the online version, at doi:10.1016/j.cclet.2024.110658.
C. María del Socorro Sánchez, S. María el Rocío Reyero, P. Edgar Antonio Estrella, et al., Ultraviolet radiation and its effects on plants, in: O. Manuel, F.S. Anabela (Eds.), Abiotic Stress in Plants, IntechOpen, Rijeka, 2023, pp. 18–38.
N. Saeki, Y. Imai, Histol. Histopathol. 38 (2023) 1231–1238.
Figure 1
Physical and biological characterization of MOE. (A) Particle size diagram of MOE and electron microscopic view of MOE (193.2 nm, scale bar: 200 nm). (B) The particle concentration and size distribution of MOE, known as the nanoparticle tracking analysis (NTA) plot. (C) Flow cytometric quantification of MOE on the repolarization of M1-type macrophages (lipopolysaccharide (LPS) + IFN-γ) to M2-type macrophages (primed by IL-4). (D) Illustration of the MOE promoting M1Φ to M2Φ repolarization through the Wnt/β-catenin pathway. (E) RT-qPCR was used to analyze the mRNA expression level of TNF-α by MOE in M1Φ. RT-qPCR was used to analyze the mRNA expression levels of β-catenin (F), Wnt-2b (G), and Wnt-3a (H) in the Wnt/β-catenin signaling pathway (M1Φ). All data are expressed as mean ± SD (n = 3). P < 0.05, **P < 0.01 (one-way ANOVA followed by Bonferroni's post hoc test).
Figure 2
Effect of UV irradiation on MOE production and activity. (A) Conceptual diagram of changes of MOE after UV irradiation. (B) The total protein concentrations of MOE irradiated with UV at 0 and 36 h (C). NTA and appearance of MOE irradiated with UV at 0 and 36 h. Effects of different UV irradiation times on CAT (D) and POD (E) activities in vitro. (F) Hydrogen peroxide scavenging ability of MOE extracted under different UV irradiation times at 200 µg/mL concentrations. (G) The relative abundance of M2 macrophages by MOE at different UV irradiation time. All data are expressed as mean ± SD (n = 3). P < 0.05, **P < 0.01 (Kruskal-Wallis's post hoc test).
Figure 3
(A) Illustration of MOE@EM decreasing immunogenicity and increasing drug accumulation at sites of inflammation. (B) MOE (193.2 nm) and MOE@EM (226.8 nm) particle size map. (C) Flow cytometric quantification of MOE@EM on M2Φ effect. (D) Flow cytometry quantification of MOE@EM on DC2.4 cells after coating. (E) In vivo imaging of each group between 0 h and 48 h. (F) Total fluorescence intensity of normal-MOE, model-MOE, and model-MOE@EM at different times. (G) AUC quantification based on ig. 3F chart. All data are expressed as mean ± SD (n = 3). P < 0.05, **P < 0.01 (Fig. 3C: one-way ANOVA followed by Tukey's post hoc test; Figs. 3D, F, G: one-way ANOVA followed by Bonferroni's post hoc test).
Figure 4
MOE@EM relieved paw swelling and bone erosion. (A) Flow chart of animal experiment. (B) Paw thickness changes in different groups (n = 7). (C) Analysis of paw thickness on the last day of treatment. (D) Paw swelling, CT scans of different groups (scale bar: 1 mm), and hematoxylin-eosin (H&E) staining (scale bar: 100 µm). B represents bone, C represents cartilage, and S represents synovial tissue. (E) Flow cytometry and (F) the relative abundance analysis of M1Φ/M2Φ in synovial fluid. (G) Flow cytometry profile and (H) the relative abundance analysis of mature DCs in the spleen (n = 3). All data are expressed as mean ± SD. P < 0.05, **P < 0.01 (Figs. 4B and C: Welch followed by Dunnett T3’s post hoc test; Figs. 4F, H: One-way ANOVA followed by Tukey's post hoc test).

 DownLoad:

 下载:
下载:


 下载:
下载:
