gxcuiping@sina.com (C. Li). 1 These authors contributed equally to this work.
Received Date:
05 July 2024 Accepted Date:
21 October 2024 Revised Date:
17 October 2024 Available Online:
15 July 2025
Abstract:
Infectious wound healing is complicated with and limited by infection and oxidative stress at the wound site. In recent years, various evidences suggest that nanozymes with multiple enzymatic activities have enabled the development of novel strategies for infectious wound healing. In this study, epigallocatechin gallate loaded polydopamine (P@E) was developed to act as a potent reactive oxygen species (ROS) scavenger for scavenging ROS, alleviating inflammatory responses, and promoting infectious wound healing. Combining with near infrared (NIR) irradiation, P@E presented excellent antibacterial ability of Escherichia coli (E. coli, 93.6%) and methicillin-resistant Staphylococcus aureus (MRSA, 87.6%). Specifically, P@E+NIR exhibited the most potent antioxidant, anti-inflammatory and cell proliferation behaviors through down-regulating intracellular ROS levels (81.9% and 94.3% for NIH3T3 and RAW264.7 respectively) and inducible nitric oxide synthase (iNOS) expression level (55.7%), and up-regulating the expression levels of arginase-1 (Arg-1, 71.4%), heat shock protein 70 (HSP70, 48.6%) and platelet endothelial cell adhesion molecule (CD31, 35.3%) compared to control group. Meanwhile, it also efficiently induced M2 directional polarization of lipopolysaccharide induced murine macrophages to achieve anti-inflammation, indicated by the down-regulation of CD86 (86.2%), and up-regulation of CD206 (85.6%). Significantly, it was also observed that P@E+NIR presented the excellent behaviors of inhibiting wound infection, alleviating wound inflammation, as well as promoting skin tissue repairing. Altogether, it has developed the strategy of using P@E combining with NIR irradiation for the synergistic enhanced healing of infectious skin wound, which can serve as a promising therapeutic strategy for its clinical treatment.
Infectious diseases pose a serious threat to human health. The death caused by bacteria, viruses, and other microorganisms derived diseases has increased year by year, predicted to rise to surpass the number of cancer deaths [1,2]. Bacteria such as Escherichia coli (E. coli) or methicillin-resistant Staphylococcus aureus (MRSA) is a major cause of various infectious diseases including skin infections, sepsis, and pericarditis, and has acquired resistance to commonly used antibiotics [3,4]. Owing to ineffective use of antibiotics, there is an urgent need to develop novel strategies that can treat infectious skin wound. Generally, the unique wound environments help to accelerate bacterial reproduction, and inhibit normal cell proliferation, thereby delaying skin tissue regeneration [5,6]. On the other hand, bacterial infections can lead to the excessive generation of reactive oxygen species (ROS) in wound site, not conducive to skin wound healing. The excessive ROS can activate the inflammatory response, causing the pulmonary infiltration of immune cells like macrophages, and excessive secretion of inflammatory cytokines including tumor necrosis factor-α (TNF-α), inducible nitric oxide synthase (iNOS), and interleukin-6 (IL-6) [7,8]. Due to the existence of inflammation, it could aggravate cell death and tissue necrosis of wound site, and weaken the skin healing process. As a consequence of multi-drug resistance, the wound therapies of bacterial infectious diseases become difficult [9,10]. Thus, the strategy for the control of bacterial infection combining with antioxidant and anti-inflammation is essential for effective therapy of bacterial infectious skin wound.
In the past few decades, the combination of antibacterial activity and nanotechnology has been recognized as an effective strategy for antibacterial therapy [11]. Nanozymes are a series of nanoparticles (NPs) with multiple enzyme catalytic activities, and act as promising nanobiomedicine alternatives applied in biomedical fields owing to good biocompatibility and enzymatic activity [12,13]. In particular, polydopamine (PDA) and its derivatives have attracted a huge amount of interests as nanobiomedicine for diseases therapy attributed by their low cytotoxicity, good biodegradability as well as high tissue adhesion [14]. Due to their large amount of catechol and imine groups, PDA based NPs possess good ROS scavenging and inflammation elimination ability, such as converting •OH to H2O and •O2− to O2, further applied in treating ROS derived diseases [15,16]. However, the catalytic activities and dispersion of simple PDA are quite poor, which limits their practical applications. To strengthen their catalytic activities and improve their dispersion, PDA NPs are always designed to generate rich defects by hybridizing them with different metal or metal oxide including Pt [17], Ru [18], Fe [19], Cu [20], Mn [21], etc. Significantly, the metal element doped PDA can also be assisted by external stimuli like photothermal effect [22], ultrasonic driven [23], or ultraviolet (UV) stimuli [24] to boost their general properties, thereby reaching the optimal therapeutic effects of diseases with low dosage. In addition, PDA can also form combined nanosystems by conjugating them with targeted ligands [25], polymer materials and therapeutic drugs [26] for synergistic therapy of various diseases. On the other hand, epigallocatechin gallate (EGCG) is the most effective active ingredient in tea polyphenols [27]. It has confirmed that EGCG has various abilities of antibacterial, antiviral, antioxidant, and anti-inflammation, thus widely applied in biomedical fields. Previous studies have found that EGCG could promote the differentiation of human epidermal keratinocytes, and accelerate the healing of wounds [28,29]. Nevertheless, EGCG is easily cleared in the blood circulation system and causes additional side effects in clinics due to its poor dispersion, and easy oxidation and agglomeration [30,31]. To solve these problems, EGCG is considered to form stable nanosized framework by coordination with multivalent metal element like Cu, Ce, Fe [32] to make full use of its unique properties for diseases therapy. And EGCG is also loaded into nanosized carriers to develop its ROS elimination and anti-inflammatory properties, and achieve its controlled release under different stimuli like pH change [33] and near infrared (NIR) driven [34], ultimately improving disease therapy efficacy [35]. As far as we know, it is rare to find researches about the combination of PDA and EGCG for infectious skin wound healing. Their combination is expected to exert its synergistic enhanced therapeutic effect, thereby efficiently and safely promoting skin wound repair.
In this study, we first prepared PDA NPs by simple redox polymerization of dopamine (DA) in alkaline condition. Subsequently, the novel designed nanozyme, denoted as P@E was fabricated through encapsulating PDA with EGCG to regulate redox homeostasis and accelerate tissue regeneration for infectious skin wound repair. Integration of PDA with EGCG enhanced its multiple ROS scavenging abilities, and endowed it with stable photothermal effects. After combining with NIR irradiation, it also displayed that P@E possessed the efficient inhibition activities of E. coli and MRSA growth via directly acting on bacterial cell membranes and cell walls, thereby disrupting the structure and function of bacteria by EGCG and photothermal therapy (PTT). Furthermore, as revealed by H2O2 induced RAW264.7 and NIH3T3, lipopolysaccharide (LPS) induced RAW264.7 and infected skin wound animal models, P@E+NIR could effectively activate antioxidant and anti-inflammation pathway, induce M2 directional polarization, stimulate high expression of heat shock protein 70 (HSP70) and platelet endothelial cell adhesion molecule (CD31), and inhibit bacterial proliferation with favorable biosafety, significantly contributing to accelerate the repair of infectious skin wound. In summary, it could act as an efficient strategy for the therapy of infectious diseases.
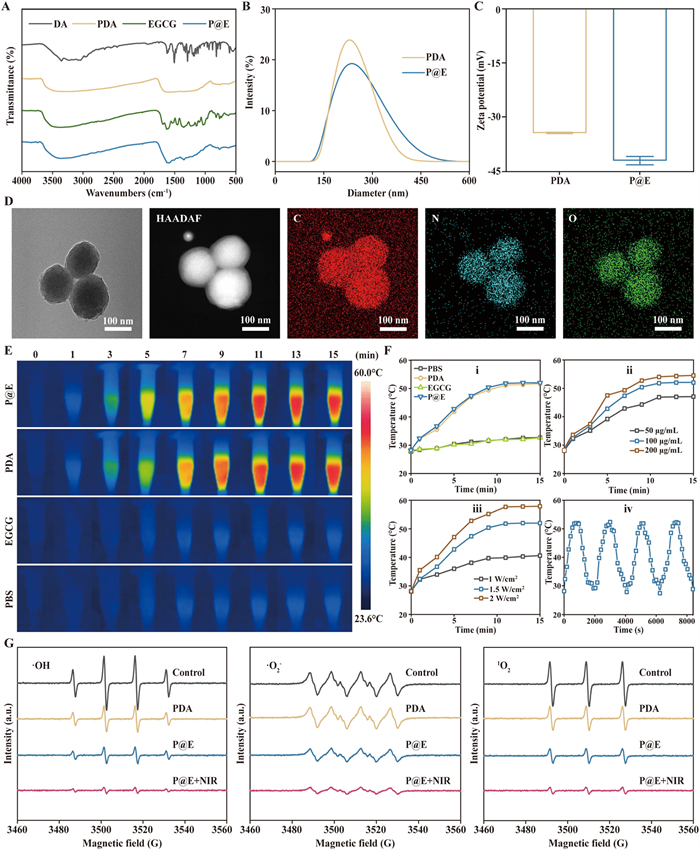
Nanosized PDA was prepared by simple redox polymerization under weak alkaline condition. Next, EGCG was loading on the surface of PDA by hydrogen bonding between their polyphenol groups, and π-π conjugation between benzene ring groups to form P@E [36]. The possible chemical structure of P@E was schematically shown in Fig. S1 (Supporting information). As illustrated in Fig. S2 (Supporting information), the obvious peak was observed at 280 nm corresponding to the conjugated double bond (=) of benzene ring in DA. After forming PDA, the corresponding peak disappeared, confirming the successful preparation of PDA without the existence of DA. PDA was only dispersed rather than soluble in the solution, not possible to contribute to UV absorbance. And it was also observed that EGCG had an apparent peak at 274 nm while it was not observed for P@E, providing a proof of the successful preparation of P@E without free EGCG. The slight peak existed at 274 nm due to the release of EGCG in the solution. Meanwhile, the chemical structure of NPs was characterized by Fourier transform infrared spectroscopy (FTIR). The obvious peaks were observed around 3700–3300 cm−1 and 1800–1000 cm−1, attributed by the –OH and C–O groups of PDA and DA. However, no apparent changes were emerged between PDA and P@E. EGCG did not significantly change the molecular structure of P@E (Fig. 1A). By the analysis of zeta sizer, the average diameter of PDA and P@E was 275.5 ± 4.7 and 281.9 ± 5.5 nm, respectively (Fig. 1B and Table S1 in Supporting information). Similarly, the zeta potential was −34.4 ± 0.2 and −42.1 ± 1.2 mV for PDA and P@E respectively (Fig. 1C and Table S1). Compared to PDA, EGCG loading did not significantly change the diameter and zeta potential of P@E.
Figure 1
Figure 1.
Physicochemical characterization of NPs. (A) FTIR results of DA, PDA, EGCG and P@E. (B) Diameter of PDA and P@E by zeta sizer. (C) Zeta potential of PDA and P@E by zeta sizer. (D) TEM-mapping results of P@E and the corresponding element composition (HAADF, C, N and O images). Scale bar: 100 nm. (E) Photothermal images of different NPs (PBS, PDA, EGCG and P@E) with 100 µg/mL under NIR irradiation (1.5 W/cm2) versus time. (F) Temperature changes of different NPs (PBS, PDA, EGCG and P@E) with 100 µg/mL under NIR irradiation (1.5 W/cm2) (ⅰ), different concentrations (50, 100 and 200 µg/mL) of P@E under NIR irradiation (1.5 W/cm2) (ⅱ), 100 µg/mL P@E under different power intensity of NIR irradiation (1, 1.5 and 2 W/cm2) (ⅲ) versus time, and photothermal stability of 100 µg/mL P@E under NIR irradiation (1.5 W/cm2) for 4 “on” and “off” cycles (ⅳ). (G) ESR results of 100 µg/mL different NPs (control group, PDA, P@E and P@E+NIR): •OH, •O2− and 1O2. Data are presented as mean ± standard deviation (SD) (n = 3).
Next, as revealed in Figs. S3 and S4 (Supporting information), the morphology of PDA was in spherical shape with the average diameter of 134.8 ± 9.4 nm, and only C, N and O elements observed by transmission electron microscope (TEM). After EGCG loading, it was 151.3 ± 6.7 nm for P@E (Fig. S5 in Supporting information), also in spherical shape and with C, N and O elements (Fig. 1D). The slight differences in average diameter for NPs were due to the fact that their instability limited the resolution of instruments. And the element composition of NPs was further investigated by X-ray photoelectron spectroscopy (XPS). As shown in Fig. S6 (Supporting information), only C, N and O elements existed for both PDA and P@E. However, the contents of C significantly increased (5.2%) and the contents of N element decreased (6.9%) for P@E compared to PDA (Table S2 in Supporting information) while the O element only increased 1.7%. EGCG loading did not change the element composition of P@E, but changed the contents of C, N and O, especially for N elements. Significantly, the solid 1H nuclear magnetic resonance spectroscopy (NMR) was applied to characterize PDA, EGCG and P@E. As displayed in Fig. S7 (Supporting information), obvious chemical shift happened at 5.3 ppm, corresponding to H of benzene ring for PDA, where no chemical shifts were apparently observed including H from phenol group. These were due to the formation of NPs with the destruction of conjugated double bonds (benzene ring), leading to some chemical shifts not possibly shown [37]. However, obvious chemical shifts were observed at 9.2 and 7.3, 5.3, 3.9 and 1.4 ppm, corresponding to H of benzene ring, double bond, ether bond and methyl group respectively for EGCG [38]. Compared to PDA, a broad chemical shift existed for P@E with the range from 0 to 10 ppm. And slight chemical shifts happened at 7.0 and 5.3 ppm, corresponding to H of benzene ring and double bond for P@E. Meanwhile, the crystallization structure of NPs was illustrated in Fig. S8 (Supporting information). Although a lot of disorder peaks were observed for EGCG, there were still no significant differences in crystallization structure existed for PDA and P@E, both with only an apparent peak at 26.3° by X-ray diffraction (XRD), consistent with the previously reported results [39]. And the thermal stability was also tested by thermal gravimetric analysis (TGA). As displayed in Fig. S9 (Supporting information), the weight loss ratio was 62.2% for EGCG. However, the weight loss ratio was 47.7% and 47.2% for PDA and P@E respectively. The difference in weight loss ratio between PDA and P@E was attributed by EGCG loading. After calculation, EGCG loading ratio was 0.5% for P@E.
Besides, the photothermal effects of NPs were investigated by monitoring the temperature changes under NIR irradiation. NIR irradiation was a non-invasive therapeutic method, and applied in the therapy of various diseases [40]. As imaged in Fig. 1E, the temperatures of PDA and P@E increased with the time of NIR irradiation while no significant changes in temperatures were observed for phosphate buffered saline (PBS) and EGCG. After statistical analysis, for the concentration of 100 µg/mL under NIR irradiation of 1.5 W/cm2, the temperatures jumped to 51.7 and 52.0℃ for PDA and P@E while it maintained at 32.6 and 32.7℃ for PBS and EGCG respectively after 15 min’ irradiation (Fig. 1F-ⅰ). Similarly, the effects of NPs concentrations on photothermal conversion were also investigated. As revealed in Fig. 1F-ⅱ and Fig. S10 (Supporting information), increasing the concentration of P@E from 50 µg/mL to 200 µg/mL, the temperature changed from 47.1℃ to 54.5℃ respectively after 15 min’ irradiation. Besides, increasing the intensity of NIR irradiation was also equal to high temperature, which was 40.6, 52.0 and 57.9℃ for 100 µg/mL P@E with the intensity of NIR irradiation at 1, 1.5 and 2 W/cm2 respectively (Fig. 1F-ⅲ and Fig. S11 in Supporting information). Significantly, after 4 “on” and “off” cycles, the photothermal effects maintained the same tendency for 100 µg/mL P@E with NIR intensity of 1.5 W/cm2, indicating the stable photothermal conversion (Fig. 1F-ⅳ).
Furthermore, the dispersion of PDA and P@E was shown in Fig. S12 (Supporting information). It was observed that PDA could maintain homogeneously dispersed in PBS, fetal bovine serum (FBS), Dulbecco’s modified eagle medium (DMEM), or 5 mmol/L H2O2 till 4 h. After 8 h, PDA was totally deposited on the bottom for all solutions except for FBS with a certain of stability. Compared to PDA, it was homogeneously dispersed in FBS, and a little was deposited on the bottom in PBS and H2O2 till 12 h for P@E. However, it retained homogeneously dispersed in DMEM for P@E at 4 h, better than that of PDA with a certain of deposition. Therefore, P@E presented better dispersion and stability than that of PDA, helpful to improve the therapeutic effect. And the EGCG release ratio was also investigated. As shown in Fig. S13 (Supporting information), there was no EGCG release for PDA while obvious EGCG release happened for P@E under different conditions. Most importantly, compared to slow EGCG release of P@E in PBS (pH 7.6), obvious increased EGCG release ratios were observed for P@E in PBS (pH 5.2) or P@E+NIR in PBS (pH 7.6). Among them, NIR irradiation most efficiently accelerated the EGCG release of P@E, attributed by its ability of most effectively destroying the hydrogen bonding between PDA and EGCG.
Finally, ROS scavenging capacity was initially tested by electron spin resonance (ESR). As revealed in Fig. 1G, compared to control group with high intensity of magnetic field, it became weaken after the dosage of NPs, corresponding to the scavenging capacity of •OH, •O2− and 1O2. From Fig. 1G, PDA could slightly decrease the intensity of ESR while P@E and P@E+NIR obviously decreased the corresponding intensities. In addition, ROS scavenging capacity was also quantified evaluated by ROS testing kits. As illustrated in Fig. S14-i and Table S3 (Supporting information), with the same concentration of 100 µg/mL, H2O2 scavenging ratio was 48.0% ± 2.6% for PDA, increased to 62.7% ± 2.4% for P@E and 77.4% ± 1.5% for P@E+NIR respectively. In addition, for P@E, if increasing its concentration from 50, 100 µg/mL to 200 µg/mL, the corresponding H2O2 scavenging ratio was from 58.1% ± 1.1%, 62.8% ± 2.4% to 74.4% ± 1.9%, indicating that H2O2 scavenging capacity was concentration dependent (Table S4 in Supporting information). Significantly, it also displayed the similar trend for •OH and •O2− scavenging capacities, where the order of scavenging capacity was P@E+NIR > P@E > PDA, and both were concentration dependent. It was 30.6% ± 0.6% •OH scavenging ratio and 54.7% ± 1.6% •O2− scavenging ratio for PDA, increased to 48.1% ± 1.9% and 72.9% ± 0.4% for P@E, and 85.3% ± 0.9% and 88.0% ± 0.9% for P@E+NIR respectively with the dosage concentration of 100 µg/mL (Fig. S14-ii and iii; Table S3). For P@E, increasing its concentration from 50, 100 and 200 µg/mL, the corresponding •OH scavenging ratio was 33.4% ± 1.7%, 47.2% ± 1.5%, 58.1% ± 0.9% and the corresponding •O2− scavenging ratio was 65.8% ± 0.7%, 71.3% ± 0.1% and 82.2% ± 1.2% (Table S4 in Supporting information). It had confirmed that PDA possessed a certain of various ROS scavenging capacities due to its huge amount of polyphenol groups. And EGCG also had ROS scavenging abilities due to its polyphenol groups. Thus, their combination contributed to the enhanced ROS scavenging capacities of P@E, consistent with results as previously reported [41]. Significantly, NIR irradiation could speed up the movement of PDA and EGCG, helpful to the improvement of ROS scavenging capacity [42].
During skin wound healing, the corresponding microenvironment plays a significant role. It requires the synergistic activation, proliferation, differentiation, and migration of many different cell types such as macrophages and fibroblasts in skin tissue [43]. For example, macrophages either become M2 types that are anti-inflammatory and promote tissue repair, or M1 types that promote inflammation and inhibit tissue repair, seriously affecting the process of skin wound repair [44]. Thus, the studies in cellular levels mainly focused on RAW264.7 and NIH3T3. Cell viability was implemented by cell counting kit-8 (CCK-8) assay. As shown in Fig. S15 (Supporting information), for RAW264.7 (i), the cell viability decreased with the increase of NPs concentration, displaying the concentration dependent. With the concentration of 100 µg/mL, the cell viability was 91.6% ± 1.4%, 75.3% ± 4.5%, 89.3% ± 1.1% and 84.6% ± 1.8% for PDA, EGCG, P@E and P@E+NIR respectively. Increasing the concentration of NPs, the cell viability was declined for all groups, especially for EGCG and P@E+NIR. In the meantime, for NIH3T3 (ii), PDA, P@E and P@E+NIR possessed favorable biocompatibility in the concentrations ranging from 0 to 100 µg/mL, with cell viability above 81% (98.7% ± 2.7% for PDA, 87.8% ± 1.5% for P@E and 81.0% ± 0.5% for P@E+NIR). And the cell viability was only 73.9% ± 1.0% for EGCG with the concentration of 100 µg/mL respectively. Specifically, for EGCG, the cell viability significantly went down with the increase of its concentration [45]. Thus, NPs with the concentration of 100 µg/mL was chosen for further experiments.
Next, the cell proliferation ability of NIH3T3 was evaluated by cell scratching and Transwell testing. As revealed in Fig. S16 (Supporting information), compared to control group, the obvious cell migration was observed for all NPs with the concentration of 100 µg/mL (Fig. S16A). The order of proliferation ability was P@E > PDA > EGCG > normal group. After statistical analysis, the migration ratio was 65.1% ± 5.3%, 17.3% ± 2.5%, 17.3% ± 0.6% and 15.7% ± 1.2% for normal group, PDA, EGCG and P@E respectively (Fig. S16B). In addition, from the results of Transwell experiment, compared to control group with a little intensity of crystal violet, it slightly increased the corresponding intensity for PDA and EGCG. Significantly, as shown in Fig. S17 (Supporting information), obvious high intensity of crystal violet was observed for P@E, corresponding to strong cell proliferation ability (Fig. S17A). By calculation, the number of proliferated cells was 190.0 ± 18.2 for normal group while it ascended to 215.0 ± 5.2, 193.3 ± 19.1 and 371.3 ± 12.9 for PDA, EGCG and P@E respectively (Fig. S17B). Due to the relatively poor biocompatibility and proliferation ability, EGCG was not considered for the following experiments.
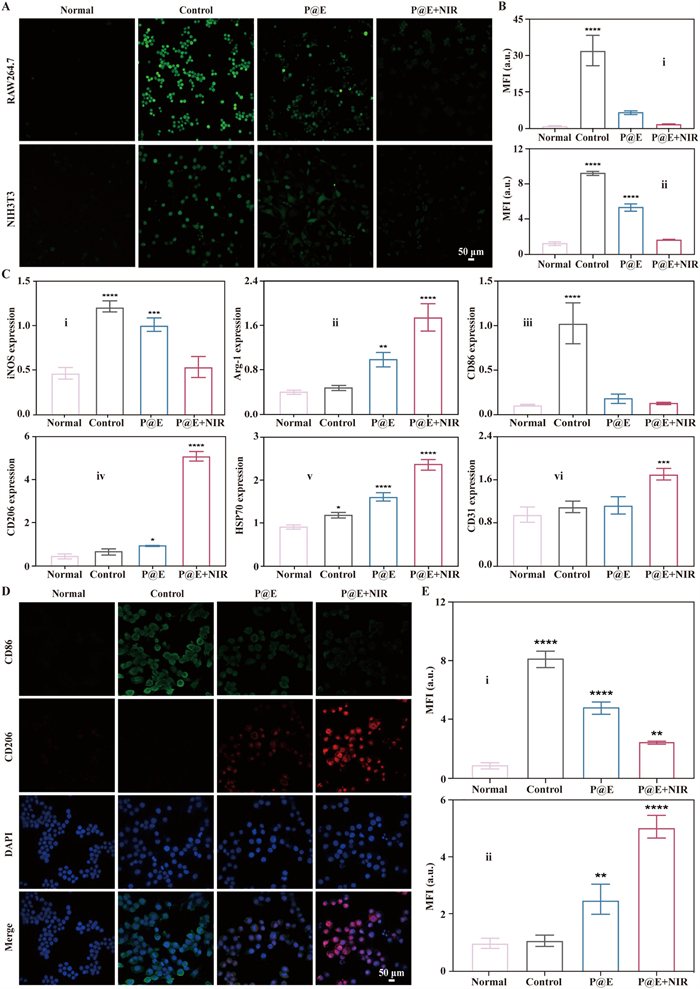
Significantly, the antioxidant and anti-inflammatory capacities of NPs were also investigated. The inflammatory cell models were built by treating RAW264.7 and NIH3T3 with H2O2 or LPS for a certain of time. After induction, oxidative stress created in cells. The intracellular ROS levels were initially considered to evaluate the antioxidant ability. As imaged in Fig. 2A, after H2O2 induction, the intracellular ROS levels were significantly enhanced for RAW264.7 and NIH3T3 compared with un-treated cells (normal group). P@E could efficiently decrease the intracellular ROS levels, which was significantly enhanced by P@E+NIR. After statistical calculation [46], the mean fluorescent intensity (MFI) was 1.1 ± 0.2 for normal RAW264.7, increased to 32.1 ± 6.3 for H2O2 treated RAW264.7 (control group). And the MFI was 6.8 ± 0.8 for P@E while it significantly decreased to 1.8 ± 0.3 for P@E+NIR (Fig. 2B-ⅰ). Similarly, it displayed the same tendency for those of NIH3T3, which was simultaneously 1.1 ± 0.2, 7.1 ± 0.2, 4.1 ± 0.3 and 1.3 ± 0.1 for normal group, control group, P@E and P@E+NIR respectively (Fig. 2B-ⅱ).
Figure 2
Figure 2.
Antioxidant and anti-inflammatory capacities in cellular level. (A) Intracellular ROS levels of H2O2 treated cells by fluorescent microscope and (B) the corresponding quantified results (RAW264.7 (ⅰ) and NIH3T3 (ⅱ)). (C) Genes expression levels of treated cells by qRT-PCR: iNOS (ⅰ), Arg-1 (ⅱ), CD86 (ⅲ) and CD206 (ⅳ) for RAW264.7, and HSP70 (ⅴ) and CD31 (ⅵ) for NIH3T3. (D) CD86 and CD206 expression levels of treated cells by immunofluorescent microscopy and (E) the corresponding quantified results (CD86 (ⅰ) and CD206 (ⅱ)). The corresponding groups were: cells without treatment (normal group), pre-treated cells (RAW264.7 pre-treated with LPS, and NIH3T3 pre-treated with H2O2) followed by incubating with PBS buffer (control group), 100 µg/mL P@E (P@E), and 100 µg/mL P@E and NIR irradiation (1.5 W/cm2, 10 min) (P@E+NIR). Scale bar: 50 µm. *P < 0.05, **P < 0.01, ***P < 0.001, ****P < 0.0001 vs. normal group. Data are presented as mean ± SD (n = 3).
Besides, the relative genes expression levels of treated cells were also evaluated by quantitative real-time polymerase chain reaction (qRT-PCR) to reflect the antioxidant, anti-inflammation and tissue repair abilities. As shown in Fig. 2C, for RAW264.7, after LPS stimulation, the iNOS and CD86 genes levels significantly increased compared with normal group. However, almost no obvious changes happened for arginase-1 (Arg-1) and CD206 genes levels after stimulation. Significantly, P@E and P@E+NIR efficiently down-regulated the levels of iNOS and CD86 genes, and up-regulated Arg-1 and CD206 genes levels, where the effect of P@E+NIR was most obvious. Besides, for NIH3T3, compared to normal group, H2O2 stimulation did not significantly change the levels of HSP70 and CD31 genes. P@E+NIR most effectively promoted the genes levels of HSP70 and CD31. And the genes levels of iNOS, CD86, Arg-1 and CD206 was 0.5 ± 0.1, 0.1 ± 0.1, 0.4 ± 0.2 and 0.5 ± 0.1 for normal group, changed to 1.2 ± 0.1, 1.0 ± 0.2, 0.5 ± 0.2 and 0.7 ± 0.2 for control group. Compared to control group, P@E+NIR most significantly decreased iNOS and CD86 genes levels to 0.5 ± 0.1, 0.1 ± 0.1, and increased Arg-1 and CD206 genes levels to 1.8 ± 0.1 and 5.1 ± 0.2. Similarly, P@E+NIR also most effectively ascended the genes levels of HSP70 and CD31 to 2.4 ± 0.1 and 1.7 ± 0.1, compared to other groups: normal group (0.9 ± 0.1 and 0.9 ± 0.2), control group (1.2 ± 0.1 and 1.1 ± 0.1) and P@E (1.6 ± 0.2 and 1.2 ± 0.2).
Meanwhile, immunofluorescent staining was applied to qualified investigate the relative expression levels of proteins. As displayed in Figs. 2D and E, and Fig. S18 (Supporting information), LPS stimulation induced the high expression levels of iNOS and CD86 with the MFI of 34.8 ± 3.7 and 8.2 ± 0.6 and low expression levels of Arg-1 and CD206 with the MFI of 10.7 ± 5.8 and 1.1 ± 0.2 for RAW264.7 respectively. P@E and P@E+NIR obviously decreased the expression levels of iNOS with the MFI of 4.7 ± 1.6 and 1.2 ± 0.1, and CD86 with the MFI of 4.9 ± 0.4 and 2.6 ± 0.1. Similarly, they also increased the expression levels of Arg-1 (15.1 ± 4.2 and 32.4 ± 4.7) and CD206 (2.5 ± 0.5 and 5.1 ± 0.4). Most significantly, for NIH3T3, compared to normal group, P@E+NIR apparently promoted the expression levels of HSP70 and CD31 with the MFI of 49.9 ± 6.2 and 30.1 ± 3.4 respectively. And other groups did not affect the expression levels of HSP70. However, for CD31, P@E also increased its expression levels to 10.7 ± 2.5 (Fig. S19 in Supporting information).
Furthermore, Western blot (WB) was also applied to characterize the protein expression levels of treated cells. As shown in Fig. S20 (Supporting information), CD206 was in lowest expression level with the value of 0.9 ± 0.2 for normal group, almost not changed for control group (1.4 ± 0.1), but significantly increased for P@E (2.8 ± 0.3) and P@E+NIR (3.3 ± 0.3), respectively. Conversely, iNOS expression level was the highest for control group (3.0 ± 0.2), followed by P@E (1.5 ± 0.2), P@E+NIR (1.4 ± 0.2) and normal group (1.0 ± 0.2). Significantly, the expression level of CD31 was in relatively low for normal group (1.0 ± 0.2) and control group (1.1 ± 0.1), which increased to 2.3 ± 0.3 and 2.7 ± 0.2 for P@E and P@E+NIR, respectively. And it was in low levels of HSP70 expression for normal group (0.9 ± 0.2), control group (1.0 ± 0.1) and P@E (1.2 ± 0.1), respectively, only increased for P@E+NIR (1.5 ± 0.1). The above results by WB were consistent with the results of immunofluorescent staining.
In cellular levels, it had demonstrated that PDA and P@E possessed favorable biocompatibility while EGCG had a certain of cytotoxicity. And P@E was helpful to cell proliferation and migration, better than those of PDA and EGCG. Thus, EGCG was not considered for further experiments. In addition, it also confirmed that compared to PDA and P@E, P@E+NIR possessed more efficient antioxidant and anti-inflammatory abilities via down-regulating inflammatory and M1 type factors, and up-regulating antioxidant and M2 type factors of LPS induced RAW264.7, due to its excellent capacities of ROS scavenging and M2 directional polarization. Significantly, P@E+NIR could also effectively promote HSP70 and CD31 expression levels of H2O2 induced NIH3T3, contributed to improved skin wound healing.
Microbial is also one important part of wound microenvironment, and can induce the extra oxidative damage, playing a key role in skin wound healing. Thus, inhibiting bacterial growth is helpful to promoting skin wound healing. The common bacteria (E. coli and MRSA) was considered to investigate the antibacterial ability of NPs. At the beginning, live/dead bacteria staining was implemented to testing the antibacterial ability. And green and red fluorescence separately corresponded to live and dead bacteria. As shown in Fig. S21 (Supporting information), compared to normal group, NPs could efficiently decrease the number of bacteria with the order of bacterial remaining number: PDA > P@E > P@E+NIR. After calculation, for E. coli, the live/dead ratio was 98.1% ± 0.6%, 91.2% ± 7.9%, 34.2% ± 12.3% and 6.2% ± 0.3% for normal group, PDA, P@E and P@E+NIR respectively (Fig. S21B). For MRSA, the live/dead ratio was 97.0% ± 0.2%, 92.8% ± 4.5%, 64.2% ± 9.2% and 12.2% ± 0.7% for normal group, PDA, P@E and P@E+NIR respectively (Fig. S22 in Supporting information). Similarly, the order of live/dead ratio was: normal group > PDA > P@E > P@E+NIR. Besides, from bacterial spreading experiment, the number of both bacteria (E. coli and MRSA) decreased after co-culturing with NPs compared to normal group without treatment. As shown in Figs. S23 and S24 (Supporting information), P@E+NIR most efficiently decreased the number of microbial, followed by P@E and PDA (Figs. S23A and S24A). By statistical analysis, for E. coli, the survival ratio was 100.0% ± 5.7%, 93.6% ± 4.6%, 87.2% ± 3.5% and 0.1% ± 0.1% for normal group, PDA, P@E and P@E+NIR respectively (Fig. S23B). It presented the same tendency for the survival ratio of MRSA: normal group (100.0% ± 0.1%) > PDA (94.3% ± 1.2%) > P@E (73.4% ± 4.9%) > P@E+NIR (1.5% ± 0.3%) (Fig. S24B).
For in vivo experiment, all operations were conducted under the approval of the Ethics Committee of Animal Experiments of Guangxi Medical University. As previously reported, it confirmed that NIR irradiation was helpful to achieving the high efficacy therapy of various diseases with minimizing side effects. To confirm the feasibility of PTT, in vivo photothermal effect was implemented by monitoring the temperature changes of NIR irradiated skin wound site by thermal camera (Fig. S26A in Supporting information). As imaged in Fig. S26B (Supporting information), the temperature slightly increased from 28.7℃ to 29.1℃ after 15 min’ irradiation for sham group. However, the temperature jumped from 28.7℃ to 46.5℃ for P@E, providing the feasibility of PTT, and also contributing to enhanced antibacterial ability.
Meanwhile, in clinic application, hemostatic effect is also one of useful indicators for skin wound repair. As imaged in Figs. S27 and S28 (Supporting information), compared to control group with gradually increased blood loss in the tail and liver, it displayed efficient hemostatic effect of P@E (Figs. S27A and S28A). After calculation, for the tail, the blood loss was 95.3 ± 6.1 mg and 14.1 ± 4.4 mg for control group and P@E respectively (Fig. S27B). And for the liver, blood loss was 209.7 ± 8.9 mg for control group, decreased to 28.3 ± 4.1 mg for P@E (Fig. S28B).
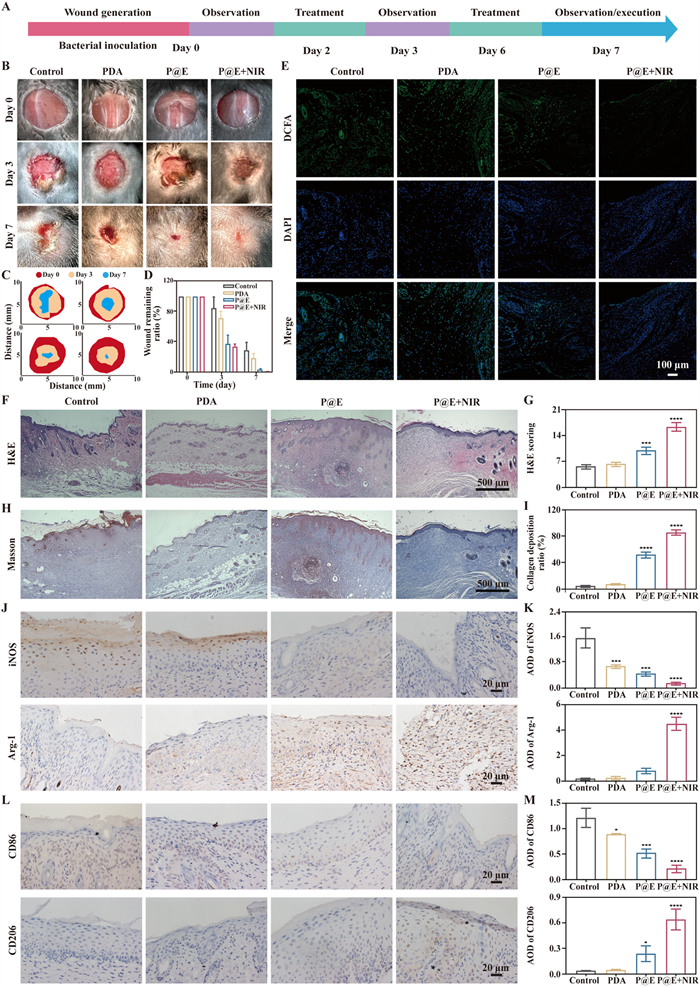
Skin wound animal model was established by following the previously reported research [47]. The wound area was in the diameter of 10 mm, which was not easy to achieve self-healing, but also ultimately possible to reach repair after therapy [48]. The time schedule of in vivo experiment was listed in Fig. 3A. And MRSA was smeared on the skin wound of mice to build infectious wound models [49]. Next, NPs were added in the infectious wound site at predetermined time points. The skin tissue and major organs including heart, liver, spleen, lung and kidney were collected at day 7. From the gross view of skin tissues, the wound was gradually repaired for all groups. On day 7, obvious wound area existed for control group while the gradually decreasing wound area was observed for PDA, P@E and P@E+NIR (Fig. 3B). From the wound simulation diagram, the obvious wound repair was observed for P@E+NIR followed by P@E, PDA and control group (Fig. 3C). After statistical analysis, the wound remaining ratio was 28.9% ± 6.1%, 18.4% ± 3.6%, 3.2% ± 0.8% and 0.9% ± 0.1% for control group, PDA, P@E and P@E+NIR respectively (Fig. 3D).
Figure 3
Figure 3.In vivo therapy evaluation. (A) Time schedule of in vivo skin wound therapy experiment. (B) Macroscopic observation of skin wound of treated mice and (C, D) the corresponding quantified results. (E) ROS levels images of skin tissue of treated mice. Scale bar: 100 µm. (F) H&E staining images of skin tissue of treated mice and (G) the corresponding scoring. Scale bar: 500 µm. (H) Masson staining images of skin tissue of treated mice and (I) the corresponding quantified results. Scale bar: 500 µm. (J) iNOS and Arg-1 expression levels of skin tissue of treated mice by immunohistochemical staining and (K) the corresponding average optical density (AOD). Scale bar: 20 µm. (L) CD86 and CD206 expression levels of skin tissue of treated mice by immunohistochemical staining and (M) the corresponding AOD. Scale bar: 20 µm. The corresponding groups were: skin wound mice without treatment (control group), and with 100 µg/mL PDA (PDA), 100 µg/mL P@E (P@E) and 100 µg/mL P@E with NIR irradiation (808 nm, 1.5 W/cm2) for 10 min at day 0, 2 and 6 (P@E+NIR). *P < 0.05, **P < 0.01, ***P < 0.001, ****P < 0.0001 vs. control group. Data are presented as mean ± SD (n = 3).
And in vivo antibacterial ability was evaluated by re-culturing the homogenate of wound tissue. As imaged in Fig. S29 (Supporting information), a lot of bacteria was observed for control group with the survival ratio of 100.0% ± 4.3%, slightly decreased for PDA (91.6% ± 1.0%) and P@E (73.6% ± 3.3%), and significantly decreased for P@E+NIR (15.5% ± 0.3%). It confirmed that P@E possessed a certain of in vivo antibacterial ability, significantly enhanced by P@E+NIR. However, there were still a few amount of bacteria observed for P@E+NIR due to the inherent bacterial existed on the surface of skin wound.
Later, the pathology characteristic of skin tissue was investigated. The ROS levels of skin wound were also evaluated by dichlorodihydrofluorescein diacetate (DCFA) probe. As illustrated in Fig. 3E, for control group, the green fluorescence was in high levels, corresponding to high ROS levels. PDA slightly decreased the intensity of green fluorescence, indicating its ROS scavenging ability. P@E efficiently decreased the ROS levels of skin wound tissue, significantly enhanced for P@E+NIR. After statistical analysis, the MFI was 1.1 ± 0.1 for control group, sequentially decreased to 0.7 ± 0.1, 0.3 ± 0.2 and 0.1 ± 0.1 for PDA, P@E and P@E+NIR respectively (Fig. S30 in Supporting information).
From hematoxylin-eosin (H&E) staining, obvious infiltration of inflammatory cells was observed for control group. PDA slightly decreased the inflammation degree of skin wound with a few of visible inflammatory cells, where P@E+NIR was most significant, followed by P@E (Fig. 3F). After scoring, it was 5.7 ± 0.6, 6.3 ± 0.6, 10.0 ± 1.1 and 16.3 ± 1.2 for control group, PDA, P@E and P@E+NIR respectively (Fig. 3G). Similarly, major organs were also evaluated by H&E staining. Almost no obvious damages happened for heart, liver, spleen, lung and kidney of all groups, indicating that this therapy strategy did not cause any damages for major organs and presented favorable in vivo biosafety (Fig. S31 in Supporting information). Significantly, from the images of Masson’s trichrome stain (Masson staining), it displayed the collagen deposition situation in repaired skin tissue. As shown in Fig. 3H, compared to control group with few blue collagens observed, it did not obviously change for PDA. However, P@E and P@E+NIR significantly increased the collagen deposition. Especially, obvious collagen deposition happened for P@E+NIR with increased blue intensity. The corresponding collagen deposition ratio was 5.3% ± 1.5% for control group, increased to 8.0% ± 0.6% for PDA, 53.1% ± 2.6% for P@E, 86.7% ± 2.3% for P@E+NIR respectively (Fig. 3I).
What is more, in vivo anti-inflammatory effect was evaluated by iNOS and Arg-1 immunohistochemical staining. As shown in Fig. 3J, the inflammatory factor expression of control group was in high levels with high brown intensity observed. However, its anti-inflammatory factor was relative low with almost no brown intensity shown. It displayed slight anti-inflammation capacities for PDA with minor decreased expression level of iNOS, and increased expression level of Arg-1. However, P@E and P@E+NIR significantly lowered iNOS expression level and increase Arg-1 expression level, where P@E+NIR was most obvious. After scoring, the iNOS expression level was 1.6 ± 0.3, 0.7 ± 0.1, 0.5 ± 0.1 and 0.2 ± 0.1 for control group, PDA, P@E and P@E+NIR respectively while for Arg-1 expression, the corresponding score was 0.2 ± 0.1, 0.2 ± 0.2, 0.8 ± 0.2 and 4.4 ± 0.5 (Fig. 3K). Similarly, compared to control group, P@E+NIR significantly induced the low expression of CD86 with the score of 0.2 ± 0.1, and high expression of CD206 with the score of 0.6 ± 0.2, followed by P@E with the score of 0.5 ± 0.1 and 0.3 ± 0.1, and PDA with the score of 0.9 ± 0.1 and 0.1 ± 0.2 (Figs. 3L and M). Significantly, high expression level of HSP70 was observed for P@E+NIR (1.1 ± 0.1) compared to other groups: control group (0.1 ± 0.3), PDA (0.2 ± 0.2) and P@E (0.6 ± 0.1). And for CD31 expression level, it was 0.1 ± 0.1, 1.2 ± 0.2, 1.9 ± 0.2 and 4.9 ± 0.6 for control group, PDA, P@E and P@E+NIR respectively (Fig. S32 in Supporting information).
In this study, we developed a novel nanozyme (P@E) combining with NIR irradiation for the synergistic enhancement of infectious skin wound healing. P@E was fabricated by loading nanosized PDA with EGCG, thus achieving the combination of antioxidant and anti-inflammation, antibacterial, and promoted tissue repair. PDA core was applied to enable P@E to serve as a photothermal agent, and EGCG offered the enhanced antioxidant and anti-inflammation, and tissue repair capacities. The excellent ROS scavenging, combined with photothermal enhancement of antibacterial and tissue repair, achieved an efficient synergistic infectious wound healing by inhibiting bacterial proliferation, decreasing the intracellular ROS levels, down-regulating the expression levels of inflammatory cytokines, inducing M2 directional polarization, and up-regulating tissue repair factors expression levels. Most importantly, P@E+NIR, with excellent biocompatibility and hemostatic ability, presented the outstanding behaviors of decreasing bacterial infections and inflammation in wound site, and promoting the expression levels of HSP70 and CD31 in skin wound. It finally concluded that P@E+NIR, an effective strategy with synergistic enhancement of infectious skin wound healing, show great potentials in clinical treatment of infectious diseases.
Declaration of competing interest
The authors declare that they have no known competing financial interests or personal relationships that could have appeared to influence the work reported in this paper.
The work was financially supported by the Natural Science Foundation of Guangxi (Nos. 2022GXNSFAA035505 and 2024GXNSFAA010164), the Key Research & Development Program of Guangxi (No. GuiKe2024AB08057), the Guangxi Medical and Health Suitable Technology Development and Popularization Applications Project (Nos. S2023093 and S2021084), and the Major Talent Project of Guangxi Autonomous Region.
Supplementary materials
Supplementary material associated with this article can be found, in the online version, at doi:10.1016/j.cclet.2024.110569.
[1]
C. Gao, H.T.K. Chery, M. Tang, et al., Matter 6 (2023) 3889–3911.
[2]
M. Karam, G. Daoud, Asian J. Pharm. Sci. 17 (2022) 491–522.
[3]
X. Wang, Q. Li, Y. Miao, et al., ACS Nano 17 (2023) 15568–15589. doi: 10.1021/acsnano.3c02304
M. Chen, Q. Han, M. Zhang, et al., Sci. Adv. 10 (2024) e9485.
Figure 1
Physicochemical characterization of NPs. (A) FTIR results of DA, PDA, EGCG and P@E. (B) Diameter of PDA and P@E by zeta sizer. (C) Zeta potential of PDA and P@E by zeta sizer. (D) TEM-mapping results of P@E and the corresponding element composition (HAADF, C, N and O images). Scale bar: 100 nm. (E) Photothermal images of different NPs (PBS, PDA, EGCG and P@E) with 100 µg/mL under NIR irradiation (1.5 W/cm2) versus time. (F) Temperature changes of different NPs (PBS, PDA, EGCG and P@E) with 100 µg/mL under NIR irradiation (1.5 W/cm2) (ⅰ), different concentrations (50, 100 and 200 µg/mL) of P@E under NIR irradiation (1.5 W/cm2) (ⅱ), 100 µg/mL P@E under different power intensity of NIR irradiation (1, 1.5 and 2 W/cm2) (ⅲ) versus time, and photothermal stability of 100 µg/mL P@E under NIR irradiation (1.5 W/cm2) for 4 “on” and “off” cycles (ⅳ). (G) ESR results of 100 µg/mL different NPs (control group, PDA, P@E and P@E+NIR): •OH, •O2− and 1O2. Data are presented as mean ± standard deviation (SD) (n = 3).
Figure 2
Antioxidant and anti-inflammatory capacities in cellular level. (A) Intracellular ROS levels of H2O2 treated cells by fluorescent microscope and (B) the corresponding quantified results (RAW264.7 (ⅰ) and NIH3T3 (ⅱ)). (C) Genes expression levels of treated cells by qRT-PCR: iNOS (ⅰ), Arg-1 (ⅱ), CD86 (ⅲ) and CD206 (ⅳ) for RAW264.7, and HSP70 (ⅴ) and CD31 (ⅵ) for NIH3T3. (D) CD86 and CD206 expression levels of treated cells by immunofluorescent microscopy and (E) the corresponding quantified results (CD86 (ⅰ) and CD206 (ⅱ)). The corresponding groups were: cells without treatment (normal group), pre-treated cells (RAW264.7 pre-treated with LPS, and NIH3T3 pre-treated with H2O2) followed by incubating with PBS buffer (control group), 100 µg/mL P@E (P@E), and 100 µg/mL P@E and NIR irradiation (1.5 W/cm2, 10 min) (P@E+NIR). Scale bar: 50 µm. *P < 0.05, **P < 0.01, ***P < 0.001, ****P < 0.0001 vs. normal group. Data are presented as mean ± SD (n = 3).
Figure 3In vivo therapy evaluation. (A) Time schedule of in vivo skin wound therapy experiment. (B) Macroscopic observation of skin wound of treated mice and (C, D) the corresponding quantified results. (E) ROS levels images of skin tissue of treated mice. Scale bar: 100 µm. (F) H&E staining images of skin tissue of treated mice and (G) the corresponding scoring. Scale bar: 500 µm. (H) Masson staining images of skin tissue of treated mice and (I) the corresponding quantified results. Scale bar: 500 µm. (J) iNOS and Arg-1 expression levels of skin tissue of treated mice by immunohistochemical staining and (K) the corresponding average optical density (AOD). Scale bar: 20 µm. (L) CD86 and CD206 expression levels of skin tissue of treated mice by immunohistochemical staining and (M) the corresponding AOD. Scale bar: 20 µm. The corresponding groups were: skin wound mice without treatment (control group), and with 100 µg/mL PDA (PDA), 100 µg/mL P@E (P@E) and 100 µg/mL P@E with NIR irradiation (808 nm, 1.5 W/cm2) for 10 min at day 0, 2 and 6 (P@E+NIR). *P < 0.05, **P < 0.01, ***P < 0.001, ****P < 0.0001 vs. control group. Data are presented as mean ± SD (n = 3).

 DownLoad:

 下载:
下载:


 下载:
下载:
