School of Chemistry & Chemical Engineering and Environmental Engineering, Weifang University, Weifang 261061, China
b.
School of Chemistry and Chemical Engineering, Tianjin University of Technology, Tianjin 300384, China
c.
State Key Laboratory of Featured Metal Materials and Life-cycle Safety for Composite Structures, Guangxi Key Laboratory of Processing for Non-ferrous Metals and Featured Materials, School of Resources, Environment and Materials, Guangxi University, Nanning 530004, China
hejia1225@126.com (J. He). 1 These authors contributed equally to this work.
Received Date:
22 June 2024 Accepted Date:
08 October 2024 Revised Date:
29 September 2024 Available Online:
15 April 2025
Abstract:
Unraveling the essence of electronic structure effected by d-d orbital coupling of transition metal and methanol oxidation reaction (MOR) performance can fundamentally guide high efficient catalyst design. Herein, density functional theory (DFT) calculations were performed at first to study the d–d orbital interaction of metallic PtPdCu, revealing that the incorporation of Pd and Cu atoms into Pt system can enhance d-d electron interaction via capturing antibonding orbital electrons of Pt to fill the surrounding Pd and Cu atoms. Under the theoretical guidance, PtPdCu medium entropy alloy aerogels (PtPdCu MEAAs) catalysts have been designed and systematically screened for MOR under acid, alkaline and neutral electrolyte. Furthermore, DFT calculation and in-situ fourier transform infrared spectroscopy analysis indicate that PtPdCu MEAAs follow the direct pathway via formate as the reactive intermediate to be directly oxidized to CO2. For practical direct methanol fuel cells (DMFCs), the PtPdCu MEAAs-integrated ultra-thin catalyst layer (4–5 µm thickness) as anode exhibits higher peak power density of 35 mW/cm2 than commercial Pt/C of 20 mW/cm2 (~40 µm thickness) under the similar noble metal loading and an impressive stability retention at a 50-mA/cm2 constant current for 10 h. This work clearly proves that optimizing the intermediate adsorption capacity via d-d orbital coupling is an effective strategy to design highly efficient catalysts for DMFCs.
Direct methanol fuel cells (DMFCs) as green and sustainable devices have been received widespread attention in many portable electronics owning to their high theoretical energy density (6.13 kWh/kg), abundant source, low-cost, and simple cell structure [1,2]. To achieve large-scale application, it is essentially vital to exploit efficient and robust methanol oxidation reaction (MOR) electrocatalysts. The MOR in DMFCs anode is a very slow process that involves the 6 e- transfer to the electrode to completely oxidize methanol to CO2. The MOR mechanism shows that there are two reaction paths, including direct path (HCOOH path) and indirect path (CO path). In the CO path, methanol is first dehydrogenated to CO and then further oxidized to CO2, while in the HCOOH path, methanol is directly oxidized to CO2 [3-5]. The sluggish MOR kinetics caused by the poisoning of carbonaceous intermediates lead to low activity and poor durability under pH-universal [3]. The effective way to overcome the above problems is to add other precious metals or transition metals to reduce the binding energy of CO intermediates and improve the catalytic activity [4-6]. Nowadays, alloying strategy can greatly adjust the surface structure of the catalyst, thus regulating the adsorption and reaction rate of the intermediate, so as to significantly improve the catalytic activity of the catalyst, such as Pt-M alloy (M = Ru [7,8], Cu [9], Pd [10], Ni [11], Rh [12], Co [13], Zn [14], Ag [15], Au [16]), which have shown high MOR capability due to their tunable electronic configuration [17,18]. The MOR volcano diagram calculated by density functional theory (DFT) has demonstrated that the PtCu alloy structure is closer to the top of the volcano diagram than other alloy structure, benefited by the high activation activity of methanol on Pt atoms and the Cu elements to extract OH* from water [19-21]. However, conventional alloy catalysts lack precise modulation of d orbitals electron interaction for targeting active sites for various intermediates produced in the MOR process.
Medium-entropy alloys (MEAs) as prospective electrocatalysts have received much interest owing to the synergistic effects of multi-element composition space and intensive catalytic performance [22-25]. Considering the high correlation between surface activation and electrocatalytic performance for MOR, a desired MEAs catalyst needs adjustable electronic configuration over reaction intermediates. Nevertheless, there are still huge challenges to evaluate the relationship of MEAs electronic structure and their catalytic performance. Therefore, it is particularly important to design active sites on the catalyst surface that can synergistically modulate the activation energy barrier of intermediates by d-electron interaction to optimize the catalytic performance for MOR. Pt atoms have significant CO* adsorption catalytic activity and Cu atoms play an important role in the water dissociation. Hence, Pt and Cu atoms are the main active sites for MOR. Pd as a transition metal is able to optimize the Pt electronic structure and thus enhance the electron transfer in the electrocatalytic process [26-29]. Based on the 3d94s2, 4d10, and 5d96s1 valence electron configuration of Cu, Pd and Pt, the introduction of non-full (3d9) and full (4d10) valence electron of Cu and Pd to facilitate favorable Cu 3d/Pd 4d/Pt 5d orbitals electron interaction for electrocatalysis. Therefore, it is highly scientifically meaningful to unravel the regulation behavior by constructing catalysts with adjusted electronic structures as models to reveal the relationship of d-d orbital coupling and MOR electrocatalytic performance. Nevertheless, there are still huge challenges to systematically and clearly evaluate the relationship between electron structure effected by d-d orbital coupling of catalysts and MOR electrocatalytic performance.
Herein, we demonstrated the first example on engineering the d-electron orbitals coupling over Pt 5d/Pd 4d/Cu 3d system for optimizing the d-band center of Pt to achieve high-performance DMFCs. In particular, DFT calculations of density of states (DOS), charge transfer and crystal orbital Hamilton population (COHP) demonstrated that there existed strong d-d electron interaction over Pt 5d, Pd 4d and Cu 3d orbitals. Based on the results of d-d orbitals theory, we prepared PtPdCu medium entropy alloys aerogels (PtPdCu MEAAs) with ultrathin diameter of ~6 nm and adjustable surface composition by a simple surfactant-free and NaBH4-reduction method. The PtPdCu MEAAs catalysts showed high specific activity of 3.24 mA/cm2 and 4.22 mA/cm2 in acid and alkaline electrolyte, exhibiting higher MOR activity compared to PtCu AAs (1.80 mA/cm2 and 2.73 mA/cm2) and PdCu AAs (0.21 mA/cm2 and 2.51 mA/cm2), PtPd AAs (1.35 mA/cm2 and 2.10 mA/cm2) as well as Pt/C catalysts (0.83 mA/cm2 and 1.14 mA/cm2). In neutral condition, the PtPdCu MEAAs possessed a higher MOR activity with a current density of 1086.7 mA/mgNoble metal than that of the Pt/C (587.5 mA/mgNoble metal), PtCu AAs (687.9 mA/mgNoble metal) and PtPd AAs (582.5 mA/mgNoble metal) yet. Moreover, the PtPdCu MEAAs presented a strong CO anti-poisoning ability which peak potentials of CO-stripping curve shift down by ~100 mV compares to that of Pt/C. DFT calculations and in-situ FTIR spectra analysis on the PtPdCu MEAAs confirmed that the direct pathway via formate as the reactive intermediate to be directly oxidized to CO2 will be more active. A single-cell tests of polarization curves displayed a higher peak power density of 35 mW/cm2, compared to commercial Pt/C of 20 mW/cm2. And single cell also exhibited an impressive stability retention of 76% at a 50 mA/cm2 constant current density for 10 h. The results demonstrated that PtPdCu MEAAs with d-d orbitals coupling was indeed an efficient MOR electrocatalyst in DMFCs.
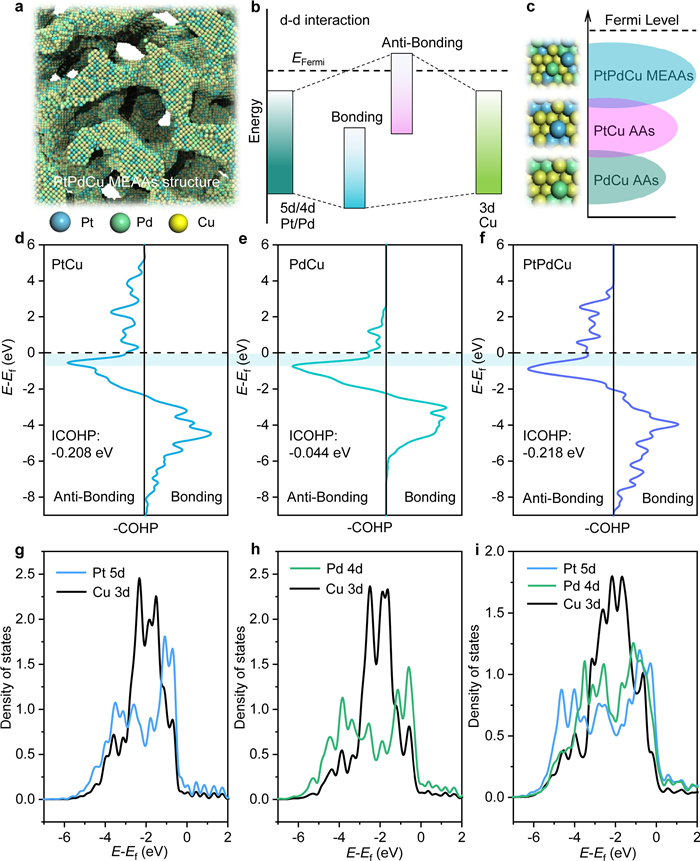
The d-d orbital coupling of transition metal alloys plays a crucial regulatory role in the catalytic performance that the energy level after electron interaction effected from d orbitals can split into a bonding state and an anti-bonding state [30-33]. The Fermi level plays an important role in stabilizing systems, where the position of the anti-bonding state relative to the Fermi level directly controls the electronic interaction [34]. Here, for investigating the relationship between d-d orbitals electron interaction in each metal component and MOR catalytic performance, the PtPdCu MEAAs as a model was chosen and regulate the Pt 5d/Pd 4d/Cu 3d orbitals coupling by inducing alloying. The atomic stacking model and the d-d orbitals interaction schematic illustration of PtPdCu MEAAs were presented on Figs. 1a and b, respectively. At first, the crystal orbital Hamilton population (COHP) was calculated to analysis the d-d orbitals coupling impact on the adsorption characteristic of adsorbate molecule by introducing Pt, Pd and Cu transition metal heteroatoms. As shown in Figs. 1d–f, the COHPs were displayed following the usual way. That is to draw negative (bonding) contributions to the right and positive (anti-bonding) to the left. While the PtPdCu structure presented a decrease of the filling of anti-bonding orbital population, increasing the binding strength with methanol molecule.
Figure 1
Figure 1.
(a) Schematic illustration atomic stacking and (b) the d−d orbitals coupling model of PtPdCu MEAAs. (c) Schematic illustration Ef of PdCu, PtCu and PtPdCu. The COHP analysis of (d) PtCu, (e) PdCu and (f) PtPdCu. PDOS plots of d-d orbitals coupling of (g) PtCu, (h) PdCu and (i) PtPdCu structures.
Otherwise, the integral COHP (ICOHP) obtained by calculating the energy integral up to the highest occupied bands that below Fermi level, directly giving more quantitative information to evaluate the adsorption performance for adsorbate molecule. And the ICOHPs of PtCu, PdCu and PtPdCu system were −0.208 eV, −0.044 eV and −0.218 eV, respectively. The results have demonstrated that a less anti-bonding electron orbital filling for PtPdCu system by enhancing the of d-d orbitals electron interaction. Thereby modulating the MOR by lowering the adsorption free energy of adsorbate molecule. Therefore, the stronger d-d orbitals between Pt, Pd and Cu atoms in PtPdCu MEAAs entail the upshift of Ef (Fig. 1c). To reveal the essence of electronic structure in each metal d orbital, the corresponding projected density of states (PDOSs) was calculated (Figs. 1g–i). It was obvious that the center of Pt 5d orbital is close to the Fermi level, resulting in fewer anti-bonding components filling below the Fermi level. It explains the essential characteristic of PtPdCu with strong adsorption for adsorbate molecule. Compare to PdCu and PtCu systems, PtPdCu structure has a wider Pt 5d, Pd 4d and Cu 3d band of orbitals coupling and higher density near the Fermi level for PtPdCu than that of PdCu and PtCu, suggesting that the PtPdCu system could induce more free electrons near Pt electrons transfer.
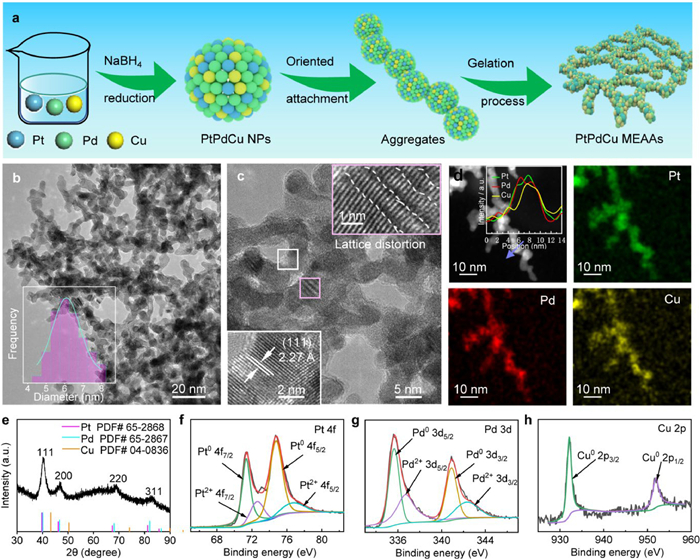
PtPdCu MEAAs as a d-d electron orbitals model were synthesized by a simple NaBH4-assisted reduction and surfactant-free approach, and the synthesis process is shown schematically in Fig. 2a, demonstrated by our previous work [29,35]. To investigate the growth mechanism of the alloy aerogels, the structures were characterized by UV–vis spectroscopy (Fig. S1 in Supporting information) and time-dependent transmission electron microscopy (TEM) images (Fig. S2 in Supporting information) of the morphology evolution in different synthesis processes [36,37]. HRTEM images were performed to investigate the PtPdCu MEAAs morphology structure. Fig. 2b and Fig. S3 (Supporting information) present the structures of the PtPdCu MEAAs with interlinked ultrathin nanowires. The PtPdCu MEAAs display an average diameter distribution of ~6 nm, as presented in the inset in Fig. 2b. As shown in Fig. 2c, there is a major interplanar distances along the single nanowire are about 2.27 Å, which could be assigned to the (111) plane of face-centered cubic (fcc) PtPdCu alloy. Moreover, it shows severe lattice distortion (the inset in Fig. 2c) [24]. EDS mapping images (Fig. 2d) and the corresponding line-scanning profile for elemental analysis display a uniform distribution of Pt, Pd and Cu atoms on the whole nanowires, as shown in the inset in Fig. 2d. The Pt/Pd/Cu atomic ratio of the PtPdCu MEAAs was 29/26/45, which obtained by inductively coupled plasma optical emission spectrometer (ICP-OES) measurement, and the result corresponds with the ratio determined by STEM-EDS (Figs. S4 and S5 in Supporting information). According to Boltzmann's hypothesis, the change in entropy of mixing (ΔSmix) of PtPdCu alloy can be deduced as 1.1R, which was regarded as medium entropy alloys [38,39]. Binary PtCu AAs, PdCu AAs and PtPd AAs were synthesized with Pt/Cu, Pd/Cu and Pt/Pd atomic ratio of 1/2 and structure similar to PtPdCu MEAAs, and PtCu AAs (Fig. S6 in Supporting information) and PdCu AAs (Fig. S7 in Supporting information) morphological were characterized by TEM images.
Figure 2
Figure 2.
(a) Schematic illustration for preparing PtPdCu MEAAs networks by simple NaBH4 reduction method. (b) TEM image, inset shows the diameter size distribution presented in the inset. (c) HRTEM image, inset show the randomly selected magnified images. (d) STEM image and EDS elemental mapping images of Pt, Pd and Cu atoms, inset shows the STEM-EDS line-scanning profile. (e) XRD pattern of PtPdCu MEAAs. XPS spectras of (f) Pt 4f, (g) Pd 3d and (h) Cu 2p.
The PtPdCu MEAAs were analyzed by X-ray diffraction (XRD) (Fig. 2e). The distinct peaks assigned to (111), (200), (220), and (311) planes display positive shift according to Pt (PDF #65–2868), Pd (PDF #65–2867) and Cu (PDF #04–0836) crystalline structure, proving uniform alloying of the well-defined PtPdCu MEAAs catalysts [29,40]. In addition, a small diffraction peak (marked by a red dashed line) appears at an angle of about 35.2° for PtCu AAs and PdCu AAs, which could be the crystallographic structure for oxide of Cu (Fig. S8 in Supporting information) [41]. X-ray photoelectron spectroscopy (XPS) present the electron structure of PtPdCu MEAAs, revealing that Pt, Pd and Cu elements are primarily in the metallic state, indicating that surface Pt or Pd atoms prevents Cu atoms from being oxidized (Figs. 2f–h). For PtPdCu MEAAs, the peaks of Pt0 4f and Pd0 3d are positively shifted ~0.38 eV and ~0.55 eV compare to pure Pt and Pd [42,43]. Meanwhile, the Cu0 2p peak has a negative shift ~0.34 eV with respect to bulk Cu [42,44,45]. This indicates a strong electronic effect between Pt 4f, Pd 4d and Cu 2p electronic orbits of PtPdCu MEAAs due to the charge transfer between Pt, Pd and Cu atoms. The electron interaction between Pt, Pd and Cu could modulate the adsorption/desorption of intermediate oxygenated species and therefore beneficial for MOR catalysts [26,46].
For the practical applications of direct methanol fuel cell, this is grand challenge that the MOR is dramatically retarded at pH-general conditions, especially in neutral condition due to the sluggish water dissociation step caused by an insufficient H+ number [47]. Herein, the MOR performances of PtPdCu MEAAs, PdCu AAs, PtCu AAs and PtPd AAs are investigated in 0.1 mol/L HClO4, 1 mol/L KOH and 1 mol/L Na2SO4 solution electrolytes with wide pH values. At first, CV measurements of PtPdCu MEAAs, PtCu AAs, PdCu AAs, PtPd AAs and commercial Pt/C and Pd/C catalysts were performed in 0.1 mol/L HClO4 solution (Fig. 3a, Figs. S9a and S10a in Supporting information). The ECSAs of PtPdCu MEAAs, PtCu AAs, PdCu AAs, PtPd AAs and commercial Pt/C and Pd/C were calculated to be 45.9 m2/gNoble metal, 40.8 m2/gNoble metal, 42.5 m2/gNoble metal 38.9 m2/gNoble metal, 69.6 m2/gNoble metal, and 18.2 m2/gNoble metal, respectively, based on the integrated hydrogen adsorption/desorption region charge of Pt-based aerogels and PdO reduction peak of PdCu AAs from the CV curves in acidic solution. In contrast to the binary PdCu AAs, PtCu AAs and PtPd AAs, the PtPdCu MEAAs with interconnected structure exhibited a higher ECSA and displayed abundant electrochemically active sites [48].
Figure 3
Figure 3.
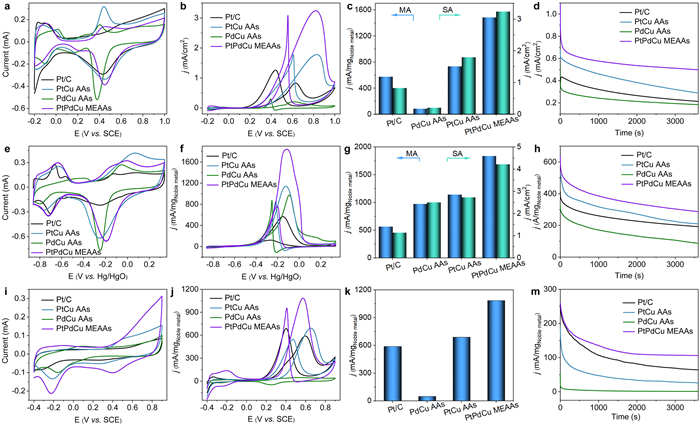
Electrocatalytic performance of commercial Pt/C, PtCu AAs, PdCu AAs and PtPdCu MEAAs catalysis under pH-general conditions: (a, e, i) CV curves, (b, f, j) MOR polarization curves. (c, g, k) Histograms of specific activity and mass activity of MOR. (d, h, m) CA curves at 0.5 V vs. SCE, −0.2 V vs. Hg/HgO and 0.4 V vs. SCE for 3600 s, respectively. The measurements were performed in (a-d) 0.1 mol/L HClO4 or 0.1 mol/L HClO4 + 1 mol/L methanol, (e-h) 1 mol/L KOH or 1 mol/L KOH + 1 mol/L methanol, and (i-m) 1 mol/L Na2SO4 or 1 mol/L Na2SO4 + 1 mol/L methanol, with scan rate of 50 mV/s, respectively.
The electrochemical activity for MOR in acidic condition for PtPdCu MEAAs, PtCu AAs, PdCu AAs PtPd AAs and commercial Pt/C and Pd/C catalysts was investigated. As shown in Fig. 3b, Figs. S9b and S10b (Supporting information), the peak current density of the PtPdCu MEAAs has higher MOR performance than PtCu AAs, PdCu AAs PtPd AAs and commercial Pt/C and commercial Pd/C display almost no MOR performance. The specific activity of PtPdCu MEAAs, PtCu AAs, PdCu AAs, PtPd AAs and Pt/C catalysts were 3.24, 1.80, 0.21, 1.35, and 0.83 mA/cm2, respectively. The mass activity of PtPdCu MEAAs was 1487.2 mA/mgNoble metal, which were 2.0-folds, 17.2-folds, 2.8-folds, and 2.6-folds higher than that of PtCu AAs (734.2 mA/mgNoble metal), PdCu AAs (86.5 mA/mgNoble metal), PtPd AAs (527.3 mA/mgNoble metal) and Pt/C (576.3 mA/mgNoble metal), respectively (Fig. 3c). According to the mechanism of methanol oxidation, during the forward scan, methanol was first oxidized to carbon dioxide, carbon monoxide and/or other carbonaceous intermediates. During the reverse scan, the MOR intermediates were further oxidized to carbon dioxide [14]. The forward scan current density with full potential range of PtPdCu MEAAs was higher among all four catalysts. From the above results, it demonstrated that the high activity of PtPdCu MEAAs benefits from the strong d-d electron interaction of co-alloying effect of Pt atoms, Pd atoms and Cu atoms.
Chronoamperometry (CA) curves in acidic solution at a potential of −0.5 V vs. SCE for 3600 s were shown in Fig. 3d to evaluate catalysts durability. The high initial current densities of the PtPdCu MEAAs, PtCu AAs, PdCu AAs and Pt/C catalysts were ascribed to the abundant active sites for activating of methanol. Subsequently, the MOR activity decreased quickly at the initial stage, probably because of the poison of intermediates like CO on catalysts surface under low potential or the dropped quickly the concentration of methanol around the catalysts [35]. After CA tests for 3600 s, the PtPdCu MEAAs displayed a higher current density of 0.41 mA/cm2 compare to commercial Pt/C (0.21 mA/cm2), PtCu AAs (0.28 mA/cm2) and PdCu AAs (0.18 mA/cm2), further confirming that the PtPdCu MEAAs presented the excellent activity and durability for MOR. Furthermore, a relatively complete 1D structure of PtPdCu MEAAs was maintained after the CA test without obvious agglomeration and broken (Fig. S11 in Supporting information). The XPS spectrum showed that the Pt electronic structure of the PtPdCu MEAAs had no significant change after the stability measurement for MOR (Fig. S12 in Supporting information).
The MOR activities of PtPdCu MEAAs, binary PtCu AAs, PdCu AAs and Pt/C catalysts were determined in alkaline solution containing 1 mol/L methanol electrolytes. Fig. 3e, Figs. S9c and S10c (Supporting information) present the CV curves measured in N2-saturated 1 mol/L KOH electrolyte. Relative to Pt/C, the PtO reduction peak potential of PtPdCu MEAAs presents a major upshift of ~61 mV. Moreover, compared to other three catalysts, the similar upshift phenomenon of PtO reduction peak potential for PtPdCu MEAAs was also observed in both acidic and neutral electrolytes. The above results demonstrate that intermediates like CO were easily removed by activating water because of the stronger binding ability of OH* on the PtPdCu MEAAs surface. As displayed in Fig. 3f, Figs. S9d and S10d (Supporting information), the PtPdCu MEAAs displays the highest peak current density of 1839.4 mA/mgNoble metal than that of Pd/C (375 mA/mgNoble metal), Pt/C (565.1 mA/mgNoble metal), PdCu AAs (972.8 mA/mgNoble metal), PtCu AAs (1140.9 mA/mgNoble metal) and PtPd AAs (864.4 mA/mgNoble metal). And the corresponding specific activity of PtPdCu MEAAs, PtCu AAs, PdCu AAs, PtPd AAs, Pd/C and Pt/C are 4.22 mA/cm2, 2.73 mA/cm2, 2.51 mA/cm2, 2.1 mA/cm2, 2.0 mA/cm2 and 1.14 mA/cm2, respectively (Fig. 3g). The MOR stability in alkaline solution of the four catalysts was examined at −0.2 V vs. Hg/HgO. It shown that the highest peak current density still retains 287.2 mA/mgNoble metal even after 3600 s, was larger than these of Pt/C (192.2 mA/mgNoble metal), PdCu AAs (87.3 mA/mgNoble metal) and PtCu AAs (209.3 mA/mgNoble metal), as shown in Fig. 3h. Next, we studied the electrocatalytic activity and long-term stability for MOR among the four catalysts in neutral condition with 1 mol/L Na2SO4 and 1 mol/L methanol solution. Fig. 3i, Figs. S9e and S10e (Supporting information) show the CV curves tested in neutral electrolyte. Differ from CV curves tested in acidic and alkaline solution, there was no obvious hydrogen desorption peak on range from −0.4 V to 0 V vs. SCE. As expected, the PtPdCu MEAAs still displays a higher MOR activity with a current density of 1086.7 mA/mgNoble metal than that of the Pt/C (587.5 mA/mgNoble metal), PtCu AAs (687.9 mA/mgNoble metal) and PtPd AAs (582.5 mA/mgNoble metal), as well as PdCu AAs and Pd/C exhibits almost no MOR performance in neutral electrolyte (Figs. 3j and k, Figs. S9f and S10f in Supporting information). After CA tests at 0.4 V vs. SCE, the expected PtPdCu MEAAs catalyst retained a mass activity of 106.2 mA/mgNoble metal after 3600 s (Fig. 3m). The above electrochemical results demonstrate that the strong d-d interaction of PtPdCu MEAAs catalysts facilitated the activity and durability for pH-general MOR, surpassing the most reported in literature for Pt-based or Pd-based electrocatalysts (Table S1 in Supporting information).
To further understand the excellent performance of PtPdCu MEAAs, MOR was also performed within the temperature range from 273.15 K to 303.15 K, and the activation energy of the four catalysts was calculated by Arrhenius equation. Further corresponding information can be found in Figs. S13a and b (Supporting information). Electrochemical impedance spectroscopy (EIS) tests were performed at 0.4 V vs. SCE to analyze the reaction dynamics of electrodes (Fig. S13c in Supporting information). CO-stripping tests were performed to reveal the anti-CO poisoning activity for PtPdCu MEAAs and the data analysis as displayed in Fig. S13d (Supporting information). On the whole, it can be concluded that the PtPdCu MEAAs possess the excellent conductivity and thus facilitating electron transfer to enhance MOR activity. PtPdCu MEAAs also has excellent CO oxidation reactivity because of the strong d-d interaction by the incorporation of Cu and Pd into Pt lattice.
Experimental and theoretical calculations show that there are two main reaction paths for MOR process on the surface of Pt-based alloy catalysts, namely HCOOH direct path and CO indirect path [49,50]. Among them, the intermediate product CO* is easily produced at low potential during the MOR process, so the reaction step of CO* + OH* is the step that determines the MOR rate to effectively and timely remove CO* [51-55]. Thus, we further studied the electronic structure properties of CO and COOH intermediates adsorbed on PtCu (111) PdCu (111) and PtPdCu (111) surfaces by PDOS and charge density differential analysis based on DFT calculations, providing more details on the interaction between COOH and CO on the catalyst surface and further illustrate the structure-activity relationship and the further corresponding analysis information in Figs. S14–S16 (Supporting information).
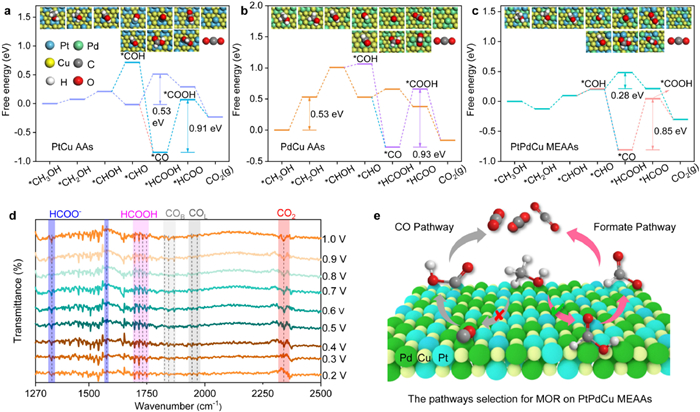
DFT calculations were carried out to understand the possible mechanistic and high performance for MOR on PtPdCu surfaces. MOR Gibbs free energy profiles of PtPdCu (111), PtCu (111), PdCu (111) based on standard hydrogen electrode reaction were calculated. Table S2 (Supporting information) gives the Gibbs free energies of the MOR elementary reaction steps on PtPdCu (111), PtCu (111) and PdCu (111) surfaces. Figs. 4a–c show the reaction full pathway spectrum for MOR on the surface of PdCu (111), PtCu (111) and PtPdCu (111) respectively, including the HCOOH direct pathway and the CO indirect pathway [50,51]. As for the CO indirect pathway, the reaction path spectrum of MOR shows that the potential-determining step (PDS) is *CO + H2O → *COOH + H+ + e-. The smaller the PDS value, the higher the activity of the catalyst. PDS values of PdCu (111), PtCu (111) and PtPdCu (111) surfaces for MOR are 0.93 eV, 0.91 eV and 0.85 eV, respectively. The smallest PDS value of PtPdCu (111) surface indicated that H2O molecules are more easily activated on the PtPdCu surface to oxidize and remove the adsorbed CO* on Pt atoms, proving that the PtPdCu MEAAs alloy catalyst has stronger ability of CO anti-poisoning and higher catalytic performance for MOR. Moreover, PdCu has the largest PDS value (0.93 eV) for CO to COOH step, and the dehydrogenation of CH3OH to CH2OH also has a high reaction energy barrier with 0.53 eV. Thus, PdCu AAs have a low MOR ability, consistent with the experimental results. The above DFT calculations have demonstrated that the PtPdCu MEAAs possess strong d-d electron interaction, and thus facilitating the adsorption stability of CO* and OH* intermediates by extracting OH* from adsorbed water on the PtPdCu MEAAs electrode surface at high potentials, but the modulation d-d electron interaction provides adsorbed OH* under low potential near Pt active sites. As shown in Fig. 4c of the energy profiles for MOR over PtPdCu MEAAs, the reaction step occurred at [*COH → *CO + H+ + e-] present a high energy barrier of 1.02 eV on the CO indirect pathway, and a low energy barrier of 0.28 eV occurred at [*CHO + H2O → *HCOOH + H+ + e-] over the HCOOH direct pathway, demonstrating that the preferred reaction pathways over PtPdCu MEAAs can be the direct pathway via formate as reactive intermediate. For the reaction step profiles on PtCu AAs, the PDS occurs at [*CHO + H2O → *HCOOH + H+ + e-] has a high energy barrier of 0.53 eV compare to PtPdCu MEAAs of 0.28 eV, revealing that the efficient d-d orbital coupling between Pt 5d, Pd 4d, and Cu 3d lowers the energy barrier of electron transfer during MOR process, and thus facilitating the stabilization of key intermediates of the direct formate pathway to enhance MOR [56].
Figure 4
Figure 4.
DFT calculation and in-situ FTIR spectra analysis of the MOR mechanism on the PtPdCu MEAAs. The free-energy diagrams of reaction full pathway spectrum (HCOOH direct pathway and CO indirect pathway) for MOR over the surface of (a) PdCu AAs, (b) PtCu AAs and (c) PtPdCu MEAAs. (d) In-situ FTIR spectra for PtPdCu MEAAs catalysts and (e) schematic illustration of reaction pathway selectivity on PtPdCu MEAAs for MOR process.
To reveal the evolution of the reaction intermediates and byproduct on the PtPdCu MEAAs surface at molecular level during MOR, in-situ FTIR analysis was performed. Pt-based nanomaterials have strong dehydrogenation ability in acidic electrolyte, so we preferentially choose acidic system to study the reaction mechanism for MOR. Negative going bands represent the production of substances, and positive going bands represent the consumption of substances. Fig. 4d displayed the acquired spectra of 0.5 mol/L H2SO4 and 1 mol/L methanol solution on PtPdCu MEAAs at potentials between 0.2 V and 1 V vs. SCE during successive potential steps of 0.1 V. The following characteristic bands allow the identification of the bulk products: The band with a strong intensity at 2341 cm-1 related to the asymmetrical stretching mode of the O=C=O group of the CO2 molecule, as the potential is above 0.4 V vs. SCE [57,58]. The intensity of the bands increased with potential, thus revealing a main expected product by a complete methanol molecule oxidation. The band around at 1653 cm-1 related to the water bending mode on the Pt sites [59]. The band related to the linearly adsorbed CO (COL) species (within the range of 1935−1968 cm-1), together with the band at the range of 1828−1867 cm-1 arising from the bridge-bonded CO (COB), indicating the formation of CO intermediate at the beginning for the MOR occurs at 0.2 V vs. SCE [50,58-60]. Furthermore, formate ions (HCOO-), with a series of bands including, 1340 cm-1 (C—O, asymmetrical stretching) and 1576 cm-1 (C—H, asymmetrical stretching), and the band at 1340 cm-1 presented a strong negative going band at a potential between 0.2 V and 1 V vs. SCE [57,59]. In addition, the bands near the wavenumbers of 1750 cm-1 belong to the C—O stretching mode of formic acid, indicating formic acid product formed [60]. It is worth noting that in the HCOOH direct pathway of MOR, some adsorbed formic acid is easily desorbed and transferred to the solution to produce formic acid products (Fig. 4e) [61-64]. We analyzed the liquid phase products of MOR at the potential of 0.5 V by using the liquid-phase mass spectrometer, and the further analysis information is shown in Fig. S17 (Supporting information).
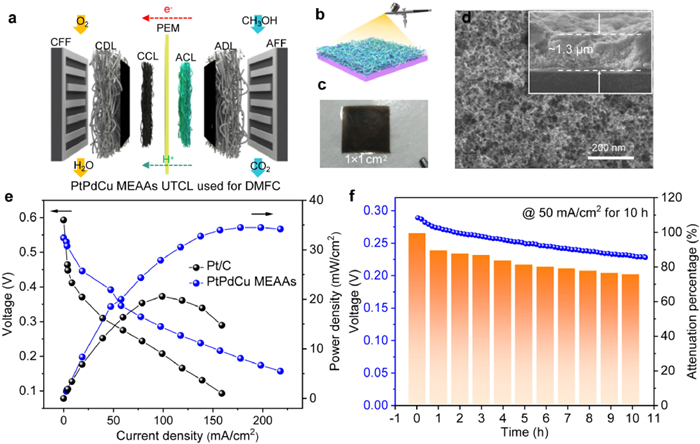
To further reveal the excellent electrocatalytic activity of the PtPdCu MEAAs catalysts as anode in real DMFC systems, control polarization curves and constant voltage durability measurements on PtPdCu MEAAs and commercial Pt/C served as anode catalysts were made in acidic DMFCs system, as proton exchange membrane is the core component of DMFCs, and the series of nafion membrane is the most widely used and the most mature one at present. The single-cell structure in DMFCs system is shown in Fig. 5a. The self-supporting PtPdCu MEAAs anode was fabricated by spraying without carbon support to construct the ultra-thin catalyst layer (UTCL) electrode, as illustrated in Fig. 5b. The thickness of UTCL could be facilely tuned by spray deposition. As observed in Fig. 5c, PtPdCu MEAAs UTCL can be handily attached onto the proton exchange membrane (PEM) without breakage, exhibiting its excellent mechanical rigidity and structural continuity and can facilitate electron transferring during electrochemical reaction. SEM image of the exterior surface was used to the morphological structure of PtPdCu MEAAs UTCLs (Fig. 5d). It displays a 3D-network-like nanoporous structures interconnected with each other and formed abundant open pores, showing a uniform morphology on the exterior surface to form a continuous film [65,66]. As the PtPd loading was 0.6 mg/cm2, the UTCL thickness was ~1.3 µm, as presented in the inset of Fig. 5d, leading to high quality UTCL electrodes. Fig. 5e displays the steady-state polarization and power density curves for the PtPdCu MEAAs catalysts with the PtPd loading of 2 mg/cm2 (4–5 µm thickness). A control electrode sample using commercial Pt/C catalysts with a higher noble Pt loading of 2 mg/cm2 (~40 µm) is also displayed for comparison. The maximum power densities of PtPdCu MEAAs as anode UTCL at 65 ℃ were 35 mW/cm2, which is 1.8 folds than that of the commercial Pt/C with 20 mW/cm2. Moreover, Fig. 5f presented an impressive stability of PtPdCu MEAAs electrode at a constant current of 50 mA/cm2 for 10 h, and the result voltage decreased by 24%. The less voltage loss may be causing by the methanol crossover from PEM to cathode. In all, the above test results in DMFC demonstrated an excellent newly developed anode catalysts due to its high intrinsic electrocatalytic performance facilitated by Pt 5d, Pd 4d, and Cu 3d orbitals coupling and self-supporting nanoporous structure for accelerating mass transportation inside the anode of DMFCs.
Figure 5
Figure 5.
(a) Schematic diagram of DMFC single cell with PtPdCu MEAAs UTCLs as anode. (b) The spraying process and (c) Digital photo of PtPdCu MEAAs UTCLs on PEM. (d) The representative SEM image for PtPdCu MEAAs UTCLs, inset show the cross-sectional SEM image. (e) Steady-state polarization curves for DMFC single cells employing PtPdCu MEAAs UTCLs and commercial Pt/C as anode, respectively. (f) The stability curves at 50 mA/cm2 for 10 h and the histogram of attenuation percentage. Test conditions: the flowing rate of 1 mol/L methanol was 2 mL/min and the flowing rate of O2 was 200 mL/min, temperature at 65 ℃.
In summary, PtPdCu MEAAs were successfully designed by one-step NaBH4-reduction strategy. DFT calculations reveal that the strong d-d orbital coupling between Pt 5d, Pd 4d and Cu 3d are contributed to elevate the Fermi level of PtPdCu MEAAs and thus reduce the reaction barrier of the key intermediates for achieving efficient high pH adaptability MOR electrocatalytic activity. Besides, PtPdCu MEAAs display excellent long-term durability after 3600 s for MOR under pH-general conditions. DFT calculation for the reaction full pathway spectrum and in-situ FTIR spectra analysis identified that PtPdCu MEAAs preferentially choose to take the HCOOH direct path and have the smaller the PDS value (0.28 eV), indicating that the adsorbed CHO* can be removed by the more easily activated H2O molecules. Furthermore, the self-supporting nanoporous anode equipped with the PtPdCu MEAAs catalyst at 2 mg/cm2 has a high peak power density of 35 mW/cm2, which is much higher than commercial Pt/C catalyst with the similar noble metal loading. This discovery provided a new insight on the relationship of electronic structure and MOR performance for DMFCs.
Declaration of competing interest
The authors declare no conflict of interest exists and state that the article is original, unpublished, and not being considered for publication elsewhere. All authors have participated sufficiently in this work to take public responsibility for it. All authors have reviewed the final version of the manuscript and approved it for publication.
CRediT authorship contribution statement
Kaili Wang: Data curation. Pengcheng Liu: Data curation. Mingzhe Wang: Conceptualization. Tianran Wei: Formal analysis. Jitao Lu: Data curation. Xingling Zhao: Data curation. Zaiyong Jiang: Investigation. Zhimin Yuan: Supervision. Xijun Liu: Supervision. Jia He: Conceptualization.
Acknowledgments
This work was financially supported by the National Natural Science Foundation of China (Nos. 52073214 and 22075211), Guangxi Natural Science Fund for Distinguished Young Scholars (No. 2024GXNSFFA010008), Natural Science Foundation of Shandong Province (Nos. ZR2023MB049 and ZR2021QB129), China Postdoctoral Science Foundation (No. 2020M670483), and Science Foundation of Weifang University (No. 2023BS11). This work was also supported by the open research fund of the Laboratory of Xinjiang Native Medicinal and Edible Plant Resources Chemistry at Kashi University. This research was supported by the Tianhe Qingsuo Open Research Fund of TSYS in 2022 and NSCC-TJ. We thank Dr. Jin Fengmin (School of Chemical Engineering and Technology, Tianjin University) for providing software of statistical particle size and size distribution of loaded nanoparticles in transmission electron microscope images and automatic positioning and analyzing of ultra-small nanoparticles on the zone axis in transmission electron microscope images. We also thank Nankai University Large-scale Instrument Experimental Technology R&D Project (No. 21NKSYJS09).
Supplementary materials
Supplementary material associated with this article can be found, in the online version, at doi:10.1016/j.cclet.2024.110532.
J. Yang, F. Zhang, J. Chen, China Powder Sci. Technol. 30 (2024) 161–170.
[66]
K. Chen, D. Ma, Y. Zhang, et al., Adv. Mater. 36 (2024) 2402160. doi: 10.1002/adma.202402160
Figure 1
(a) Schematic illustration atomic stacking and (b) the d−d orbitals coupling model of PtPdCu MEAAs. (c) Schematic illustration Ef of PdCu, PtCu and PtPdCu. The COHP analysis of (d) PtCu, (e) PdCu and (f) PtPdCu. PDOS plots of d-d orbitals coupling of (g) PtCu, (h) PdCu and (i) PtPdCu structures.
Figure 2
(a) Schematic illustration for preparing PtPdCu MEAAs networks by simple NaBH4 reduction method. (b) TEM image, inset shows the diameter size distribution presented in the inset. (c) HRTEM image, inset show the randomly selected magnified images. (d) STEM image and EDS elemental mapping images of Pt, Pd and Cu atoms, inset shows the STEM-EDS line-scanning profile. (e) XRD pattern of PtPdCu MEAAs. XPS spectras of (f) Pt 4f, (g) Pd 3d and (h) Cu 2p.
Figure 3
Electrocatalytic performance of commercial Pt/C, PtCu AAs, PdCu AAs and PtPdCu MEAAs catalysis under pH-general conditions: (a, e, i) CV curves, (b, f, j) MOR polarization curves. (c, g, k) Histograms of specific activity and mass activity of MOR. (d, h, m) CA curves at 0.5 V vs. SCE, −0.2 V vs. Hg/HgO and 0.4 V vs. SCE for 3600 s, respectively. The measurements were performed in (a-d) 0.1 mol/L HClO4 or 0.1 mol/L HClO4 + 1 mol/L methanol, (e-h) 1 mol/L KOH or 1 mol/L KOH + 1 mol/L methanol, and (i-m) 1 mol/L Na2SO4 or 1 mol/L Na2SO4 + 1 mol/L methanol, with scan rate of 50 mV/s, respectively.
Figure 4
DFT calculation and in-situ FTIR spectra analysis of the MOR mechanism on the PtPdCu MEAAs. The free-energy diagrams of reaction full pathway spectrum (HCOOH direct pathway and CO indirect pathway) for MOR over the surface of (a) PdCu AAs, (b) PtCu AAs and (c) PtPdCu MEAAs. (d) In-situ FTIR spectra for PtPdCu MEAAs catalysts and (e) schematic illustration of reaction pathway selectivity on PtPdCu MEAAs for MOR process.
Figure 5
(a) Schematic diagram of DMFC single cell with PtPdCu MEAAs UTCLs as anode. (b) The spraying process and (c) Digital photo of PtPdCu MEAAs UTCLs on PEM. (d) The representative SEM image for PtPdCu MEAAs UTCLs, inset show the cross-sectional SEM image. (e) Steady-state polarization curves for DMFC single cells employing PtPdCu MEAAs UTCLs and commercial Pt/C as anode, respectively. (f) The stability curves at 50 mA/cm2 for 10 h and the histogram of attenuation percentage. Test conditions: the flowing rate of 1 mol/L methanol was 2 mL/min and the flowing rate of O2 was 200 mL/min, temperature at 65 ℃.

 DownLoad:

 下载:
下载:


 下载:
下载:
