Scheme 1.
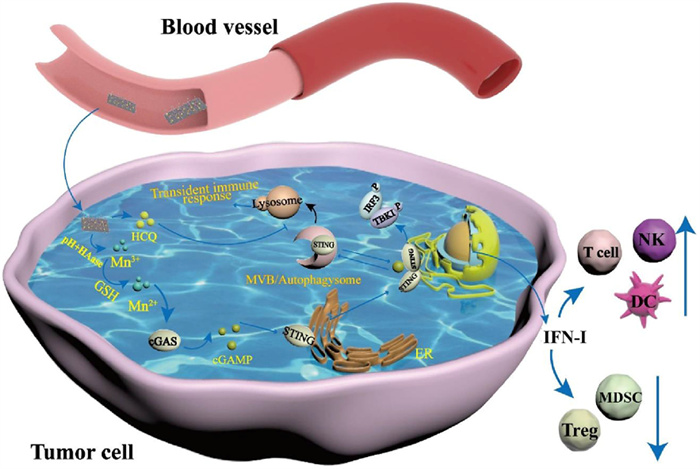
The enhancement mechanism of cGAS-STING pathway by HA/MnOOH@HCQ NDDS.
Manganese-based nano-delivery system for sensitized anti-tumor immunotherapy via combined autophagy inhibition
Huijuan Zhang , Chenglin Liang , Xinyi Ding , Meng Zhang , Siyu Lu , Lin Hou

Tumor immunotherapy mainly relies on activating the immune system in the body to stimulate anti-tumor responses, thereby inhibiting tumor progression and metastasis [1-3]. Studies have revealed that cyclic guanosine monophosphate (GMP)-adenosine monophosphate (AMP) synthase-stimulator of interferon genes (cGAS-STING) signaling pathway is an essential innate immune pathway of the organism [4-6]. When external antigens enter the body, cytoplasmic exogenous DNA or its double-stranded DNA (dsDNA) binds to cGAS and then generates the cyclic GMP-AMP (cGAMP) messenger, which binds to dimerized STING [7-9]. After that, the STING on the endoplasmic reticulum is translocated to the Golgi apparatus and ubiquitinated through the formation of autophagic vesicles [10, 11]. Then it will recruit and phosphorylate TANK-binding kinase 1 (TBK1), followed by the phosphorylation of interferon regulatory factor 3 (IRF3), and transcription and expression of the type I interferon (IFN-I) gene [12, 13].
Disappointingly, due to the tumor immunosuppressive microenvironment, the anti-tumor effect generated by activating the cGAS-STING pathway through tumor cells themselves is usually weak [14]. As a common STING agonist, Mn2+ can directly activate the cGAS-STING signaling pathway, to trigger a strong anti-tumor response by enhancing the host's immune recognition of tumor antigens [15-17]. However, similar to other agonists, the activated cGAS-STING signal is very transient because of the rapid degradation of the STING protein [18]. This inherent limitation greatly reduces the anti-tumor immune effect. Therefore, blocking STING degradation is the key to improving the efficiency of cGAS-STING pathway-mediated anti-tumor immunotherapy.
Studies demonstrate that STING is not only an immune signaling molecule but also a potential autophagy receptor [19]. Its structure contains classic light chain 3 (LC3)-interacting regions (LIRs), which can directly interact with LC3 [20]. Therefore, When Mn2+ activates the cGAS-STING pathway, it also causes upregulation of autophagy levels in tumor cells, which can degrade STING itself and negatively regulate the innate immune response [21]. Based on the above background, we proposed a new strategy of inhibiting autophagy to prolong the sustained STING signaling and enhance anti-tumor immunotherapy efficacy. Compared with 3D nanomaterials (such as nanoparticles and nanorods), nanocarriers with a 2D sheet-like structure have shown significant advantages in improving drug loading and cellular uptake capacities [22-24]. So, manganese oxide nanosheets with tumor microenvironment responsive degradation characteristics will become excellent carriers for delivering autophagy inhibitors.
Herein, we constructed a manganese-based nano drug delivery system (NDDS) for sensitized anti-tumor immunotherapy via combined autophagy inhibition. In this study, the manganese hydroxide nanosheets (MnOOH) were used as drug carriers. After modification with hyaluronic acid (HA) and loading autophagy inhibitor hydroxychloroquine (HCQ), HA/MnOOH@HCQ NDDS was prepared. HA/MnOOH@HCQ can be uptake by tumor cells via the CD44 receptor-mediated endocytosis. In the acidic and HA enzyme (HAase)-rich intracellular microenvironment, HA/MnOOH@HCQ disintegrated to release Mn3+ and HCQ. Mn3+ can react with high concentrations of glutathione (GSH) to generate Mn2+. Subsequently, Mn2+ can bind to cGAS in tumor cells, thereby activating the cGAS-STING pathway and generating IFN-I. Meanwhile, HCQ can downregulate the autophagy level caused by the cGAS-STING pathway, further enhancing the cGAS-STING signal (Scheme 1). Overall, HA/MnOOH@HCQ with the above synergistic mechanism can better exert anti-tumor immunotherapy effects.
As shown in Fig. 1a, MnOOH nanosheets were successfully synthesized using the ionic liquid/water interface as a soft template. Subsequently, HA was modified on the surface of MnOOH to improve its water solubility and endow it with tumor-targeting ability. Finally, the autophagy inhibitor HCQ was loaded onto HA/MnOOH through hydrophobic interactions to form HA/MnOOH@HCQ NDDS. The transmission electron microscopy (TEM) images exhibited an irregular thin film-like and partially folded structure of MnOOH and HA/MnOOH nanosheets. After HA modification, the diameter and thickness of nanosheets dispersed by high-power probe ultrasound were greatly reduced from ~800 nm to ~200 nm and 2.04 nm to 1.55 nm, respectively (Figs. 1b and c). Moreover, the element mapping in Fig. 1d showed that MnOOH was mainly composed of Mn and O, while HA/MnOOH contained Mn, O, and N (Fig. S1 in Supporting information), further confirming the successful modification of HA. Additionally, the typical peaks of Mn 2p in the X-ray photoelectron spectroscopy (XPS) spectrum with binding energies of 641.8 and 653.6 eV were attributed to Mn 2p3/2 and Mn 2p1/2, respectively, which implied that Mn in MnOOH nanosheets was mainly present in the chemical state of Mn3+ (Fig. 1e and Fig. S2a in Supporting information). The other two peaks of O 1s with binding energies of 531.3 and 530.1 eV corresponded to the surface OH of H2O and lattice oxygen of MnOOH, respectively (Fig. 1e and Fig. S2b in Supporting information). Next, MnOOH powder was scanned using X-ray diffraction (XRD) analysis and the characteristic peak at 34.8° fit perfectly with the standard card for MnOOH. The peak at 19.2° disappeared, indicating a material with a monolayer lamellar structure (Fig. 1f). The characteristic Fourier transform infrared (FT-IR) peaks of MnOOH (Fig. 1g) at 2924 and 1073 cm−1 were attributed to the stretching and bending vibrations of -OH groups, respectively, while the peak at 623 cm−1 belonged to the vibration of Mn-O bonds. For HA/MnOOH spectrum, in addition to the above-mentioned characteristic peaks of MnOOH, the typical peaks of carboxyl groups in HA also appeared. It was worth noting that after being grafted on MnOOH, the absorption peaks of carboxyl groups in HA shifted from 1421 and 1632 cm−1 to 1362 and 1595 cm−1, respectively, which proved the successful complexation of Mn with carboxyl groups in HA via the monodentate coordination mode. Fig. S3 (Supporting information) intuitively demonstrated the significantly improved stability of MnOOH nanosheets after HA modification within 24 h.
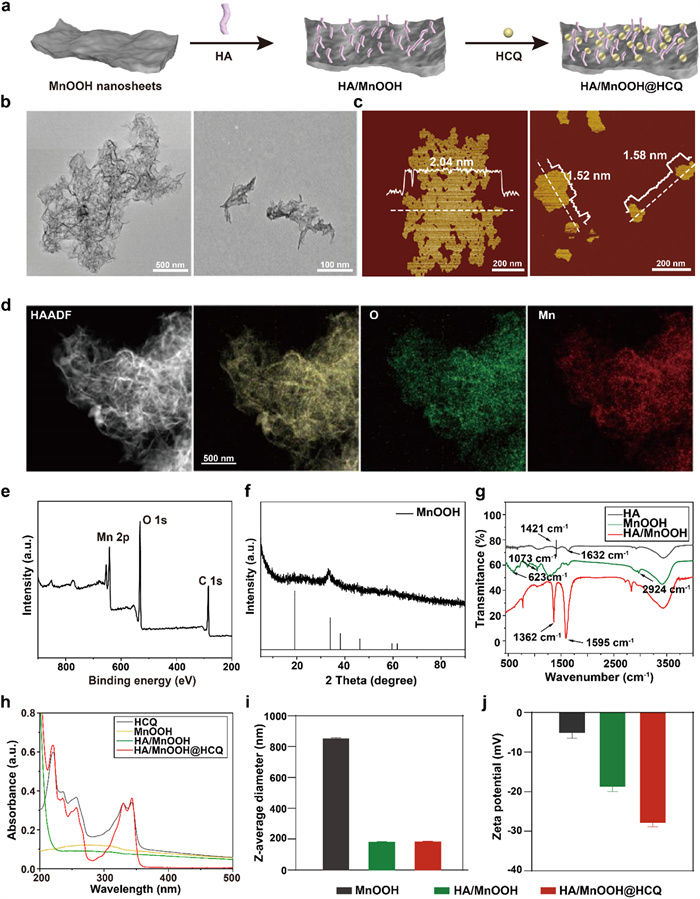
After HA/MnOOH synthesis, HCQ was loaded onto HA/MnOOH nanosheets by hydrophobic interaction. The ultraviolet–visible spectroscopy (UV–vis) spectra of HCQ, MnOOH, HA/MnOOH and HA/MnOOH@HCQ were shown in Fig. 1h. No significant absorption peak was observed for MnOOH, while the terminal absorption peak at ~200 nm appeared for HA/MnOOH, demonstrating the successful modification of HA. After HCQ loading, the spectrum of HA/MnOOH@HCQ showed characteristic absorption peaks of HCQ at 221 and 343 nm, confirming the successful loading of drugs. By measuring the absorbance at 343 nm, the drug loading and encapsulation rates were calculated as 52.3% and 36.5%, respectively. Dynamic light scattering (DLS) results in Figs. 1i and j showed a relatively large hydrated particle size of MnOOH (855.7 nm) with a zeta potential of −5.12 mV. After HA modification and HCQ loading, the average hydrated particle size and zeta potential of HA/MnOOH@HCQ changed to 180.11 nm and −27.89 mV, respectively. The decreased size and increased potential were more conducive to tumor accumulation and in vivo stability.
Then, we simulated different physiological microenvironments in vitro to investigate the release behaviors of HCQ and Mn ions from HA/MnOOH@HCQ. As shown in Fig. S4a (Supporting information), the release curves of HCQ exhibited a typical acid- and HAase-dependent manner. The cumulative drug release percentage in the medium of pH 5 (72.90%) was significantly higher than that of pH 6.8 (13.52%) and pH 7.4 (8.06%). Moreover, the presence of HAase will further accelerate HCQ release. Summary, the cumulative drug release percentages of HCQ were 89.48%, 19.36%, and 8.06% in simulated intracellular acidic endosomes (pH 5.0 + HAase), tumor microenvironment (TME, pH 6.8 + HAase), and blood (pH 7.4), respectively at 24 h. This suggested that HA/MnOOH@HCQ can maintain stability during drug delivery, drugs can only be rapidly released upon reaching tumor cells, exerting targeted anti-tumor effects. Additionally, the in vitro release of Mn ions exhibited the same trend as shown in Fig. S4b (Supporting information). The cumulative release percentage of Mn ions was as high as 86.5% after incubation for 24 h in simulated intracellular acidic endosomes medium (pH 5.0 + HAase), indicating the synchronous release behavior of HCQ and Mn ions from HA/MnOOH@HCQ.
As we know, tumor cells own a highly reducing internal microenvironment with abundant GSH, which can reduce Mn ion to Mn2+. Therefore, we further verified the valence state of released Mn ions in the presence of GSH. After incubation in the medium (pH 5.0 + HAase + 10 mmol/L GSH) for 12 h, the Mn ions released from HA/MnOOH were analyzed using XPS. As exhibited in Fig. S5 (Supporting information), binding energies of 640.78 and 652.48 eV were attributed to Mn 2p3/2 and Mn 2p1/2 of Mn2+, respectively, implying that Mn ions released from HA/MnOOH nanosheets existed mainly in the chemical state of Mn2+. When Mn ions are reduced to Mn2+, GSH is consumed. So, by measuring the changes in UV–vis absorption peaks of TNB (the reaction product of DTNB and remaining GSH in the release medium), we can further validate the reduction mechanism of Mn ions within tumor cells. As shown in Fig. S6 (Supporting information), with the increase of HA/MnOOH concentration, the absorbance of TNB at 412 nm decreased significantly, suggesting more GSH was consumed. This result confirmed that in the tumor cells, Mn ions released from HA/MnOOH can be rapidly reduced to Mn2+ under the high level of GSH.
Moreover, the morphology change of HA/MnOOH nanosheets was monitored by TEM (Fig. S7 in Supporting information). In the medium of pH 7.4, pH 6.8, and pH 6.8 + HAase, the shape of HA/MnOOH nanosheets changed slightly but still maintained a thin sheet-like morphology. However, in a medium of pH 5.0, the nanosheets undergo significant disintegration and almost no complete sheets can be seen. There were only some irregular morphologies due to the conjugation of HA polysaccharides. Interestingly, in the medium of pH 5.0 + HAase, the nanosheets completely disintegrated with a nearly transparent color (Fig. S8 in Supporting information). Because the HAase exhibited maximum activity in acidic endosomes/lysosomes, which can digest the HA layer into small fragments. All the above results proved that HA/MnOOH@HCQ nanosheets can be completely decomposed and simultaneously released HCQ and Mn2+ in tumor cells, exerting a synergistic anti-tumor effect.
Subsequently, we investigated the in vitro uptake and immune response of HA/MnOOH@HCQ. The cellular uptake capacity of HA/MnOOH with similar particle sizes but different shapes were compared by laser confocal microscope (LSCM) and flow cytometer. As Fig. S9 (Supporting information) demonstrated, compared with nanoparticles and nanorods, HA/MnOOH nanosheets have significant advantages in cellular uptake ability and can be engulfed by 4T1 tumor cells more quickly and efficiently. Additionally, HA modification can further increase the uptake of MnOOH nanosheets (Figs. 2a and b). Moreover, flow cytometry results indicated that the cellular uptake behavior of HA/MnOOH nanosheets exhibited a time-dependent manner (Fig. 2c). As proved in vitro, HA/MnOOH can degrade and release Mn2+ in the mimetic acidic endosome microenvironment. So, we measured the content of Mn2+ in tumor cells after co-incubation with MnOOH and HA/MnOOH. Inductively coupled plasma-mass spectrometry (ICP-MS) analysis data exhibited that compared with the phosphate buffer saline (PBS) control group, the intracellular Mn2+ content of MnOOH and HA/MnOOH groups increased by 8.27 and 21.34 times, respectively (Fig. 2d). This confirmed that HA/MnOOH nanosheets can deliver more Mn2+ into 4T1 tumor cells than MnOOH. Figs. 2e and f further revealed that after entering the cell, HA/MnOOH first located in lysosomes and then gradually escaped from lysosomes over time, exerting anti-tumor effects.
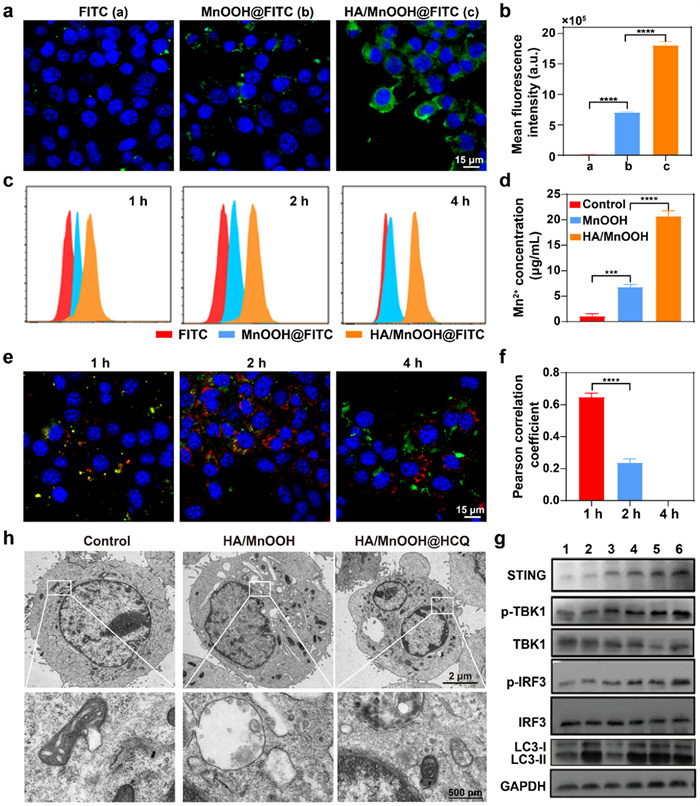
Next, in vitro immune response effects of HA/MnOOH@HCQ were studied. Firstly, we explored the concentrations of Mn2+ and HCQ that can produce the best synergistic effect. As shown in Fig. S10 (Supporting information), when tumor cells were treated with 0.2 mmol/L Mn2+ + 10 µmol/L HCQ, the expression levels of the cGAS-STING pathway and autophagy-related proteins were all the highest, so 10 µmol/L HCQ was chosen in the later experiments. Subsequently, we evaluated the expression of p-TBKI, p-IRF3, STING, and the ratio of LC3-II/LC3-I proteins in 4T1 tumor cells after treatment with different formulations. Fig. 2g and Fig. S11 (Supporting information) revealed that the expression levels of cGAS-STING pathway (p-TBKI, p-IRF3, STING) and autophagy-related proteins (LC3-II/LC3-I) in HA/MnOOH@HCQ group were all higher than that of HCQ, Mn2+, HCQ + Mn2+ and HA/MnOOH groups, suggesting that the cGAS-STING activation and autophagy inhibition effects of HA/MnOOH@HCQ were the strongest. TEM images in Fig. 2h further revealed that there were significantly increased autophagosomes or autolysosomes in the cells treated with HA/MnOOH or HA/MnOOH@HCQ which suggested an enhancement in autophagy levels. In addition, the HA/MnOOH group showed more autolysosomes with a single layer, while HA/MnOOH@HCQ group exhibited more double-layered autophagosomes. This was because the destructive effect of HCQ on lysosomes hindered the fusion of autophagosomes and lysosomes (Fig. S12 in Supporting information). As we know, STING protein can only be degraded in autolysosomes, so HA/MnOOH@HCQ can enhance the expression of cGAS-STING signaling proteins while inhibiting their degradation through co-delivery of Mn2+ and HCQ, synergistically exerting immune activation effects.
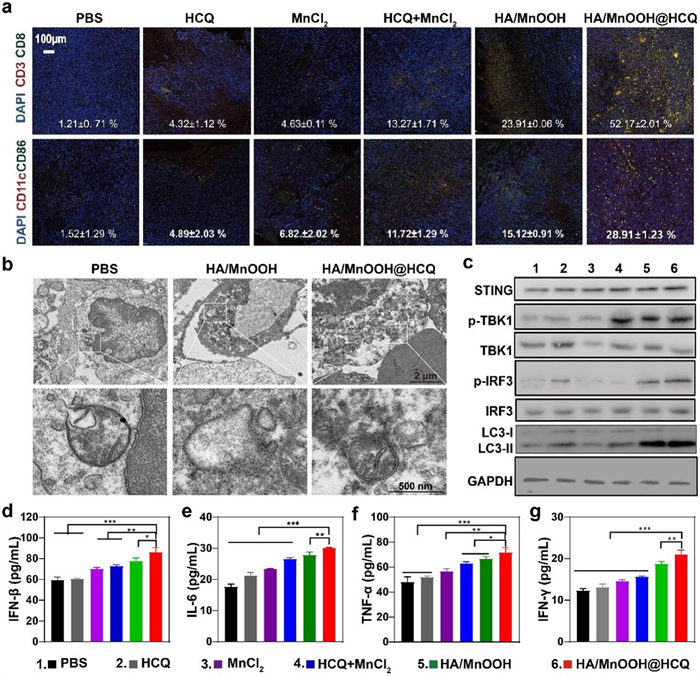
Encouraged by the in vitro positive immune response, we further explored the synergistic immune activation effect of HA/MnOOH@HCQ on the 4T1 tumor-bearing mice model. All animal experiments were approved by the Animal Ethics Committee of Zhengzhou University. The immunofluorescence staining results visually showed that the infiltration of CD8+ T cell and dendritic cell (DC) in HA/MnOOH@HCQ treated tumor tissues was significantly higher than that in other groups, indicating that after HA/MnOOH@HCQ nanosheets enter the body, they can recruit more immune cells to infiltrate the tumor site (Fig. 3a). In addition, the autophagy level of tumor tissues was observed by biological TEM (Fig. 3b). Compared with PBS control group, the number of autolysosomes with a single-layer membrane structure significantly increased in HA/MnOOH group, suggested that HA/MnOOH can upregulate autophagy levels while activating cGAS-STING signaling pathway. However, more autophagosomes with bilayer membrane structure appeared in the tumor tissue treated with HA/MnOOH@HCQ, which could effectively inhibit the degradation of STING protein. Western blot results further demonstrated the upregulated expression of cGAS-STING pathway-related proteins (STING, p-TBKI, p-IRF3) and autophagy-related LC protein in HA/MnOOH@HCQ treated tumor tissues (Fig. 3c). This indicated that HA/MnOOH@HCQ could effectively generate Mn2+ in tumor tissues to activate the cGAS-STING signaling pathway as well as inhibit autophagy induced by cGAS-STING pathway, thus exerting a synergistic effect. After the cGAS-STING signaling pathway was activated, tumor cells secreted IFN-β, which would recruit T cells (such as CD4+ and CD8+ T cells), DCs, and natural killer (NK) cells to produce interferon-γ (IFN-γ), tumor necrosis factor-α (TNF-α), and interleukin-6 (IL-6), respectively. So next, we measured the concentrations of these four immune factors in tumor tissues using the Elisa method. As shown in Figs. 3d–g, the levels of IFN-β, IL-6, TNF-α, and IFN-γ in the HA/MnOOH@HCQ group significantly increased, indicating that HA/MnOOH@HCQ still had good immune effects in mice and can efficiently improve the immunosuppressive TME.
To investigate the tumor-targeting ability of HA/MnOOH@HCQ nanosheets, FX in vivo imaging system was used to observe the real-time distribution of HA/MnOOH@IR780 in tumor-bearing mice. As shown in Fig. S13 (Supporting information), loading IR780 onto MnOOH or HA/MnOOH nanosheets can significantly increase the accumulation and retention time of IR780 in tumor tissues. Additionally, MnOOH@IR780 distributed more in lung tissues, while HA/MnOOH@IR780 exhibited concentrated accumulation in tumor tissues. This was because the modification of HA can reduce the size of MnOOH and endow MnOOH with active tumor-targeting function, which was very beneficial for the distribution of NDDS in tumor-target tissues.
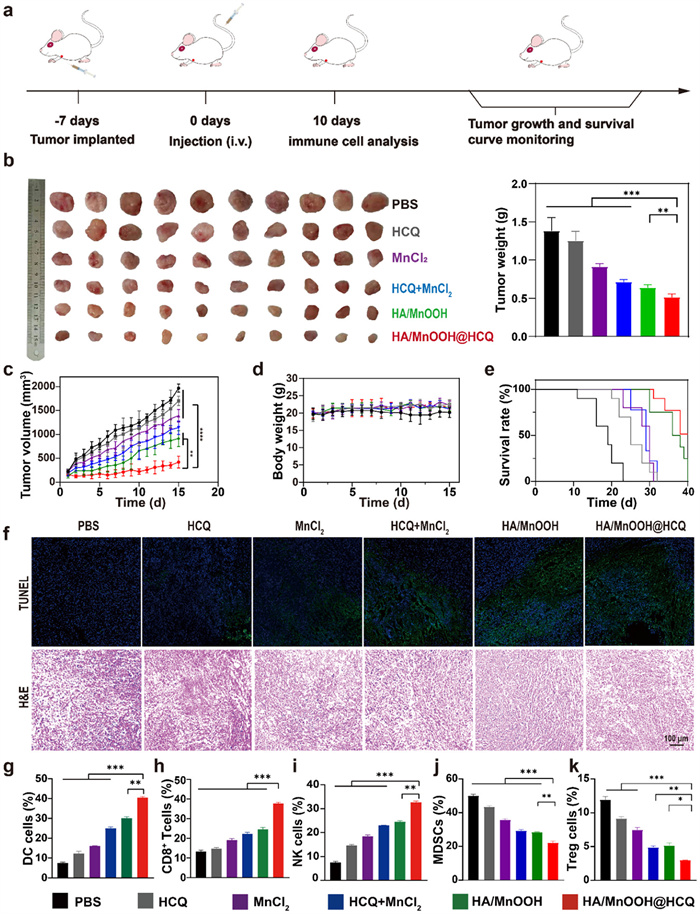
Encouraged by its excellent tumor-targeting ability, we further evaluated the anti-tumor efficacy of HA/MnOOH@HCQ on 4T1 tumor-bearing mice followed by the experimental protocol exhibited in Fig. 4a. Figs. 4b and c showed that compared with the other groups, HA/MnOOH@HCQ demonstrated the best anti-tumor effect with the smallest tumor weight and volume after treatment. Meanwhile, mice in the HA/MnOOH@HCQ treatment group showed no obvious change in body weight, while their survival period was significantly prolonged from 18 (PBS group) to 46 days (Figs. 4d and e). Moreover, terminal deoxynucleotidyl transferase-mediated dUTP-biotin nick end labeling (TUNEL) and hematoxylin and eosin (H & E) staining was carried out to detect apoptosis and necrosis of tumor tissues (Fig. 4f). The tumor tissues in PBS and HCQ groups showed distinct staining and intact nuclei, while MnCl2, HCQ + MnCl2, and HA/MnOOH groups exhibited varying degrees of nuclear shrinkage and cell necrosis. It was worth noting that massive shrinking and dissolved cell nuclei were observed in the HA/MnOOH@HCQ group, suggesting the best antitumor effect. Next, the immune cells in tumor tissue after treatment were measured by flow cytometry. The results in Figs. 4g–k and Figs. S14 and S15 (Supporting information) exhibited that after treatment with HA/MnOOH@HCQ, the number of anti-tumor immune cells (CD8+ T, DC, and NK cells) in tumor tissue significantly increased, while the number of immunosuppressive cells (myeloid-derived suppressor cells (MDSCs) and regulatory T (Treg) cells) significantly decreased. This indicated that HA/MnOOH@HCQ could improve the immunosuppressive TME and promote immune cell infiltration, to exert anti-tumor immunotherapy effects [25, 26]. Furthermore, on the 21st day of treatment, we dissected lung tissues and performed Bouin staining to analyze the inhibitory effect of HA/MnOOH@HCQ on lung metastasis. As exhibited in Fig. S16 (Supporting information), no lung metastasis was observed in the HA/MnOOH@HCQ group, proving that HA/MnOOH@HCQ had a good inhibitory effect on lung metastasis.
Finally, the biosafety of HA/MnOOH@HCQ was evaluated. H & E staining results exhibited no obvious histological lesions in the dissected heart, liver, spleen, lung, and kidney tissues (Fig. S17 in Supporting information), indicating relatively low organ toxicity. In addition, the liver and kidney function, as well as the total protein in the blood were measured. As shown in Fig. S18 (Supporting information), all indexes were within the normal range, indicating excellent biosafety of HA/MnOOH@HCQ for in vivo use.
In summary, manganese-based HA/MnOOH@HCQ nanosheets were successfully synthesized for anti-tumor immunotherapy. HA/MnOOH@HCQ exhibited excellent stability under physiological conditions. It can simultaneously release Mn2+ and HCQ in response to tumor microenvironment. On the one hand, Mn2+ can bind to cGAS in tumor cells, then activate the cGAS-STING pathway and generate IFN-I. On the other hand, HCQ can downregulate the autophagy level caused by the cGAS-STING pathway, further enhancing the cGAS-STING signal. Both in vivo and in vitro experiments proved that HA/MnOOH@HCQ had strong immunotherapeutic effects with relatively low toxicity.
The authors declare that they have no known competing financial interests or personal relationships that could have appeared to influence the work reported in this paper.
Huijuan Zhang: Writing – original draft, Project administration, Funding acquisition. Chenglin Liang: Software, Methodology, Formal analysis. Xinyi Ding: Visualization, Data curation. Meng Zhang: Validation, Methodology. Siyu Lu: Supervision, Resources, Investigation. Lin Hou: Writing – review & editing, Project administration, Funding acquisition, Conceptualization.
This research was supported by the National Natural Science Foundation of China (Nos. 82172719, 82102918), and Joint Funds of Henan Province Foundation for Science and Technology (No. 232301420011).
Supplementary material associated with this article can be found, in the online version, at doi:
Y. Zhou, J. Yuan, K. Xu, et al., ACS Nano 18 (2024) 1846–1864. doi: 10.1021/acsnano.3c11260
E. Chin, A. Sulpizio, L. Lairson, Trends Cell Biol. 33 (2023) 189–203.
Y. Huang, H. Fan, H. Ti, Asian J. Pharm. Sci. 19 (2024) 100902.
X. Wang, Y. Liu, C. Xue, et al., Nat. Commun. 13 (2022) 5685.
L. Liu, H. Lei, G. Hou, et al., ACS Nano 18 (2024) 12830–12844. doi: 10.1021/acsnano.4c00017
J. Yang, Y. He, M. Zhang, et al., Exploration 3 (2023) 20230061.
B. Zhao, P. Xu, C. Shu, et al., Nature 569 (2019) 718–722. doi: 10.1038/s41586-019-1228-x
N. Samson, A. Ablasser, Nat. Cancer 3 (2022) 1452–1463. doi: 10.1038/s43018-022-00468-w
S. Liang, J. Yao, D. Liu, et al., Chin. Chem. Lett. 36 (2025) 109856. doi: 10.1016/j.cclet.2024.109856
R. Zhang, R. Kang, D. Tang, Sig. Transduct, Target. Ther. 6 (2021) 208.
K. Hopfner, V. Hornung, Nat. Rev. Mol. Cell Biol. 21 (2020) 501–521. doi: 10.1038/s41580-020-0244-x
L. Ou, Y. Cheng, Y. Chen, Front. Immunol. 12 (2021) 759048.
H. Yang, S. Yang, Q. Guo, et al., Adv. Mater. 36 (2024) e2310189.
X. Liu, F. Chen, M. Saeed, et al., Nano Today 56 (2024) 102273.
M. Lv, R. Zhang, W. Zhang, et al., Cell Res. 30 (2020) 966–979. doi: 10.1038/s41422-020-00395-4
W. Qiao, J. Chen, H. Zhou, et al., Adv. Sci. 11 (2024) e2305979.
D. Chen, L. Hou, Y. Yan, et al., ACS Nano 14 (2020) 3927–3940. doi: 10.1093/bioinformatics/btaa205
M. Pan, Y. Yin, T. Hu, et al., Autophagy 19 (2022) 440–456.
Y Wang, Ramos M, M. Jefferson, et al., Sci. Adv. 8 (2022) eabn3298.
D. Liu, H. Wu, C. Wang, et al., Cell Death Differ. 26 (2018) 1735–1749.
X. Gui, H. Yang, T. Li, et al., Nature 567 (2019) 262–266. doi: 10.1038/s41586-019-1006-9
H. Zhang, L. Zhang, Z. Cao, et al., Small 18 (2022) e2200299.
W. Chen, J. Ouyang, H. Liu, et al., Adv. Mater. 29 (2016) 1603864.
L. Gao, Y. Song, J. Zhong, et al., ACS Biomater. Sci. Eng. 8 (2022) 1074–1086. doi: 10.1021/acsbiomaterials.1c01430
Y. Wu, Z. Zhang, Y. Wei, et al., Chin. Chem. Lett. 34 (2023) 108098.
P. Sun, Z. Li, D. Zhang, et al., Chin. Chem. Lett. 35 (2024) 108346.

Figure 1 (a) Schematic diagram of HA/MnOOH@HCQ synthesis. (b) TEM images of MnOOH (left, scale bar: 500 nm) and HA/MnOOH (right, scale bar: 100 nm). (c) Atomic force microscope (AFM) images of MnOOH (left) and HA/MnOOH (right), scale bar: 200 nm. (d) The element mapping of MnOOH measured by X-ray diffraction, scale bar: 500 nm. (e) XPS analysis spectrum of MnOOH. (f) XRD analysis result of MnOOH. (g) FT-IR spectra of HA, MnOOH and HA/MnOOH. (h) UV–vis spectra of HCQ, MnOOH, HA/MnOOH, and HA/MnOOH@HCQ. (i) The particle size of MnOOH, HA/MnOOH, and HA/MnOOH@HCQ nanosheets. (j) The zeta potential of MnOOH, HA/MnOOH, and HA/MnOOH@HCQ. Data are presented as mean ± standard deviation (SD) (n = 3).

Figure 2 (a) LSCM images of 4T1 cells incubated with different formulations. Cell nuclei was stained with 4′, 6-diamidino-2-phenylindole (DAPI) (blue fluorescence). Formulations were labeled with fluorescein isothiocyanate (FITC) (green fluorescence), scale bar: 15 µm. (b) Quantitative analysis of intracellular FITC fluorescence intensity in (a). (c) Flow cytometry analysis of 4T1 cells incubated with different agents for 1, 2 and 4 h. (d) ICP-MS analysis of intracellular Mn2+ content. (e) The biodistribution of HA@MnOOH@FITC in endo/lysosomes for different times. Cell nuclei were stained with DAPI (blue fluorescence). Lysosome was stained with lysosomal red fluorescence probe (red fluorescence), scale bar: 15 µm. (f) Pearson correlation coefficient in (e). (g) The expression levels of cGAS-STING-related and autophagy-related proteins in 4T1 cells incubated with different formulations. 1. PBS; 2. HCQ; 3. MnCl2; 4. MnCl2 + HCQ; 5. HA/MnOOH; 6. HA/MnOOH@HCQ. (h) Autophagy levels in 4T1 tumor cells treated with different formulations by TEM (up, scale bar: 2 µm; down, scale bar: 500 nm). GAPDH, glyceraldehyde-3-phosphate dehydrogenase. Data are presented as mean ± SD (n = 3). ***P < 0.001, ****P < 0.0001.

Figure 3 (a) Immunofluorescence analysis of tumor tissue sections, scale bar: 100 µm. (b) The autophagosomes and autolysosomes in tumor tissues observed by TEM (up, scale bar: 2 µm; down, scale bar: 500 nm). (c) The expression levels of cGAS-STING-related (STING, TBKI, IRF3) and autophagy-related proteins (LC3-II and LC3-I) in 4T1 cells incubated with PBS, HCQ, MnCl2, MnCl2 + HCQ, HA/MnOOH and HA/MnOOH@HCQ. (d–g) The levels of IFN-β, IL-6, TNF-α, IFN-γ in tumor tissues. Data are presented as mean ± SD (n = 3). P < 0.05, **P < 0.01, ***P < 0.001.

Figure 4 (a) The experimental protocol of pharmacodynamic experiments. (b) The images and weight of tumor tissues in different groups. (c) Tumor volume growth curve of mice. (d) Body weight change of mice. (e) Survival curve of tumor-bearing mice. (f) TUNEL and H & E staining results of tumor tissues, scale bar: 100 µm. (g–k) Proportions of immune cells (CD8+ T, DC, and NK cells), and immunosuppressive cells (MDSCs and Tregs cells) in tumor tissues. Data are presented as mean ± SD (n = 10). *P < 0.05, **P < 0.01, ***P < 0.001, ****P < 0.0001.

 扫一扫看文章

扫一扫关注我们
 DownLoad:

 下载:
下载:
 下载:
下载: