Figure 1.
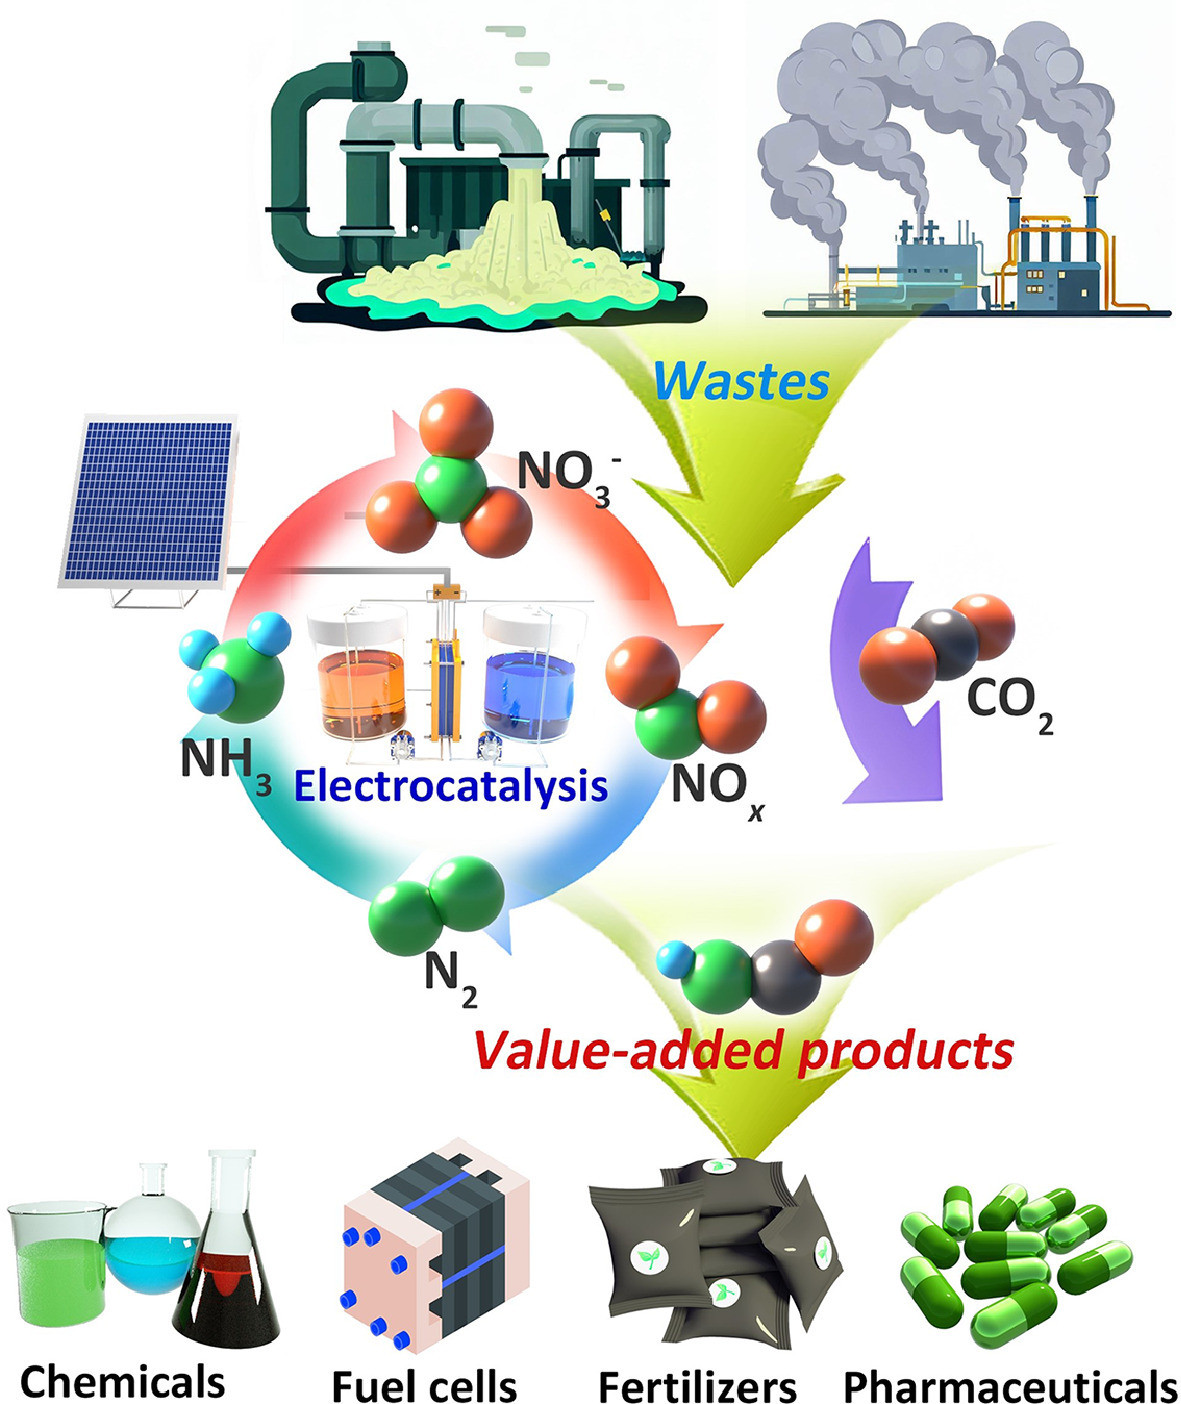
Conceptual overview of nitrogenous waste conversion for value-added products and energy production.
Advanced characterization techniques for understanding electrocatalytic behavior of oxidized nitrogen waste upcycling processes
Zhaoyu Jin , Renjun Guan , Xin Li , Dunyi Yuan , Panpan Li

Nitrogenous waste emissions have become a serious environmental and health concern, with well-documented adverse effects on human health, the atmosphere, and water quality. Excessive nitrogen compounds, such as nitrate (NO3−), nitrite (NO2−), and nitrogen oxides (NOx), contribute to water and soil pollution, greenhouse gas emissions, ozone layer depletion, and negative impacts on agricultural production [1-5]. These emissions also pose health hazards, including respiratory diseases, cardiovascular diseases, and various cancers [6, 7]. The urgent need for efficient and sustainable upcycling strategies arises from the environmental and health impacts caused by nitrogenous waste emissions. Efficient upcycling involves converting waste into higher-value products or energy, reducing the environmental footprint and creating economic benefits [8, 9]. Sustainable upcycling strategies prioritize the use of renewable resources and minimize the generation of secondary pollutants. Upcycling strategies aim to convert waste nitrogen compounds into valuable resources such as energy, fertilizers, or precursors for chemical synthesis [10, 11]. Furthermore, these strategies with high sustainability can encourage the development of circular economies, as well as help to reduce the amount of waste sent to landfills and incinerators, while creating additional value from previously discarded materials [12, 13].
Electrocatalysis has shown promise as efficient and sustainable solutions for waste management [14-21]. These technologies utilize electrocatalysts to convert waste nitrogen compounds into valuable products through electrochemical reactions (Fig. 1). However, there are several challenges that need to be overcome to achieve efficient and sustainable upcycling of nitrogenous waste, where identifying suitable electrocatalysts that exhibit high activity and stability is crucial for the rate and efficiency of the electrochemical reactions [22-26]. Besides, understanding the reaction mechanisms and regulating reaction pathways are also essential to achieve maximum conversion and valuable product yield with minimum power consumption. The reaction mechanisms involve a series of complex processes that occur during the conversion of waste nitrogen compounds into valuable products [15, 27-30]. Thus, the mechanistic study allows for the identification of key reaction intermediates and the optimization of reaction conditions. Emerging in situ/operando characterization techniques, such as X-ray absorption spectroscopy, Raman spectroscopy, infrared spectroscopy, and scanning probe microscopy, provide insights into the structural, electronic, and chemical properties of electrocatalysts during the electrochemical reactions, enabling a better understanding of the reaction mechanisms and optimization of reaction conditions [31, 32].
This comprehensive review focuses on the research progress of electrocatalytic oxidized nitrogen waste upgrading and utilization. It highlights the application of advanced in situ/operando characterization techniques, which play a crucial role in understanding the processes, including nitrate/nitrite/nitric oxide reduction as well as carbon dioxide (CO2) and NOx co-reduction reactions. By using these cutting-edge techniques, researchers can monitor electrocatalytic reactions in real-time, gaining valuable insights into reaction mechanisms and facilitating catalyst design. These insights address the challenges associated with nitrogenous waste management. The article also provides a forward-looking perspective, exploring future research directions and development trends, which could serve as a valuable guide for the development of sustainable electrocatalytic technologies for environmental restoration and resource recovery.
As presented in Fig. 2, the utilization of nitrogen oxyanions (NO3− and NO2−) has great potential in mitigating pollution in various types of wastewaters, including those originating from agriculture, domestic sewage, and industrial activities [33-35]. However, this process is highly complex and can occur through direct or indirect pathways [36, 37]. In the direct pathway, nitrate anions are adsorbed onto the cathode surface, followed by multiple proton-coupled electron transfer steps. The reduction of nitrate to nitrite is the rate-determining step in this pathway. Throughout the reaction, significant intermediates, such as nitrite, nitric oxide bound to the surface (NOad), nitrous acid, and hydroxylamine, are formed. The selectivity between dinitrogen gas (N2) and ammonia/ammonium (NH3/NH4+) as end products is determined by the reduction of NOad. Achieving the reduction to N2 requires overcoming high kinetic barriers associated with breaking strong N-O bonds and forming new N-N bonds. Mechanistically, two pathways for N2 formation have been identified: the Vooys-Koper mechanism involving the HN2O2 intermediate, and the Duca-Feliu-Koper mechanism involving NH2 and N-nitrosamide intermediates. In contrast, the reduction of NOad to NH3/NH4+ is more favorable in terms of kinetics. The addition of chloride anions to the system enhances the selectivity for N2 by facilitating the oxidation of ammonium back to dinitrogen gas. On the other hand, the indirect autocatalytic pathway does not involve the direct participation of nitrate or nitrite species in the electron transfer steps. Instead, autocatalytic cycles utilize nitric oxide radicals (NO2•) or nitrosonium cations (NO+) as electroactive species that can regenerate themselves while converting other species into products [15, 38]. This mechanism primarily operates under high initial nitrate concentrations and very acidic conditions. A comprehensive understanding of and control over the pathways involved in electrocatalytic nitrate/nitrite reduction offer promising strategies for the development of efficient and selective nitrogenous wastewater utilization technologies. By optimizing catalyst properties and reaction conditions, the selectivity of the process can be tailored towards ammonia, thereby providing a sustainable solution for the treatment of nitrate/nitrite waste and contributing to the circular economy. This approach not only addresses pollution but also offers an environmentally friendly and energy-efficient alternative to conventional ammonia synthesis methods.
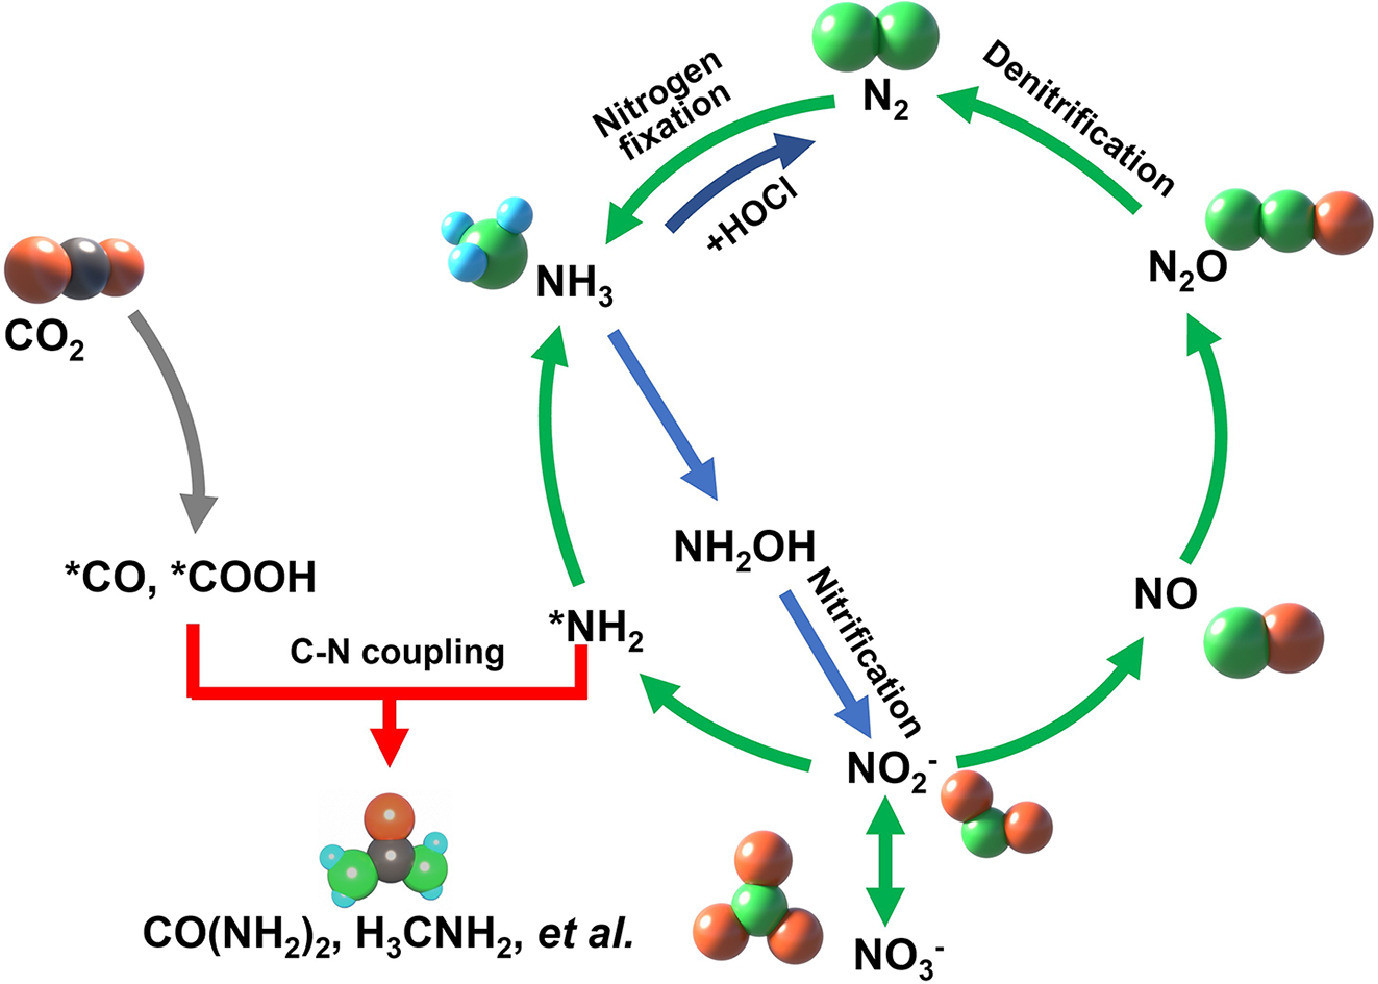
In addition, the electrocatalytic reduction of nitric oxide (NO), a toxic and greenhouse gas, to ammonia can occur through various reaction routes, influenced by the adsorption patterns of NO molecules on the catalyst surface [39, 40]. These routes include N-end, O-end, and side-on configurations. The mechanism of this reduction process can be classified as either dissociative or associative [41, 42]. In the dissociative mechanism, the N-O bond of NO is initially broken on the active site of the catalyst, resulting in the formation of *N and *O species. These species are subsequently hydrogenated separately. On the other hand, the associative mechanism involves the hydrogenation of adsorbed NO molecules, forming HxNOHy intermediates, which undergo stepwise hydrogenation to yield NH3 and H2O. During the electrochemical conversion of NO to NH3, the hydrogenation of the adsorbed species can proceed through two different routes: the Tafel-type route and the Heyrovsky-type route. In the Tafel-type route, solvated protons adsorb on the catalyst surface, generating adsorbed *H species. These species then participate in surface hydrogenation reactions. Conversely, the Heyrovsky-type route involves the direct hydrogenation of adsorbed NO and intermediate species without the prior adsorption of solvated protons. The mechanisms of nitric oxide reduction can be further categorized into four groups based on the type of hydrogenation involved: Tafel-dissociative (T-D), Tafel-associative (T-A), Heyrovsky-dissociative (H-D), and Heyrovsky-associative (H-A) mechanisms. Furthermore, the T-A and H-A mechanisms are subdivided into four specific routes depending on the type of adsorption associated with each pathway. These routes are referred to as distal-O, distal-N, alternating-O, and alternating-N. Overall, the electrocatalytic reduction of nitric oxide to ammonia involves complex mechanisms dictated by the adsorption patterns of NO on the catalyst surface. The process can follow either a dissociative or associative pathway, with hydrogenation occurring through Tafel-type or Heyrovsky-type routes. Elucidating these mechanisms and the associated adsorption pathways is crucial for optimizing the electrocatalytic reduction of nitric oxide and enabling the production of valuable ammonia from industrial waste emissions.
The electrocatalytic co-reduction of nitrate/nitrite (NO3−/NO2−) and carbon dioxide (CO2) with C-N coupling holds significant potential for the production of urea, which is a valuable compound widely used in agricultural fertilizers. However, the process is highly complex and its detailed mechanism is still under investigation. Researchers have proposed several possible mechanisms to elucidate the C-N coupling process [43]. One proposed mechanism, reported by Shibata et al., suggested a direct pathway for urea formation [44]. They observed that urea was only formed when both CO2 and NO2− were present during the electrocatalytic process. Based on this observation, they deduced a mechanism where NH2-like and CO-like intermediates (*NH2 and *CO) generated by the reduction of NO2− and CO2, respectively, directly lead to the formation of urea. However, further experimental validation is required to confirm the validity of this mechanism. In a subsequent study, Shibata et al., modified the earlier mechanism based on the relationship between the faradaic efficiencies of CO and NH4+ in urea production [45, 46]. They found that the faradaic efficiency of urea production showed a stronger linear relationship with the square root of the product of the faradaic efficiencies of CO and NH4+ rather than the cube root of the product. This revision suggests that the formation of *(NH2)CO from *CO and *NH2 is the crucial step in the C-N coupling process. Another proposed mechanism, presented by Zhang et al., involves the coupling of NH2 and COOH intermediates, which are generated from the reduction of NO2− and CO2, respectively [47]. In situ infrared (IR) spectra supported this hypothesis by showing stronger *COOH intermediate peaks under the CO2 condition compared to the CO2 + NO2− condition. Additionally, they observed an absorption band attributed to C-N bond formation, providing valuable spectroscopic evidence of the surface intermediates involved in the electrocatalytic reduction of CO2 to urea. Yu and co-workers further demonstrated an alternative pathway for C-N coupling in a recent study [48]. They suggested that the early coupling of C and N intermediates, *CO2 and *NO2, respectively, played a key role in the formation of urea. This pathway benefited from a lower energy barrier for *CO2NO2 formation compared to *HNO2 formation. The hypothesized *CO2NO2 intermediate then underwent multiple electron- and proton-transfer steps to generate *CO2NH2 and subsequently *CONH2. The *CONH2 intermediate further couples with a second *NO2 intermediate, leading to further reduction and the ultimate formation of urea. Experimental evidence for this C-N coupling mechanism was provided by infrared measurements. It is important to note that these proposed mechanisms require further experimental validation to fully understand the C-N coupling process during urea electrosynthesis. Additional studies, such as the co-reduction of NO and CO2 combined with in situ IR measurements, may provide further insights and contribute to a comprehensive understanding of this complex process.
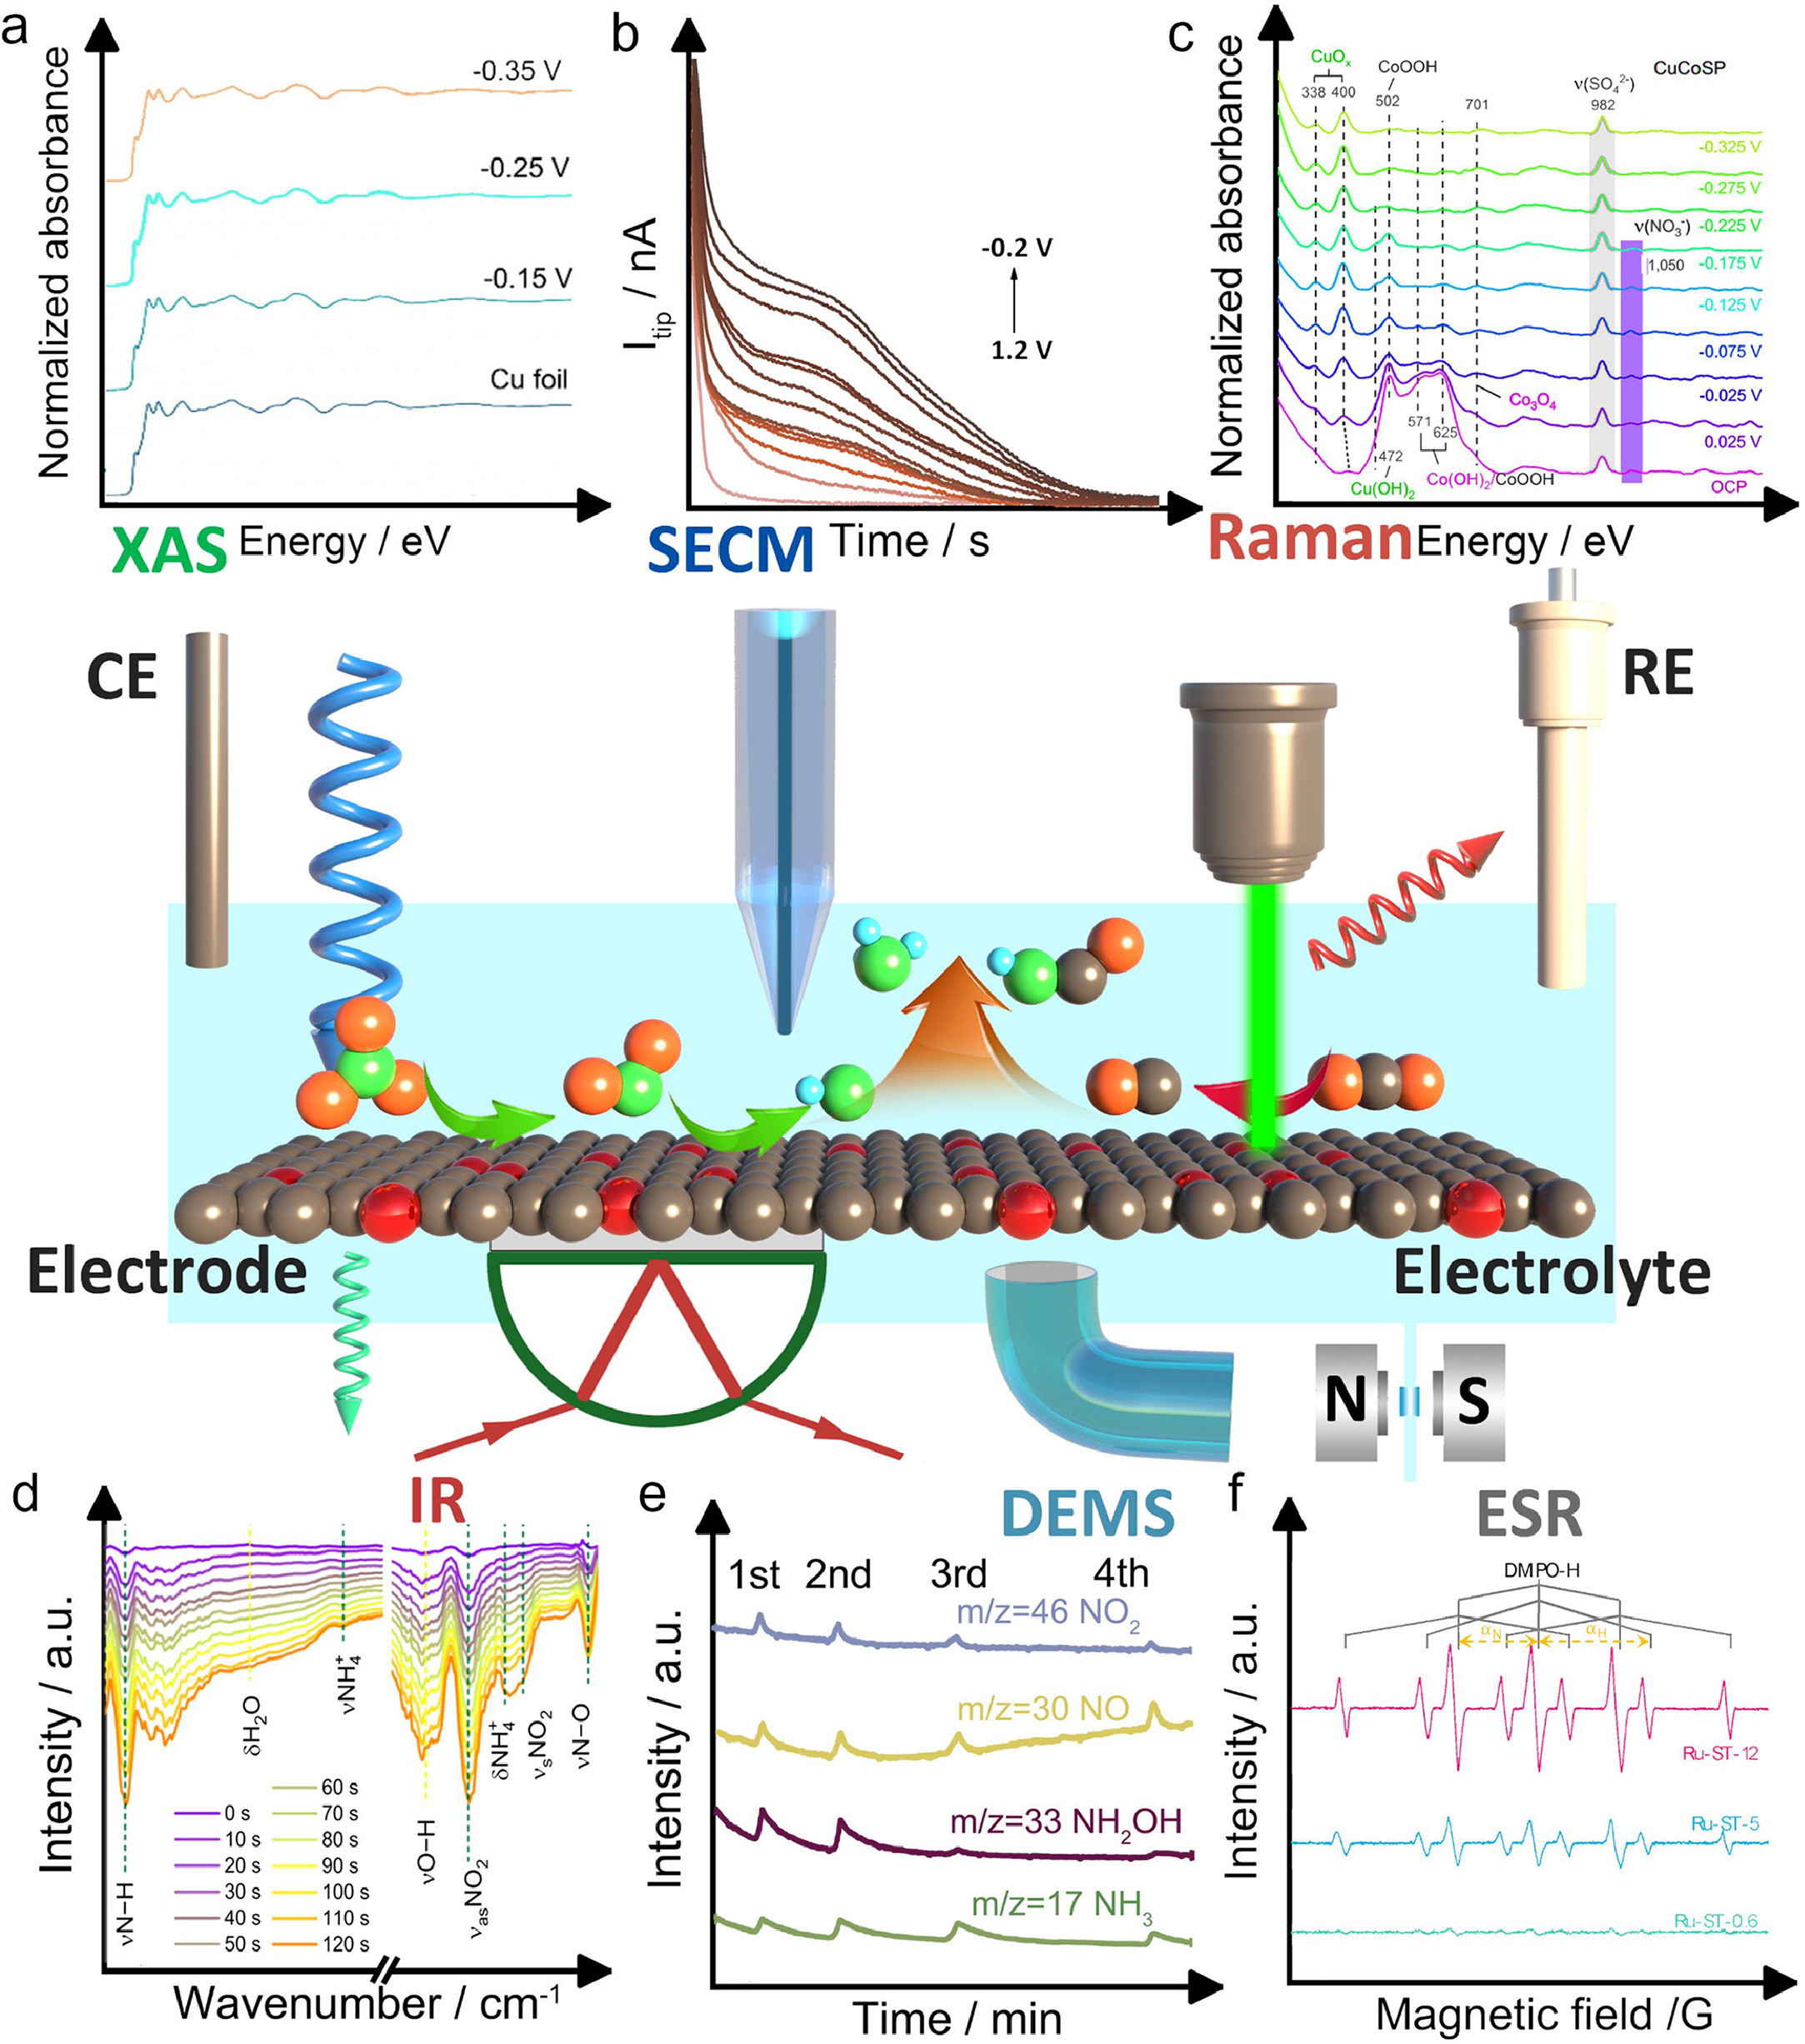
Understanding the structure, composition, and reaction mechanisms of electrocatalysts utilized in environmental electrocatalysis, specifically for nitrogenous waste removal and upgrade, holds tremendous significance. Over the past few decades, advanced analytical techniques and methods have made substantial contributions to our comprehension of materials design and electrocatalytic processes [31, 49-52]. The incorporation of modern in situ/operando techniques has provided invaluable insights into the relationship between structure, composition, and reactivity under real-time reaction conditions. This section focuses on the technological advancements and applications of X-ray absorption spectroscopy (XAS), Raman spectroscopy, infrared spectroscopy, scanning electrochemical microscopy, differential electrochemical mass spectroscopy, and other emerging techniques in characterizing the reaction mechanisms involved in nitrate, nitrite, and nitric oxide reduction, as well as the C-N coupling process (Fig. 3) [53-58]. According to prior literature, "in situ" refers to the real-time measurement of a catalytic process under relevant reaction conditions, contrasting with conventional ex situ measurements conducted before and after reactions [59]. It is crucial to consider that in situ methods may deviate from optimal (electro)catalytic reaction conditions due to instrument operating conditions such as low temperature and high vacuum. Additionally, "operando" pertains to measuring a functioning (electro)catalyst under the same reaction conditions as those inside a catalytic reactor or an actual operating device. Operando methods aim to minimize the experimental disparity in measurement conditions between instrumental requirements and realistic (electro)catalytic reactions. While the term "in situ" has been extensively used, the concept of "operando" is increasingly acknowledged, carrying substantial implications for the study of environmental catalysis under realistic conditions [31]. This section reviews some of these powerful techniques that have emerged recently, and their advantages for studying nitrogenous waste conversion.
XAS is a spectroscopic method that uses X-rays to probe the electronic and atomic structure of materials. The XAS signal is divided into two parts: XANES and EXAFS, which reflect the chemical state, local symmetry, and chemical bonds of the absorbing atom, as well as the spatial arrangement of neighboring atoms [60]. The experiment requires a broadband X-ray source, typically a synchrotron source, as well as optical components such as monochromators and detectors. XAS can be combined with electrochemistry to study the coordination of metal ions at a controlled oxidation state in various electrolytes as demonstrated in Fig. 4a. Thus, X-ray absorption spectroelectrochemistry is a powerful tool for operando studies of the geometric and electronic structural insights into the catalytic active sites of catalysts. Copper is a widely studied catalyst for electrocatalysis involving nitrate and CO2 reduction [50]. As an example, Fig. 4b illustrates the absorption of X-ray photons by the K-shell (1s) electrons of copper (Cu) in an oxidized Cu nanoparticle (NP), evident from the absorption edge observed at approximately 9.0 keV [61]. This absorption edge, referred to as the Cu K-edge, occurs due to the excitation of core electrons to available unoccupied states in the valence band upon X-ray photon absorption. The position of the absorption edge is specific to the element and approximately scales with the square of the atomic number (Z2). The intensity of the absorption edge is determined by the number of atoms of the absorbing element encountered by the X-ray beam, influenced by factors such as sample thickness and the concentration of the absorbing element. The shape of the absorption edge, along with the features preceding and following it, is dictated by the electronic structure of the material, including the density of unoccupied states accessible to the excited core-level electron (referred to as the photoelectron), as well as the atomistic structure resulting from interactions between the photoelectron and neighboring atoms. The oscillations observed in the absorption probability before and after the absorption edge, known as X-ray absorption fine-structure, offer valuable insights into the structural and property characteristics of the material, making it a highly sensitive tool for investigation.
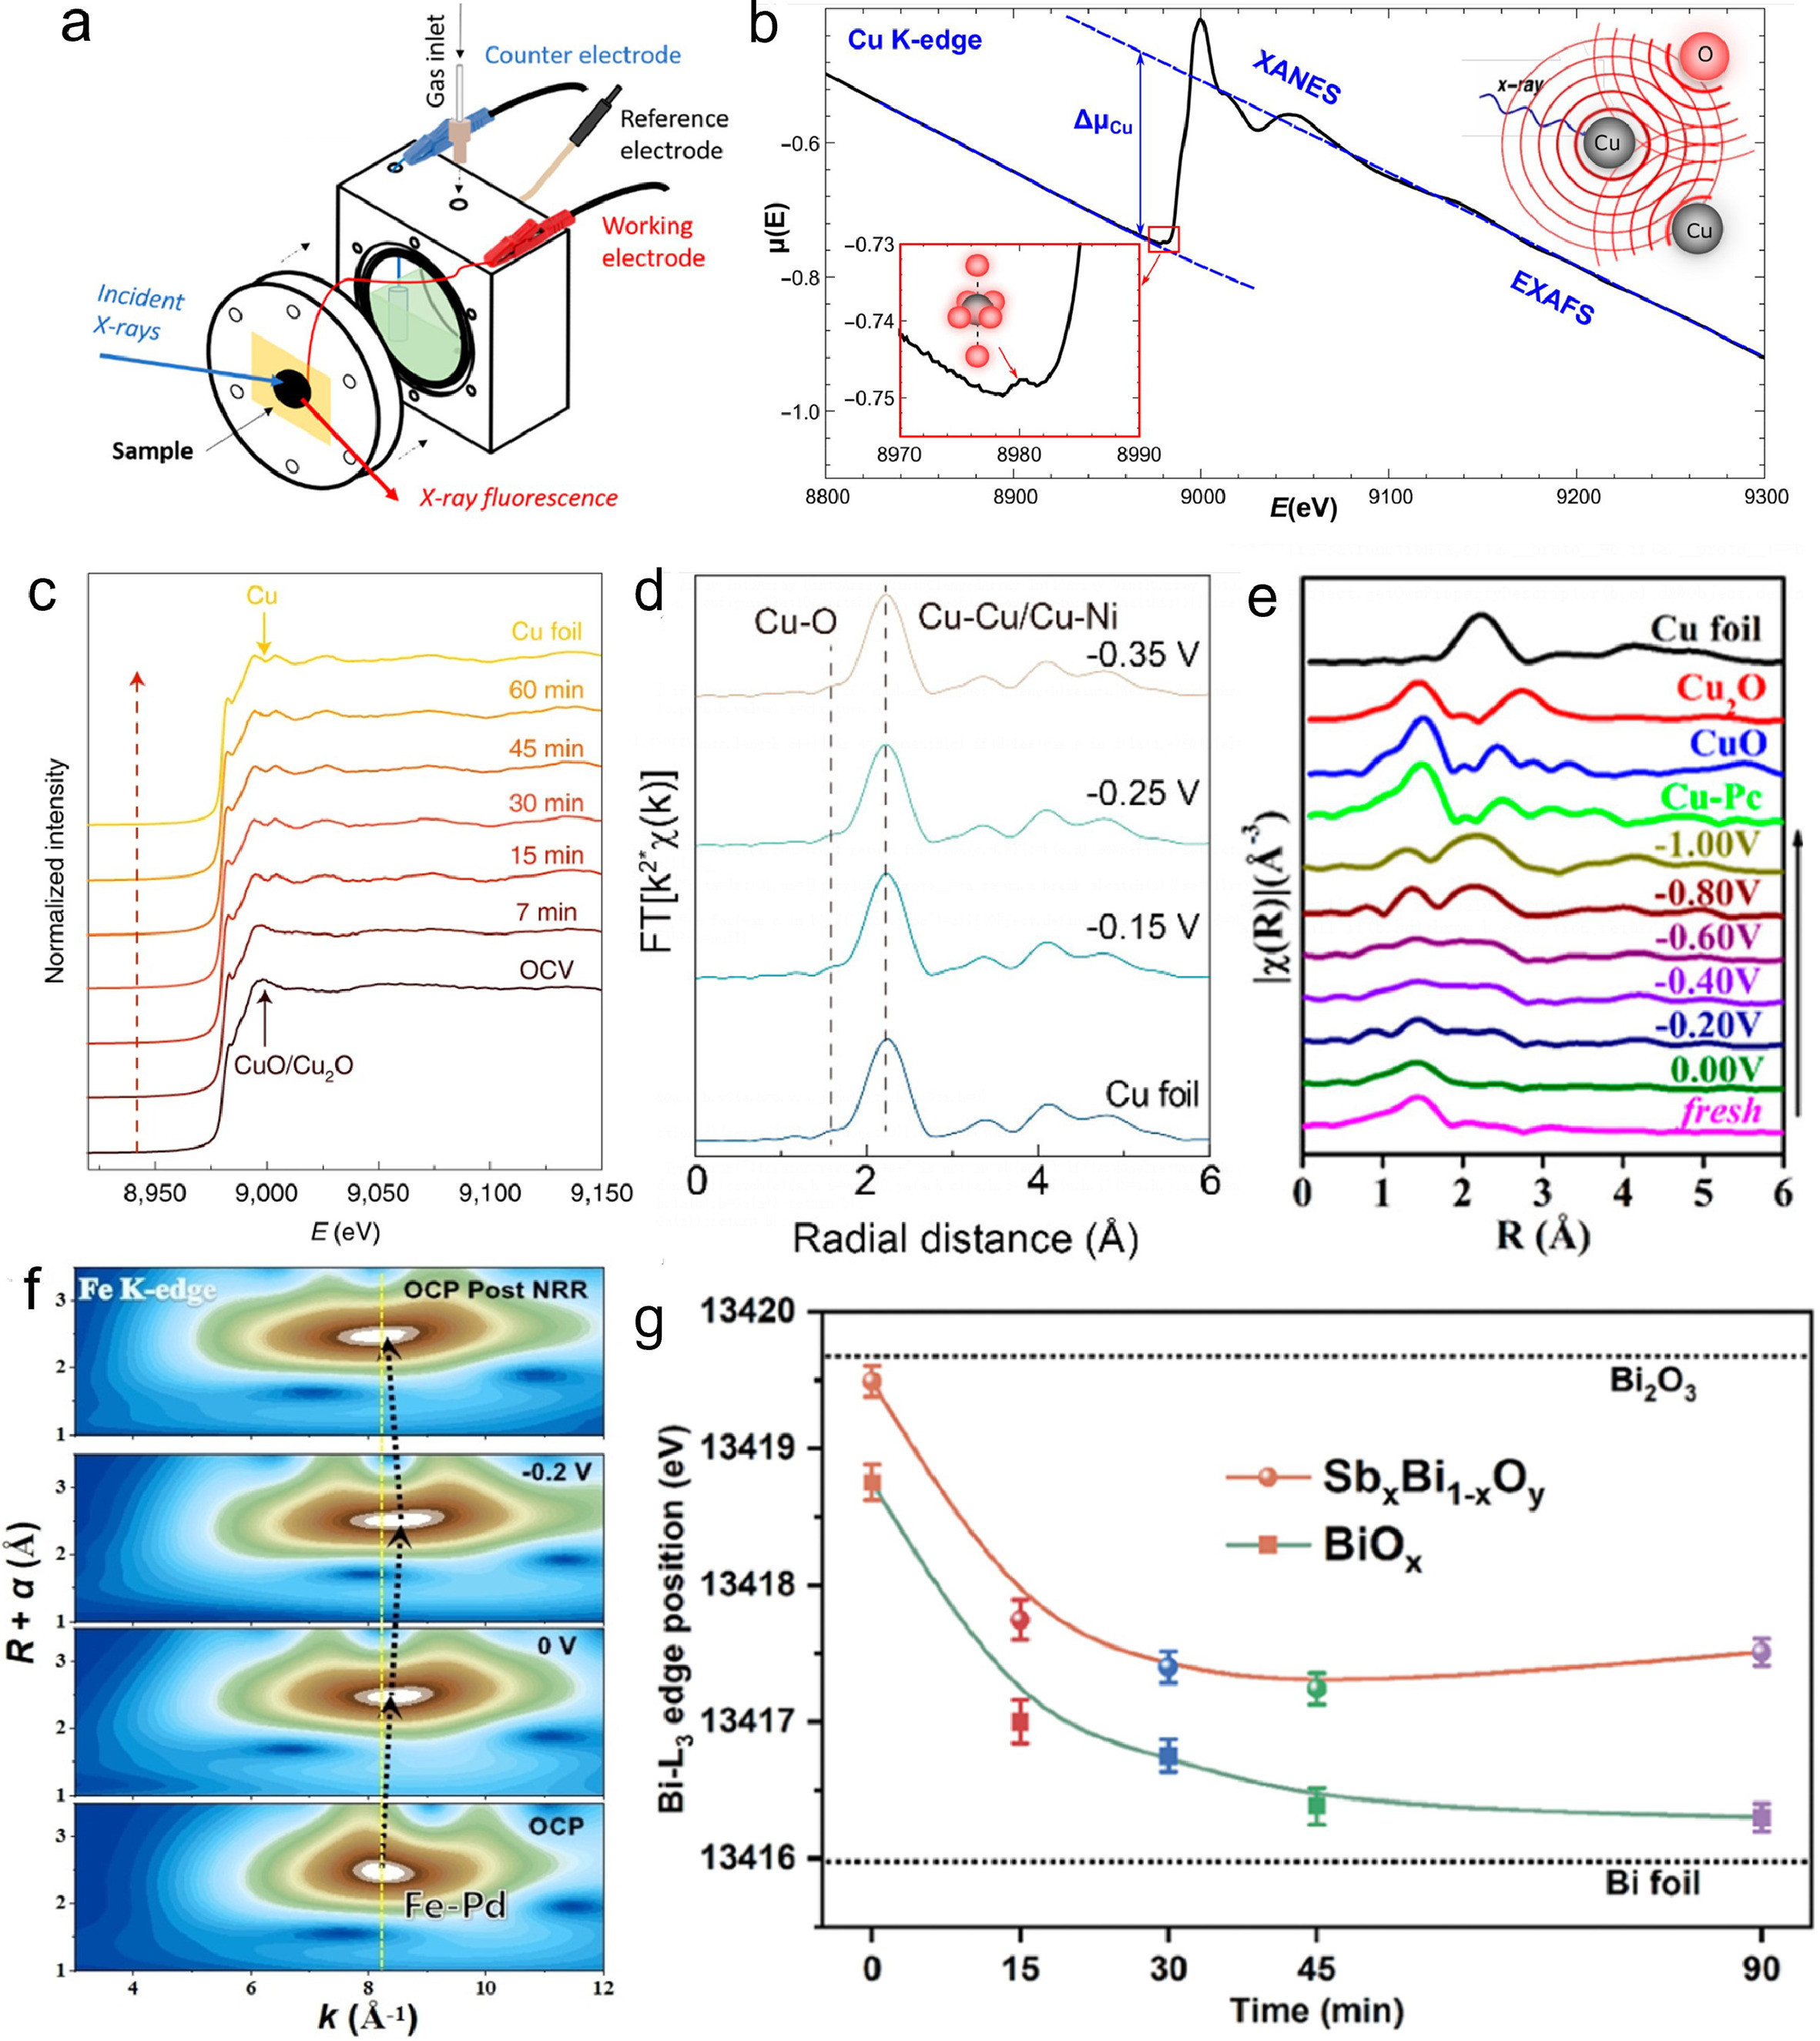
Wang et al., developed a Ru-dispersed Cu nanowire (Ru-CuNW) electrocatalyst, which exhibited remarkable performance in the electrochemical reduction of nitrate to ammonia [62]. The Ru-CuNW catalyst achieved a remarkable current density of 1 A/cm2 at a high nitrate concentration of 2000 ppm, representative of industrial wastewater, with a 96% Faradaic efficiency. To further understand the electronic properties and coordination structures of the Ru-CuNW catalyst, in situ XAS was employed (Fig. 4c). The results confirmed the complete reduction of both Cu and Ru atoms to their metallic states during the pre-reduction process, which remained stable throughout the nitrate reduction reaction. Additionally, the analysis revealed the uniform dispersion of Ru dopants at the atomic level within the Cu matrix, without cluster formation. The study also demonstrated a coupled process capable of producing high-purity solid NH4Cl and liquid NH3 solution products from low-concentration nitrate sources. These findings are of great significance for environmental sustainability, offering a potential solution to the problem of nitrogenous pollution in wastewater. Sargent et al., demonstrated the electrochemical conversion of nitrate (NO3−) into ammonia (NH3) using copper–nickel (CuNi) alloy catalysts [54]. The Cu50Ni50 alloy catalyst showed superior performance, with a 0.12 Ⅴ upshift in the half-wave potential, a 6-fold increase in activity, and a 99% Faradaic efficiency for NH3 production compared to pure Cu. The operando hard XAS spectra show that the Cu50Ni50 catalyst maintains a metallic state and a stable surface atomic arrangement under NO3RR conditions (Fig. 4d). The spectra also revealed that the d-band center of Cu shifted toward the Fermi level as Ni is incorporated into the alloy, which modulated the adsorption energies of intermediates such as *NO3−, *NO2, and *NH2. These results suggest that the electronic structure of the CuNi alloy catalysts is related to their enhanced NO3RR activity and selectivity. In addition to providing insights into the micro-environment of active sites during nitrate reduction through operando X-ray absorption spectroscopy (XAS), this technique was also employed by Li et al., to investigate site migration in the Cu-N-C catalyst during electrochemical nitrate reduction [63]. The results, depicted in Fig. 4e, revealed a transformation of the initial Cu-N4 structure into Cu-N3, near-free Cu0 single atoms, and aggregated Cu0 nanoparticles as the applied potential decreased from 0.00 Ⅴ to −1.00 Ⅴ versus RHE. Notably, the formation of Cu0 nanoparticles was correlated with an enhancement in the rate and selectivity of ammonia production, indicating their role as active sites for the reaction. Furthermore, these aggregated Cu0 nanoparticles demonstrated the ability to disintegrate back into single atoms and restore the original Cu-N4 structure when exposed to an ambient atmosphere after electrolysis, indicating a reversible restructuring process driven by the applied potential and oxidation environment.
Operando XAS has been also applied to study gas-involved reactions. Chu et al., have successfully developed a new catalyst, known as PdFe1 single-atom alloy metallene, which was capable of efficiently converting nitrogen gas into ammonia under ambient conditions [64]. This catalyst consisted of isolated iron atoms embedded in a palladium metallene support, activating nitrogen molecules through σ-donation (N2-to-Fe). The catalyst exhibited remarkable performance for the nitrogen reduction reaction (NRR), achieving a high ammonia yield of 111.9 µg h−1 mg−1 and a Faradaic efficiency of 37.8% at −0.2 Ⅴ (vs. RHE). The catalyst demonstrated stability and selectivity for the NRR, as confirmed by theoretical calculations and operando spectroscopy measurements illustrating the evolution of active sites and electronic structure (Fig. 4f). The Fe atoms' valence state decreased with increasing potential, indicating electron transfer from N2 to Fe through σ-donation, as revealed by Fe K-edge XANES spectra. The Fe-Pd bond length increased with increasing potential, indicating N species adsorption on Fe sites and Fe-Pd configuration distortion, as shown by Fe K-edge EXAFS spectra and WT profiles. A new Fe-N coordination peak emerged at −0.2 Ⅴ, confirming the Fe-N species interaction during the NRR process. Pd K-edge XANES and EXAFS spectra showed no significant changes under different potentials, suggesting Pd support's inertness for the NRR. The electrosynthesis of urea has gained attention as it allows the conversion of carbon and nitrogen wastes into a more valuable product beyond ammonia. Guo et al., studied the synthesis and characterization of amorphous SbxBi1−xOy clusters, employed as catalysts for direct urea synthesis from CO2 and N2 via C-N coupling [65]. The results suggested that Sb-doping of BiOx clusters altered CO2 adsorption, favoring CO intermediate formation and reducing HCOOH byproducts. In situ XANES (Fig. 4g) indicated initial Bi oxidation state below +3, implying abundant oxygen vacancies. Applying reduction potential in CO2 and N2 saturated electrolyte, Bi oxidation state decreased to Bi0, indicating its actual working state. However, SbxBi1−xOy clusters showed a slight decrease to Bi2+ after 15 minutes, remaining unchanged during catalytic process. Sb effectively stabilized electronic and geometric structures of amorphous BiOx clusters. Active phase of the catalyst was identified as Bi2+ with unsaturated coordination, promoting C-N coupling through electron injection into N2. Catalyst achieved high urea production rate and Faraday efficiency at −0.3 Ⅴ vs. RHE, showcasing one of the best performances in aqueous systems. This approach provides valuable guidelines for developing p-orbital metal catalysts for multielectron C-N coupling reactions.
Raman spectroscopy is based on the energy exchange between light and a sample, leading to Rayleigh, Stokes, and anti-Stokes scattering. The Raman shift, which is the difference between the incident and scattered light energy, reveals the molecular vibration and structure of the sample. By combining Raman spectroscopy with electrochemical methods like chronoamperometry, Raman spectroelectrochemistry can monitor structural changes at the electrode/electrolyte interface under varying potentials. The incident light can be focused on different regions such as the electrolyte, surface adsorbed layer, and electrode material. The system as illustrated in Fig. 5a comprises a Raman spectrometer with an excitation source (usually a laser), a sampling chamber, and a photon detector. This spectrometer generates and collects photons that interact with the sample, measuring their energy difference or Raman shift. An electrochemical cell, containing a working electrode (with the electrocatalyst material), a reference electrode, and a counter electrode, controls the potential and current of the working electrode while monitoring the electrochemical reaction. The customized cell design allows the incident light to reach the working electrode and scattered photons to be collected by the detector, while minimizing optical loss, interference, and contamination from the electrolyte and other electrodes. This setup enables Raman spectroelectrochemistry to provide real-time structural information of the electrode/electrolyte interface under different potentials by correlating Raman spectra with electrochemical parameters as summarized in Fig. 5b [66, 67]. This technique can assist to understand the electrochemical mechanisms and design better electrocatalysts for various reactions, such as nitrate or CO2 reduction, C-N coupling that are relevant to the environmental pollutant treatment and utilization [68, 69].
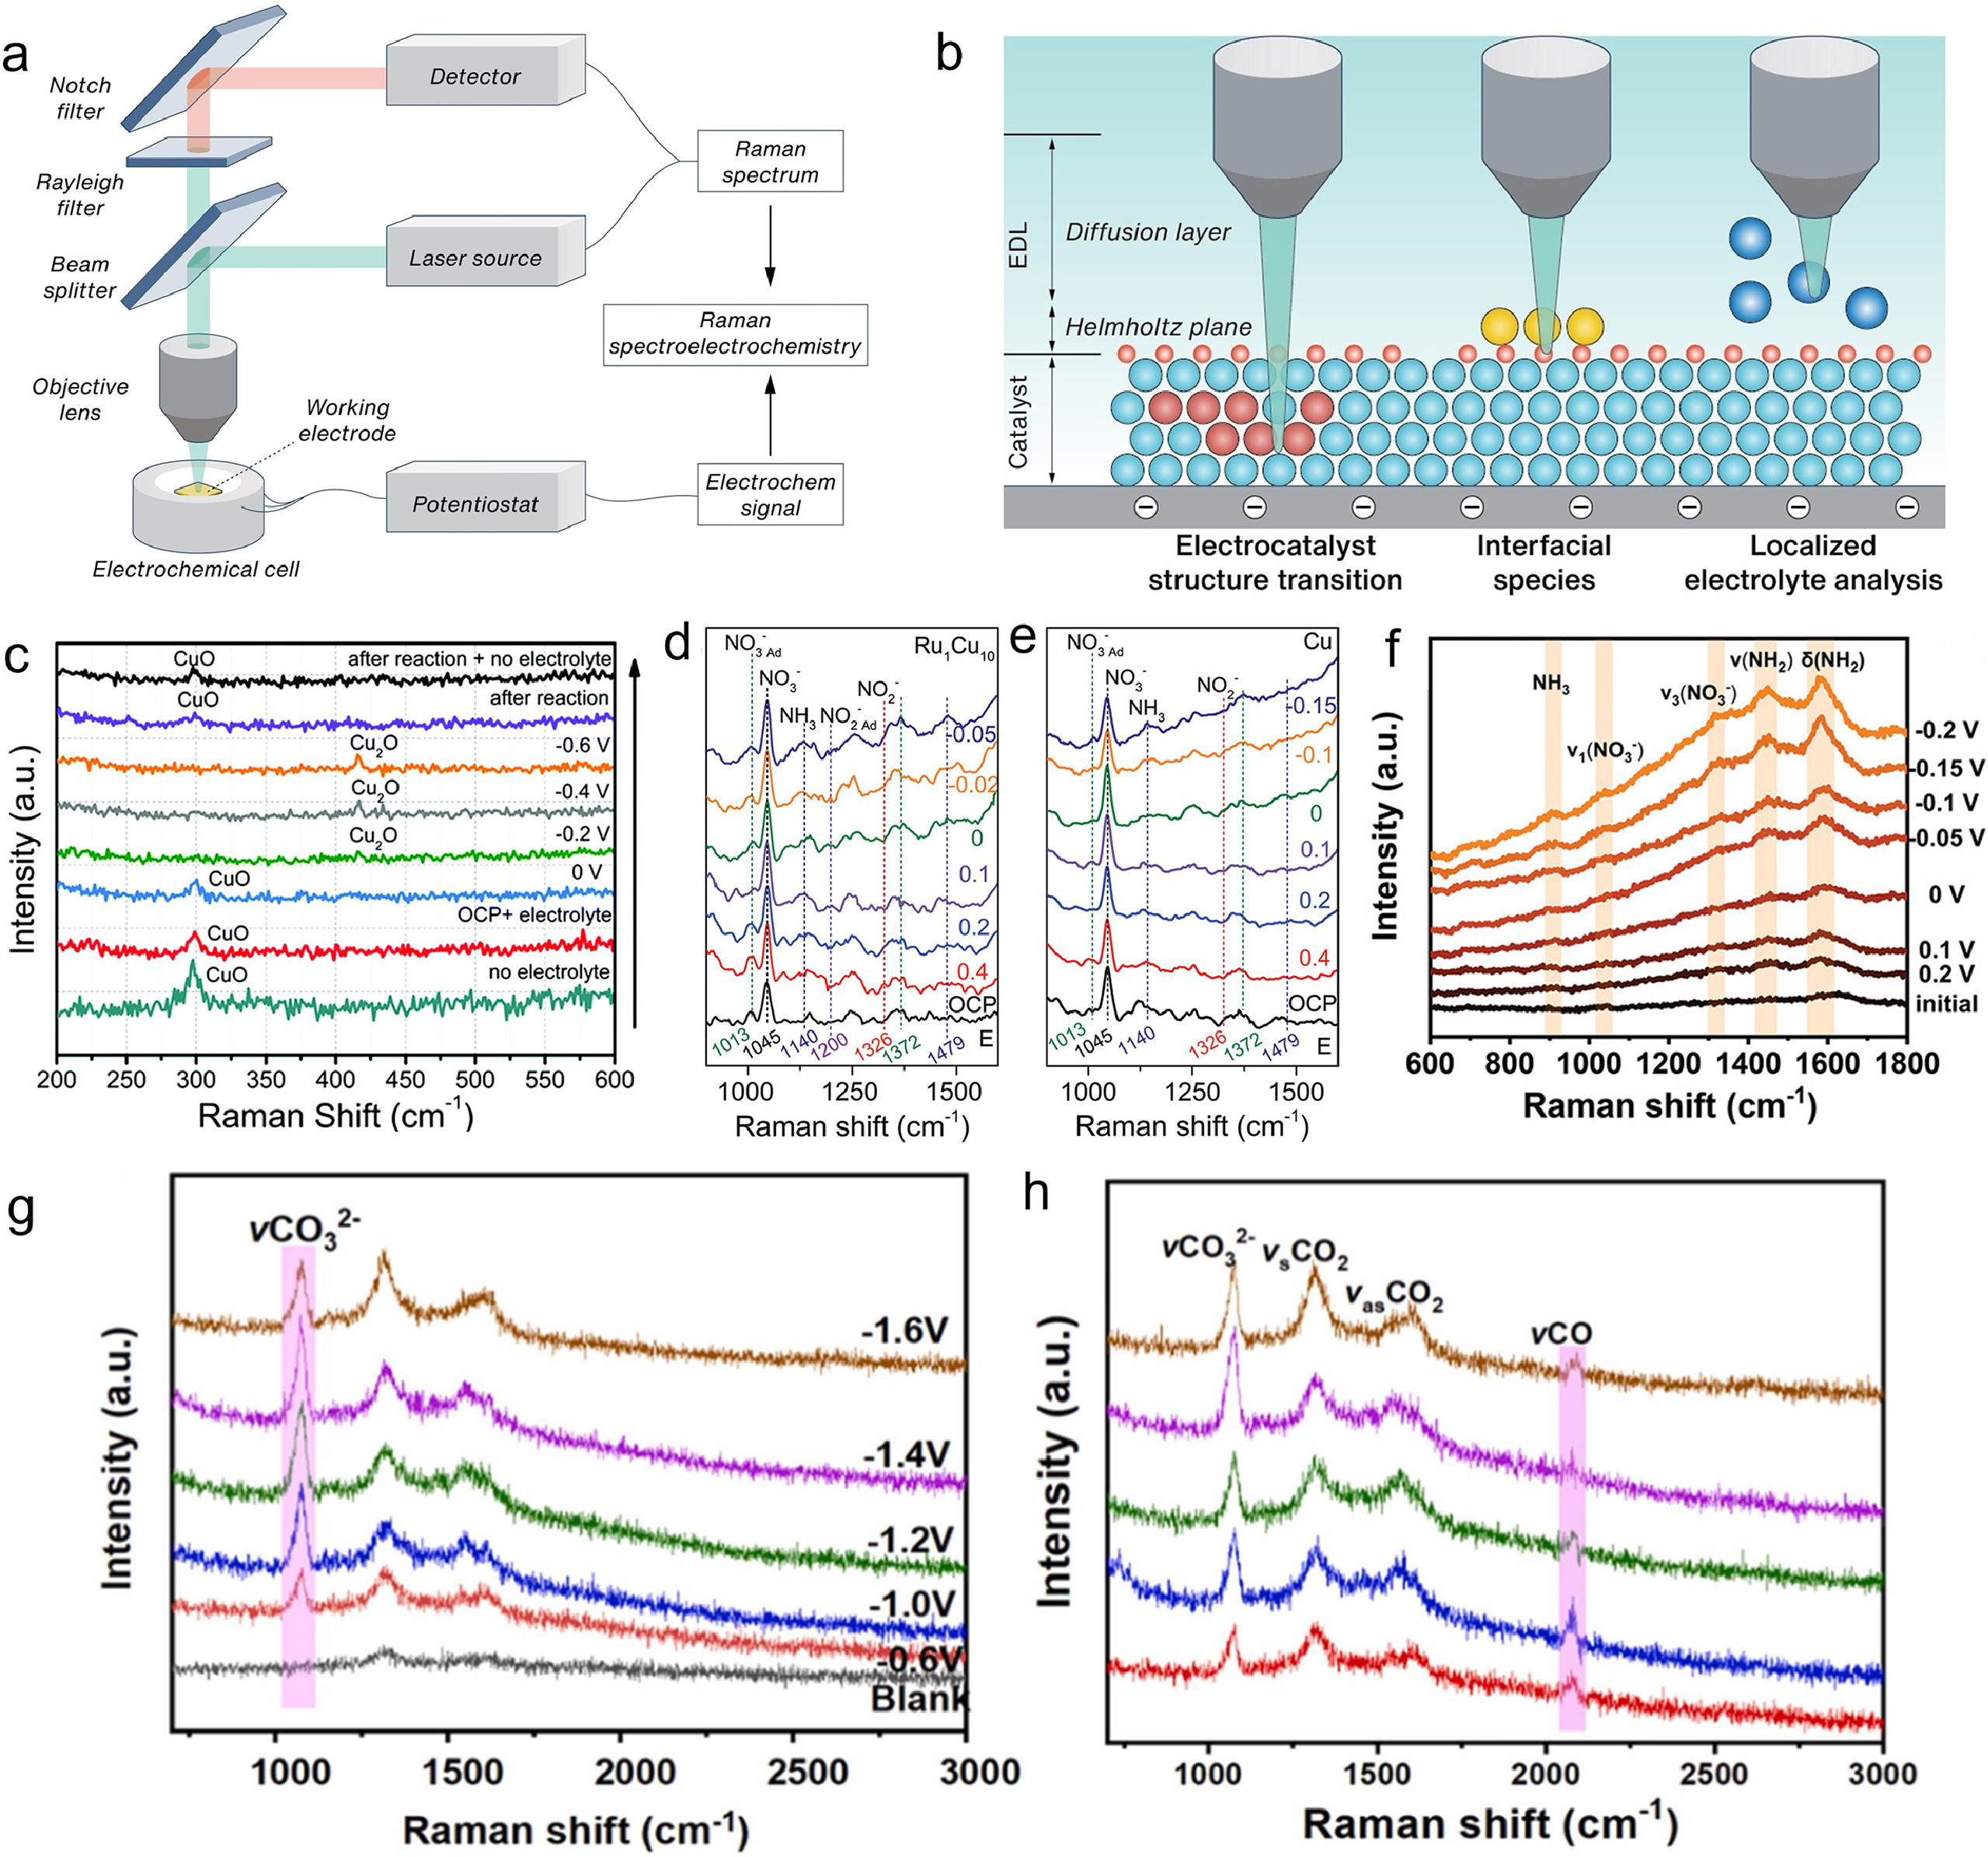
Amal et al., utilized defective CuO nanomaterials as catalysts, demonstrating that oxygen vacancy defects in CuO can enhance the adsorption and reduction of nitrate to ammonium. Fig. 5c shows the operando Raman spectra at different conditions and potentials. The figure revealed that the CuO catalyst underwent in situ reduction from CuO to Cu2O when a negative bias was applied during NOxRR. This transformation was reversible as the Raman spectra return to the pre-reaction state when the bias was stopped. The Raman signal at 300 cm−1, corresponding to CuO, decreased with negative potential, while the signal at 420 cm−1, corresponding to Cu2O, increased. These results indicated that the active sites for NOxRR were a combination of CuO and Cu2O species. As such, the authors were able to achieve a high yield and selectivity of ammonium in a flow electrolyzer using their catalysts. They also conducted economic modelling to assess the feasibility and potential of their method, which proposed that their method offered a sustainable and circular pathway to generate green ammonia from waste nitrate. Li et al. reported that RuCu alloy catalysts supported on reduced graphene oxide (rGO) were synthesized for the electrocatalytic reduction of nitrate to ammonia [70]. The Ru1Cu10/rGO catalyst exhibited the highest performance, achieving an ammonia formation rate of 0.38 mmol cm−2 h−1 and a Faradaic efficiency of 98% under a low potential of −0.05 Ⅴ versus RHE. The superior activity and selectivity of Ru1Cu10/rGO were attributed to the synergetic effect between Ru and Cu sites, which facilitated a relay catalysis process for the conversion of NO3− to NO2− and NO2− to NH3. The in situ Raman spectra as shown in Fig. 5d revealed that the Ru1Cu10 alloy catalyst with stronger adsorption of NO3− compared to the Cu catalyst (Fig. 5e), as demonstrated by the higher intensity ratio of I1013/I1045 on Ru1Cu10. Furthermore, the Ru1Cu10 alloy catalyst was capable of efficiently converting NO2− to NH3, which was evidenced by the disappearance of the Raman band at 1326 cm−1 and the emergence of the Raman bands at 1140 and 1479 cm−1. In contrast, the Cu catalyst primarily produced NO2− as a by-product, as indicated by the stable Raman band at 1326 cm−1 and the low intensity of the Raman bands at 1140 and 1479 cm−1. The data suggests that the Ru1Cu10 alloy catalyst can facilitate a direct reduction of NO3− to NH3, as indicated by the positive shift of the onset potential and the high number of electron transfer.
Besides the identification of active species that is responsible to catalysis, electrochemical Raman spectroscopy has been also well developed to characterize intermediate structures of *NOx, *NHx, *COx [71-73]. Another work authored by Cui et al., reported a [W-O] group-doped CoP nanosheets catalyst (0.6W-O-CoP@NF), which could efficiently convert nitrate to ammonia through electrochemical reduction. The [W-O] group enhanced water decomposition to provide active hydrogen for the hydrogenation of NO3−, and modulates the electronic structure of Co to optimize the adsorption of Hads and NO3− intermediates. The 0.6W-O-CoP@NF catalyst demonstrates an impressive NH3 yield of 80.92 mg h−1 cm−2 and a Faradaic efficiency (FE) of 95.2% in 0.1 mol/L KOH containing 0.1 mol/L NO3−, and is effective across a wide NO3− concentration range from 0.001 to 0.1 mol/L. More importantly, the electrochemical in situ Raman spectra of 0.6W-O-CoP@NF collected at different potentials as shown in Fig. 5f reveals the adsorption of NO3− and the production of NH3 and NH4+ on the catalyst surface, as well as the intermediates during the NitRR. The result also confirmed that the hydrogenation pathway of NO3RR followed the "NO→HNO→H2NO→H2NOH→*NH2" pathway, which provides evidence for the proposed cascade catalytic mechanism [74]. In a latest study, Wang et al., employed in situ Raman spectroscopy to identify the key reaction intermediates and pathways for C-N coupling on the Cu2O catalyst. Fig. 5g shows a peak at 1053 cm−1, which corresponds to the adsorbed carbonate species of *CO32−. This indicated that CO2 was activated and reduced on the c-Cu2O catalyst. The intensity of this peak changed with the applied potential, which reflected the variation of the CO2RR activity [75]. In Fig. 5h, a peak at 2070 cm−1 was observed, which was assigned to the adsorbed CO species of *CO. This further suggested that CO was one of the products of CO2RR on the c-Cu2O catalyst. The presence of *CO also supported that it could react with *NH to form C-N bonds and eventually urea The findings from the in situ Raman spectroscopy were further validated using DFT calculations, providing a comprehensive understanding of the reaction process. This combination of experimental and computational techniques allowed for a detailed understanding of the electrocatalytic performance of Cu2O nanoparticles for urea synthesis.
In situ attenuated total reflection infrared (ATR-IR) spectroscopy is a valuable technique for real-time observation of chemical reactions occurring on an electrode surface. This technique involves directing an infrared beam onto a silicon prism that is coated with a thin metal film, typically platinum, serving as the working electrode. The incident beam is angled greater than the critical angle, generating an evanescent wave that penetrates the surrounding electrolyte solution. As this wave interacts with molecules adsorbed on the electrode surface, it reflects back to the detector, creating an infrared spectrum. By analyzing the vibration modes of the adsorbed species revealed in the IR spectrum, researchers can identify reaction intermediates and products. The experimental setup for in situ ATR-IR measurement is illustrated in Fig. 6a [76]. It consists of a Si prism with a thin Pt film serving as the working electrode and ATR element. The counter electrode is a platinum wire, and the reference electrode is an Ag/AgCl electrode. All components are enclosed within a PTFE electrochemical cell containing the electrolyte solution. An infrared spectrometer equipped with a mercury cadmium telluride (MCT) detector is employed to direct the infrared beam onto the prism at an appropriate angle and capture the reflected beam from the electrode surface. This setup enables real-time monitoring of chemical reactions occurring on the electrode surface by continuously measuring the IR spectra of the adsorbed species [77-79].

In a previous study, Eguchi et al. examined the electrochemical oxidation of ammonia on a platinum electrode in alkaline solutions using ATR-IR spectroscopy to identify the reaction intermediates and products on the Pt surface [76]. Fig. 6b illustrates the time-resolved IR spectra of the Pt surface, obtained simultaneously with the linear sweep voltammogram in a solution containing 0.1 mol/L NH3 and 1 mol/L KOH. The figure reveals three distinct bands originating from adsorbed NH3, N2H4, and bridged NO, with their intensities varying as a function of applied potential. The band observed at 1662–1674 cm−1, associated with the HNH bending mode of NH3, exhibited a continuous decrease with increasing potential, indicating the oxidative consumption of adsorbed ammonia. At potentials above 0.2 Ⅴ, a band at 1269 cm−1 emerged, corresponding to the NH2 wagging mode of N2H4. This band reached a local maximum around 0.4 Ⅴ, correlating with the onset potential of ammonia oxidation (~0.45 Ⅴ) in the linear sweep voltammogram, suggesting the involvement of N2H4 as an active intermediate in the ammonia oxidation process. Furthermore, a broad band observed at 1497–1508 cm−1, attributed to the stretching vibration of bridged NO, exhibited a gradual increase starting from approximately 0.5 Ⅴ and reached a local maximum around 0.7 Ⅴ. This observation implies the formation of adsorbed NO species during ammonia oxidation, which may potentially hinder the reaction at higher potentials.
A recent investigation conducted by Shao et al. synthesized a CoP nanosphere electrocatalyst assembled on a self-supported carbon nanosheet array (CoP-CNS) [58]. This unique catalyst demonstrated remarkable efficiency in converting nitrate to ammonia under ambient conditions. At −1.03 Ⅴ vs. RHE, the CoP-CNS achieved an unprecedented ammonia yield rate of 8.47 mmol h−1 cm−2, accompanied by a high Faradaic efficiency of 88.6%. Notably, in situ FTIR spectra in Fig. 6c provided valuable insights into the process. They exhibited characteristic peaks corresponding to adsorbed nitrate, water, and ammonia on the CoP-CNS electrocatalyst during the nitrate reduction process. The N–H and O–H mode peaks indicated the generation and consumption of Hads by N-containing intermediates, thereby influencing the selectivity and efficiency of NH3 production. The spectra also revealed distinctions in Hads utilization between CoP-CNS and Co-CNS, highlighting the influence of NO3− and OH− concentrations on the NitRR kinetics. These findings substantiated the proposed mechanism, which emphasized the maintenance of a dynamic equilibrium between Hads generation and consumption to promote the NitRR. Moreover, this study showcased the practical application of NitRR for capturing carbon dioxide from flue gas using the ammonia produced by the CoP-CNS electrocatalyst. Sun et al. reported the synthesis of a CuCo bimetallic catalyst that could efficiently reduce nitrate to ammonia by electrocatalysis [80]. This was inspired by the bifunctional nature of copper-type nitrite reductase (Cu-NIRs), an enzyme that catalyzes the same reaction in microorganisms. The CuCo catalyst outperformed pure Cu or Co catalysts, achieving a 100% Faradaic efficiency for NH3 production at an ampere-level current density of 1035 mA/cm2 and a low overpotential of 890 mV. It also demonstrated a wide potential window and good stability for NH3 generation. In situ FTIR spectroscopic technique has also been performed to understand the mechanism of NO3− reduction on the CuCo catalyst. Specifically, the result revealed the formation and consumption of different intermediates during the NO3− reduction on Cu, Co, and CuCo catalysts in alkaline media. On Cu and CuCo (Fig. 6d), the spectra showed a stepwise reduction pathway of NO3− → NO2− → NH2OH → NH3, as indicated by the consumption of NO3− and the formation of NO2−, NH2OH, and NH3 at different potentials. On Co, a weak signal of NO3− reduction and no evidence of NO2− accumulation suggest a direct reduction pathway of NO3− → NH3 via an 8-electron transfer process. The presence of Hads on CuCo and Co, but not on Cu, indicates that Co can promote the hydrogenation of NOx intermediates by providing protons and electrons. Theoretical calculations further suggested that the synergy between Cu and Co could reduce the energy barriers of the rate-determining steps and the hydrogenation of the intermediate species, leading to high NH3 selectivity and yield.
In addition to the intermediates of nitrate reduction, in situ IR spectroscopy has been also applied to characterize the NO3− and CO2 co-reduction reaction. In the recent research conducted by Wang et al., a diatomic catalyst with bonded Fe–Ni pairs (B-FeNi-DASC) was designed to enhance the efficiency of electrochemical urea synthesis [81]. These bonded Fe–Ni pairs served as cooperative sites for the activation and reduction of both nitrate and CO2, and also as C–N coupling sites for urea formation. The diatomic catalyst achieved a high urea yield rate of 20.2 mmol h−1 g−1 and a corresponding Faradaic efficiency of 17.8% at −1.5 Ⅴ, outperforming single-atom and isolated diatomic catalysts. The reaction mechanism of urea synthesis was revealed through operando synchrotron-radiation FTIR (Fig. 6e). The presence of infrared bands at approximately 1978 cm−1 and 2170 cm−1 suggested the co-activation of nitrate ions and CO2 on the B-FeNi-DASC catalyst, aligning with the goal of creating cooperative sites for NO3RR and CO2RR. A band at 2925 cm−1 indicated moderate *NO adsorption on B-FeNi-DASC, facilitating further reduction to *NH2. The band at 1694 cm−1 is linked to the *NHCO species, a crucial intermediate for urea formation. The intensity of this band increased with negative potentials, peaking around −1.5 Ⅴ, which corresponded with the electrochemical performance of B-FeNi-DASC. These spectra supported the proposed reaction mechanism for urea synthesis, which involved *NH coupling with *CO to form the first C–N bond, followed by *NHCO coupling with *NO to form the second C–N bond. This research has the potential to benefit the urea industry by mitigating its carbon footprint and nitrogen imbalance.
Scanning electrochemical microscopy (SECM) is a critical technique in the study of electrocatalysis, as it provides a detailed understanding of electrocatalyst surface structures at the atomic level [82-86]. This knowledge of surface structures, electronic properties, active sites, and the interaction between surface adsorbates and electrocatalysts is highly beneficial for investigating electrocatalytic mechanisms and designing efficient electrocatalysts [23, 87-90]. SECM allows for the investigation of surface processes during electrochemical reactions and the identification of crucial intermediates on catalyst surfaces. This understanding of the electrocatalytic mechanism is essential for the development of highly efficient electrocatalysts for energy technologies. Additionally, SECM is a powerful tool for visualizing surface properties and localized electrochemical activity with atomic-scale resolution, both in situ and operando. Fig. 7a illustrates a schematic diagram of scanning electrochemical microscopy (SECM), a technique that provides information about the reactivity and topography of a substrate surface [91]. The diagram includes a bipotentiostat controlling the potentials of the SECM tip and substrate electrodes and measuring the tip current, a stage with piezoelectric actuators moving the SECM tip in three dimensions with nanometer precision, and a computer running a LabVIEW program to synchronize the tip motion with the electrochemical response and generate SECM images. The system also features an isothermal chamber for temperature stabilization and reduction of thermal drift, a relay-switch-removed bipotentiostat to prevent electrochemical damage of the nanometer-sized tip during SECM experiments, and a lockable micropositioner to minimize physical creeping or drift in the lateral tip position and avoid artifacts in SECM imaging [92-94]. In SECM, the scanning generation/tip collection (SG-TC) mode (Fig. 7b) enables product analysis by generating a product on the substrate electrode and collecting it with the tip electrode. The resulting tip current reflects the substrate reactivity. The surface interrogation (SI) mode (Fig. 7c) quantifies active site numbers by generating a molecular probe on the tip electrode that reacts with active species on the substrate surface. The resulting tip current is directly proportional to the number of active sites. These commonly used SECM modes provide valuable tools for studying electrocatalytic systems and understanding interfacial electrochemical processes [95-99].
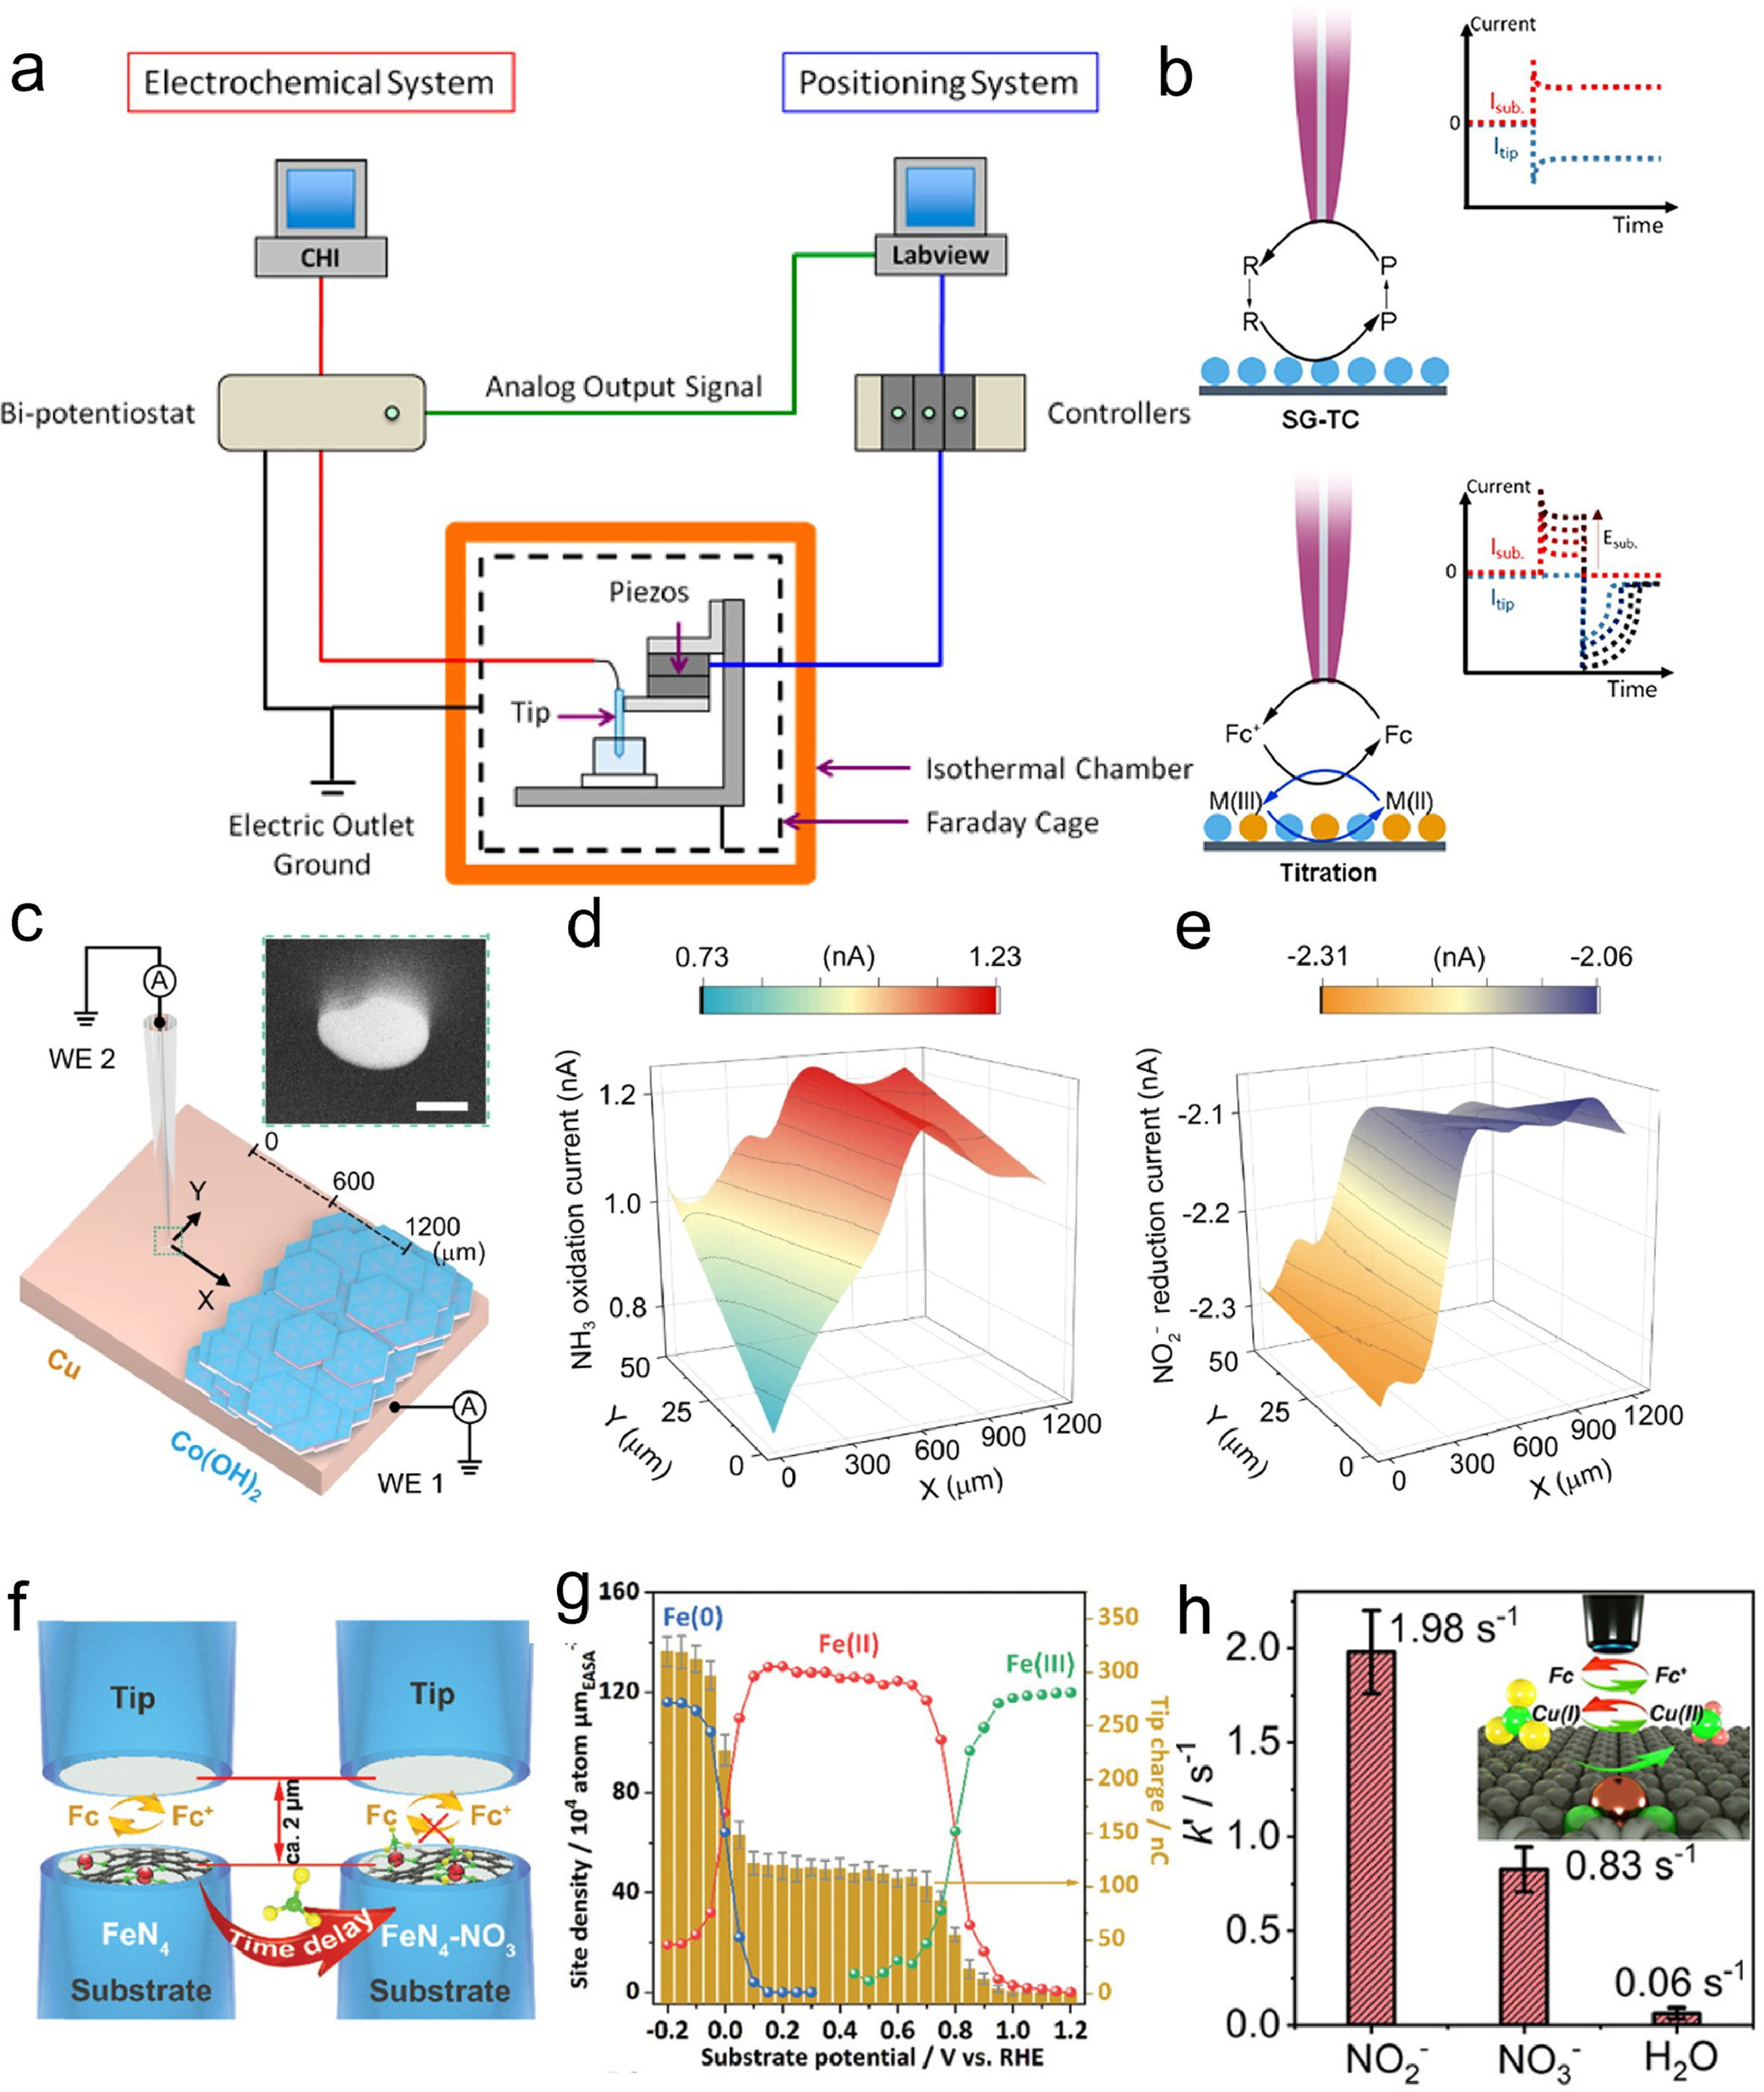
Schuhmann et al., presented a tandem catalyst for cascade NO3−-to-NH3 conversion, which involved coupling intermediate phases of different transition metals as cooperative active sites [57]. They implemented this by transforming Cu−Co binary sulfides (CuCoSP) into core−shell Cu/CuOx and Co/CoO phases electrochemically. These phases showed high activity and selectivity for NO3−-to-NH3 conversion at low overpotentials. The inner Cu/CuOx phases preferentially catalyze NO3− reduction to NO2−, while the outer-layer Co/CoO phases selectively catalyze NO2− reduction to NH3, resulting in a tandem catalysis process. The results from SECM in Figs. 7d and e provided direct evidence of tandem catalysis of NitRR on a Cu-Co(OH)2 model catalyst, which simulated the Cu-based and Co-based phases in CuCoSP. The SG-TC experiments showed that NO2− was preferentially formed on the Cu layer and then diffused to the near Co(OH)2 layer, where it was reduced into NH3. The amount of generated NH3 substantially increased at the border between the Cu and Co(OH)2 layers, while the amount of generated NO2− sharply decreased. This confirmed that the Cu-based and Co-based phases in CuCoSP worked in tandem for efficient NO3−-to-NH3 conversion at low overpotentials. This tandem catalyst system leads to a NO3−-to-NH3 Faradaic efficiency of 93.3% ± 2.1% in a wide range of NO3− concentrations at pH 13, a high NH3 yield rate of 1.17 mmol cm−2 h−1 in 0.1 mol/L NO3− at −0.175 Ⅴ vs. RHE, and a half-cell energy efficiency of ~36%, surpassing most previous reports.
Jin et al., demonstrated the synthesis of a single-site iron catalyst with nitrogen coordination (Fe-PPy SACs), which can selectively and efficiently produce ammonia from nitrate electroreduction under alkaline conditions. This catalyst exhibited a maximum yield rate of 2.75 mgNH3 h−1 cm−2 and a faradaic efficiency of nearly 100% for ammonia production [55, 100]. The authors employed surface interrogation mode of SECM to investigate the nitrate reduction reaction (NitRR) on different catalysts as illustrated in Fig. 7f, specifically Fe-PPy SACs and Fe nanoparticles (NPs). The study revealed that Fe-PPy SACs underwent two oxidation state transitions of Fe sites (Fig. 7g), shifting from Fe(Ⅲ) to Fe(Ⅱ) and then from Fe(Ⅱ) to Fe(0), while Fe NPs only exhibit one transition, from Fe(Ⅱ) to Fe(0). Moreover, the Fe-PPy SACs were found to selectively reduce nitrate to ammonia without generating hydrogen through water dissociation, a challenge encountered with the Fe NPs due to the competition between the NitRR and HER. The single-atom catalysts, Fe-PPy SACs, demonstrated a higher turnover frequency (TOF) compared to the Fe NPs, indicating their superior intrinsic activity. these observations were attributed to a NitRR mechanism primarily occurring at the single-site center, while the bulk surface follows a classical competitive mechanism. These experimental findings were further supported by density functional theory (DFT) calculations. Recently, the authors from the same research group reported an innovative pulse electrocatalytic strategy utilizing a copper single-atom gel (Cu SAG) as a catalyst to convert nitrate to ammonia under neutral conditions [30, 101]. Their study demonstrated the superior performance of Cu SAGs in ammonia synthesis from both nitrate and nitrite in a phosphate buffer solution. To investigate the structural and electronic properties of Cu SAGs and the mechanism of nitrate and nitrite activation on their surface, the authors employed SI-SECM technique. Specifically, they compared the adsorption rates (Fig. 7h) of NO3−, NO2−, and H2O on Cu SAGs, revealing that NO2− exhibited the highest adsorption rate, followed by NO3− and H2O [102]. This finding suggested a stronger interaction between NO2– and Cu single-atomic sites compared to NO3− and H2O, which aligns with the electrochemical and theoretical data. Furthermore, the authors calculated the pseudo-first-order reaction rate constants for each species using time-delay titration, obtaining valuable insights into the mechanism of highly selective nitrite reduction on Cu SAGs. The unique characteristics of Cu SAGs were highlighted, including their ability to selectively activate nitrite over nitrate and water, effectively suppressing the competing hydrogen evolution reaction, as well as confining nitrite intermediates within their porous channels to facilitate their conversion to ammonia. The authors asserted that their method presented a sustainable and energy-efficient approach for nitrogen recycling and recovery from wastewater while potentially serving as an alternative to the conventional Haber-Bosch process for ammonia synthesis.
Differential electrochemical mass spectrometry (DEMS) is an analytical technique that combines electrochemical half-cell experimentation with mass spectrometry [103, 104]. This allows the in situ, mass resolved observation of gaseous or volatile electrochemical reactants, reaction intermediates and/or products. By correlating the faradaic electrode current with relevant mass ion currents, ambiguous electrochemical reaction processes can be elucidated. The DEMS setup as illustrated in Fig. 8a includes an electrochemical cell, electrolyte reservoirs, and a peristaltic pump, with the cell comprising a working electrode (cathode) and a counter electrode (anode) separated by an anion-conducting membrane [105]. The working electrode is a nanoporous PTFE membrane coated with a thin film of the catalyst. The cathode chamber of the DEMS cell features a circular opening for the pervaporation membrane and a gas outlet for the effluent, with the catholyte continuously pumped through the chamber and recycled using a peristaltic pump.
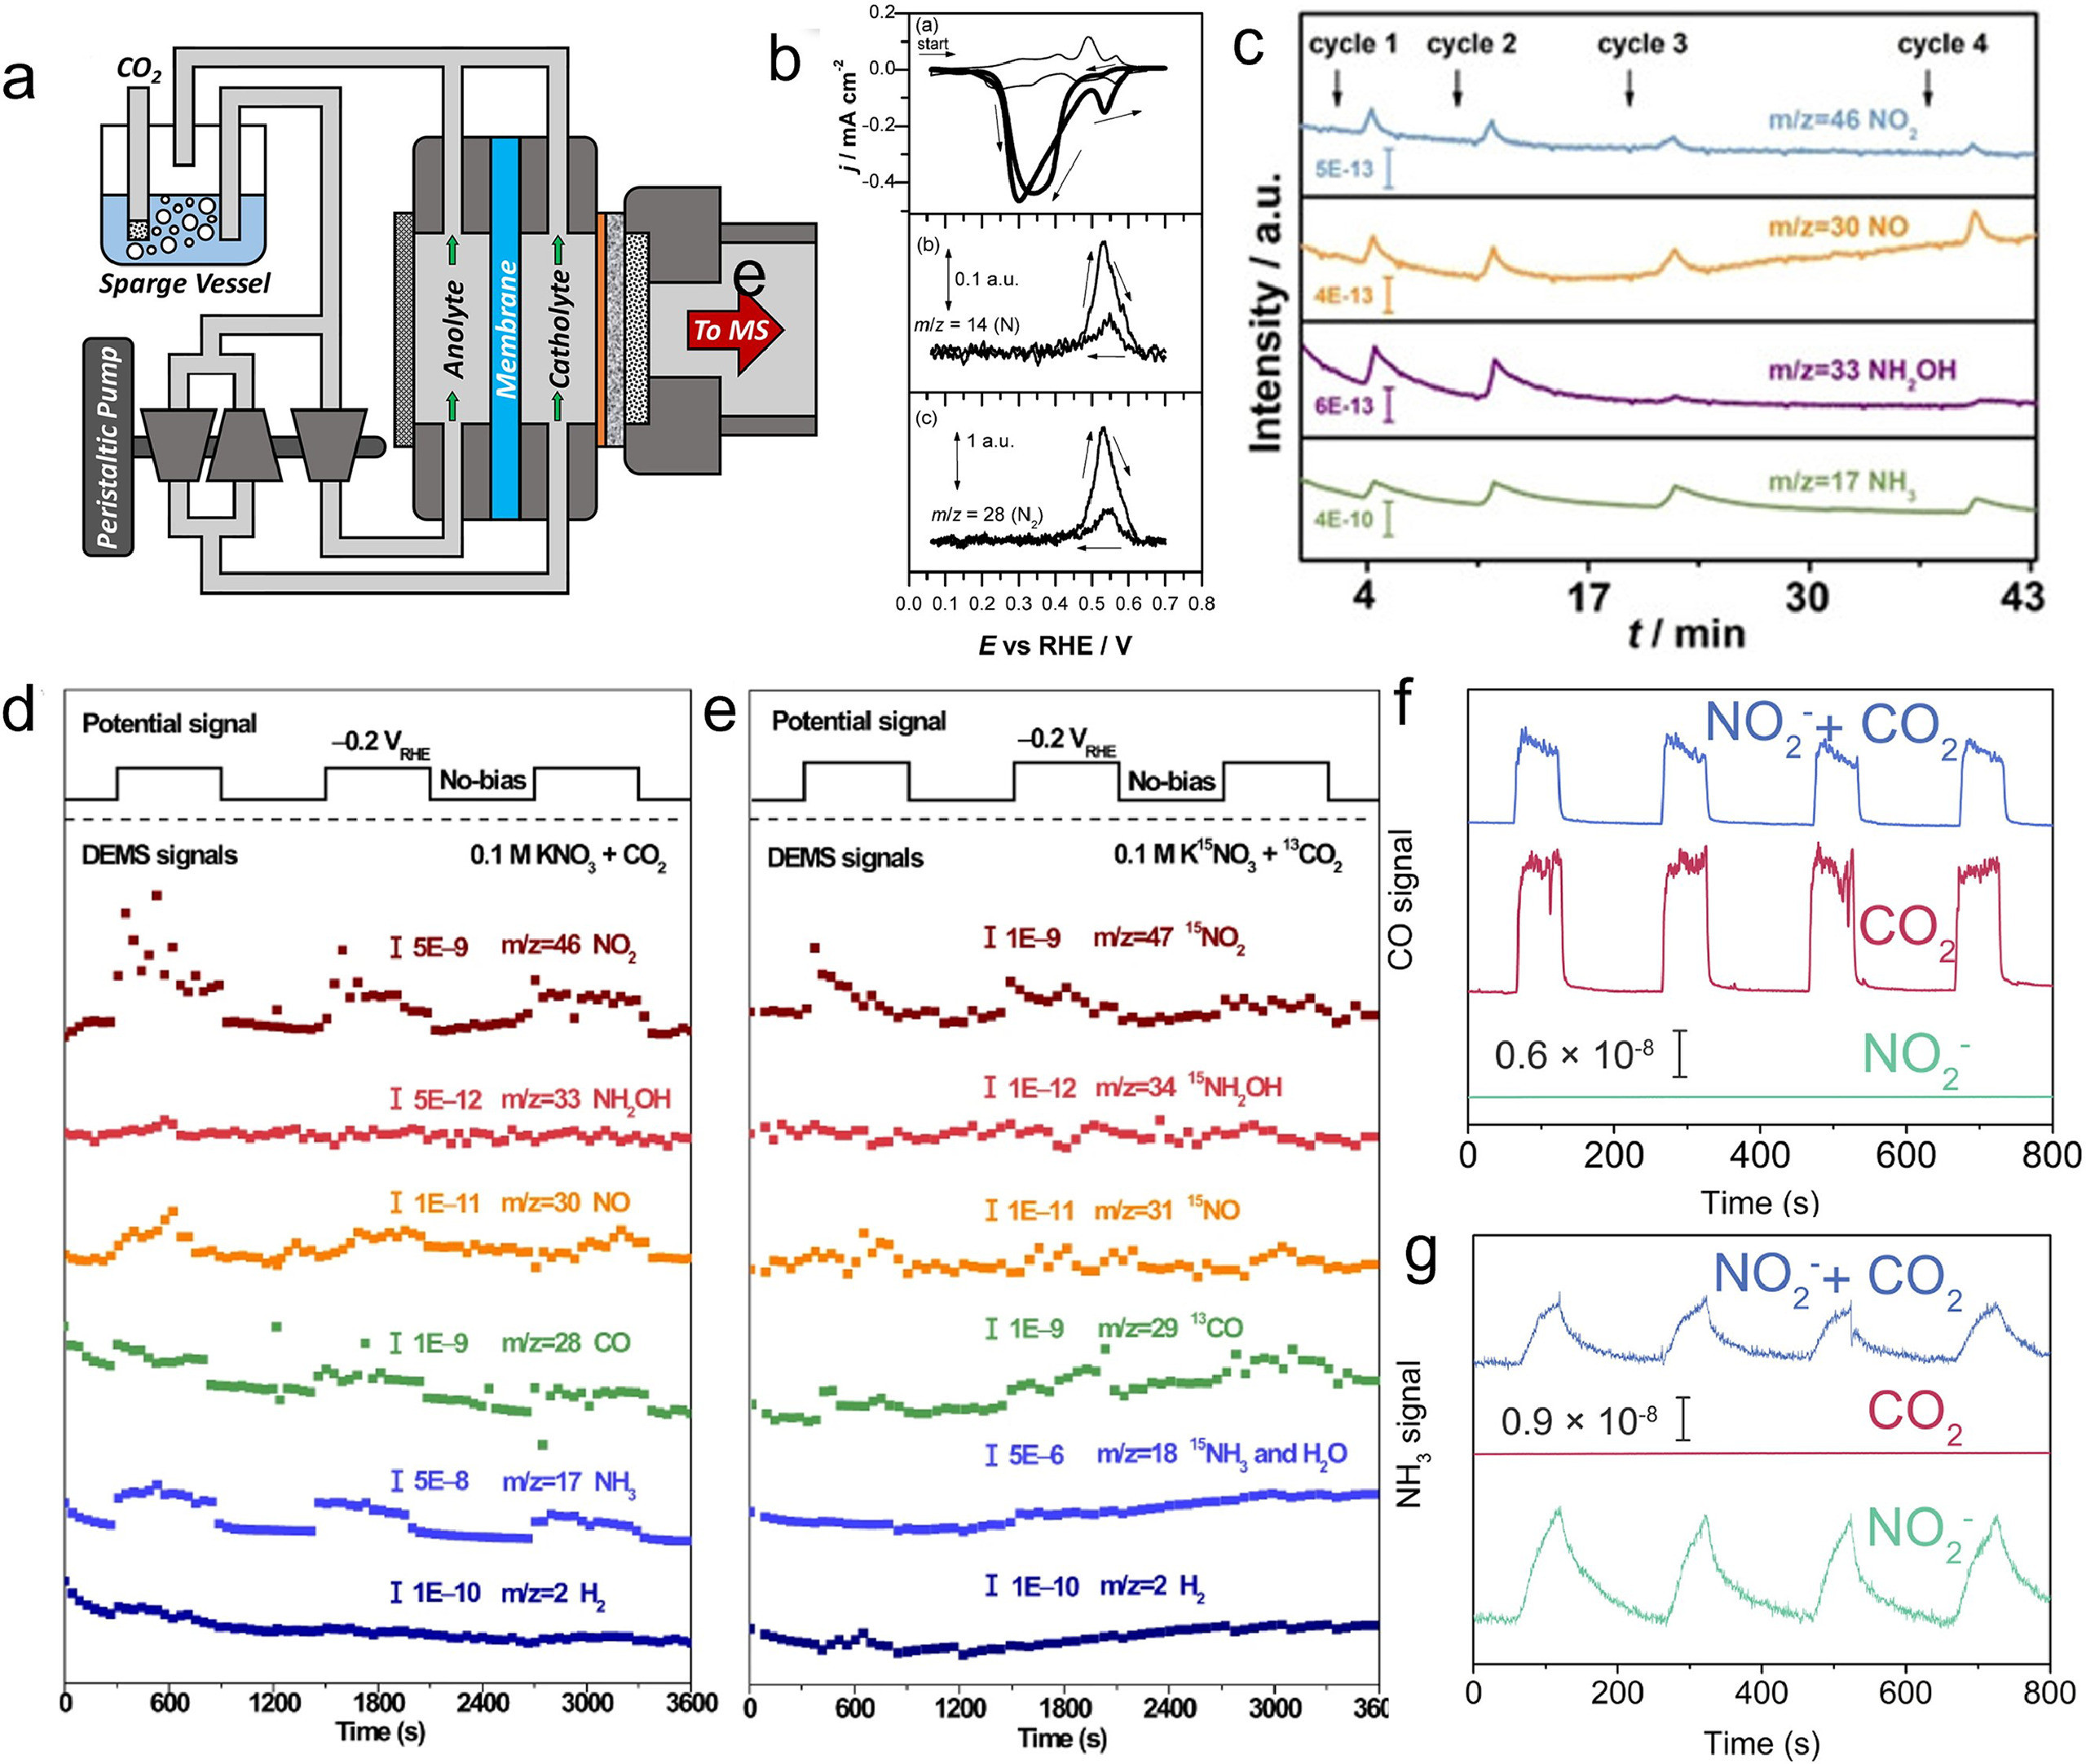
In an earlier example study reported by Koper et al., the nitrite reduction to dinitrogen has been presented on a Pt(100) electrode in 0.1 mol/L NaOH, a process that was monitored using online electrochemical mass spectrometry (OLEMS) [106]. This is the first report of such selectivity for this reaction on Pt(100), a platinum surface known for its catalytic activity towards NO2− reduction in alkaline media. The voltametric scan, as shown in Fig. 8b, displays two reduction peaks at 0.35 Ⅴ and 0.55 Ⅴ, each corresponding to different products of nitrite reduction. Interestingly, only N2 is detected as a gaseous product in the potential range of the second peak, indicating the Pt(100) electrode's ability to selectively and directly reduce nitrite to N2 without intermediates or byproducts at 0.55 Ⅴ. The first peak at 0.35 Ⅴ was attributed to the formation of ammonia, which was later oxidized to N2 at higher potentials. Through several experiments, the authors ruled out the possibility of ammonia (NH3) formation or oxidation during the N2 production. Based on these findings, they proposed a tentative reaction scheme where NO2− is first reduced to NOads and then to NH2ads, which reacted with NO2− or NOads to form N2 in a reduction reaction.
Zhang et al. developed a Cu nanowire array electrocatalyst which was transformed into Cu/Cu2O during the electrochemical nitrate reduction process [59]. The catalyst exhibited impressive performance, achieving a nitrate conversion rate of 97.0% and an ammonia yield rate of about 0.24 mmol h−1 cm−2 at −0.85 Ⅴ. DEMS was conducted to elucidate the molecular intermediates and products involved in the electroreduction of nitrate. As depicted in Fig. 8c, the m/z signals at 46, 30, 33, and 17 were identified as NO2, NO, NH2OH, and NH3, respectively. Based on these findings, a reaction pathway for nitrate electroreduction was proposed. The pathway initiated with the adsorption of NO3− to form *NO3, followed by the cleavage of N−O bonds, resulting in the production of *NO2 and *NO. Subsequently, *NO was subjected to hydrogenation, leading to the formation of *NOH, which further underwent hydrogenation to generate *NH2OH and ultimately *NH3. Finally, *NH3 was desorbed from the catalyst. The presence of the *NOH intermediate, as revealed by the DEMS results, proved advantageous for the selective synthesis of ammonia and the suppression of hydrogen evolution.
Sun et al. presented a CuWO4 catalyst that efficiently and selectively converts CO2 and NO3− into urea with a high Faradaic efficiency of 70.1% at low overpotential [107.] The design of the CuWO4 catalyst was bioinspired, with alternating Cu and W sites that mimic the nitrate reductase enzyme, stabilizing the key intermediates of *NO2 and *CO for C–N coupling. In-depth mechanistic studies and theoretical calculations were used to reveal the reaction pathways and intermediates of urea formation. In this study, DEMS was employed to monitor the evolution of CO2, N2, and NH3 during the electrosynthesis of urea from CO2 and NO3−. The results in Figs. 8d and e revealed that as the applied potential became more negative, CO2 was consumed through the reduction reaction. This was supported by the decrease in the m/z signals of 44 and 28, corresponding to CO2 and CO, respectively, as well as the m/z signal of 13, corresponding to 13CO2 when 13CO2 was used as the carbon source. N2 was generated through the reduction of NO3−, as evidenced by the slight increase in the m/z signals of 28 and 14, corresponding to N2 and N, respectively. However, N2 did not participate in the urea formation, as indicated by the absence of an increase in the m/z signal of 30, corresponding to 15N2, when K15NO3 was used as the nitrogen source. Similarly, NH3 was produced through the reduction of NO3−, as observed by the slight increase in the m/z signals of 17 and 18, corresponding to NH3 and H2O, respectively. However, NH3 did not play a role in the urea formation, as suggested by the lack of an increase in the m/z signal of 18, corresponding to 15NH3, when K15NO3 was used as the nitrogen source. These results demonstrate that the electrosynthesis of urea on a CuWO4 catalyst proceeds through a direct C−N coupling mechanism between CO2 and NO3−, without involving N2 or NH3 as intermediates. In another research reported by Zhang et al., electroreduction of CO2 and NO2− on self-supported oxygen vacancy-rich ZnO (ZnO-V) was demonstrated to generate urea with an outstanding faradaic efficiency of 23.26% at −0.79 Ⅴ vs. RHE [47]. The results obtained from DEMS analysis indicated a competitive relationship between CO2 and nitrite reduction within the oxygen vacancies. This was evidenced by the decrease in signal intensities of CO and NH3 when CO2 and nitrite were present together. Interestingly, the study proposes that urea is derived from the precursors of CO and NH3, rather than being the direct products of CO2 and nitrite reduction. This finding supports the suggested reaction pathway for urea formation, which involves the coupling of *NH2 and *COOH intermediates. These observations were specifically observed over ZnO-V, as demonstrated by the online DEMS spectra of CO and NH3 signals (Figs. 8f and g) [47]. Overall, these findings carry significant environmental implications by introducing a more sustainable and energy-efficient approach to urea production, which serves as a widely utilized fertilizer and chemical feedstock.
The electrochemical quartz crystal microbalance (EQCM) technique is a valuable method for measuring the mass change of a material during an electrochemical process [108]. This is achieved by monitoring the frequency change of a thin quartz crystal that vibrates. The underlying principle of the EQCM technique is based on the relationship between the frequency change and the mass change per unit area. In the experimental setup illustrated in Fig. 9a, a three-electrode system is utilized [109]. The working electrode consists of a gold disk attached to the quartz crystal. The counter electrode is a platinum mesh, while the reference electrode is an Ag/AgCl electrode. The quartz crystal is connected to an oscillator that interfaces with an electrochemical workstation. To ensure protection and prevent any damage, the quartz electrode is carefully positioned between two gaskets, which also serve to create a seal. Roué et al., investigated the electrocatalytic activity of a Cu electrode for the electroreduction of nitrate in alkaline medium [110]. In the study, EQCM experiments (Fig. 9b) demonstrated that the mass of the Cu-plated electrode increased as nitrate was reduced to nitrite and other products. This increase in mass indicated the adsorption of these species on the electrode surface. However, the adsorption of nitrate-reduction products hindered further nitrate reduction and decreased the electrode activity. The study found that the electrode could be reactivated by applying an anodic pulse at −0.5 Ⅴ, which resulted in the desorption of the adsorbed species.
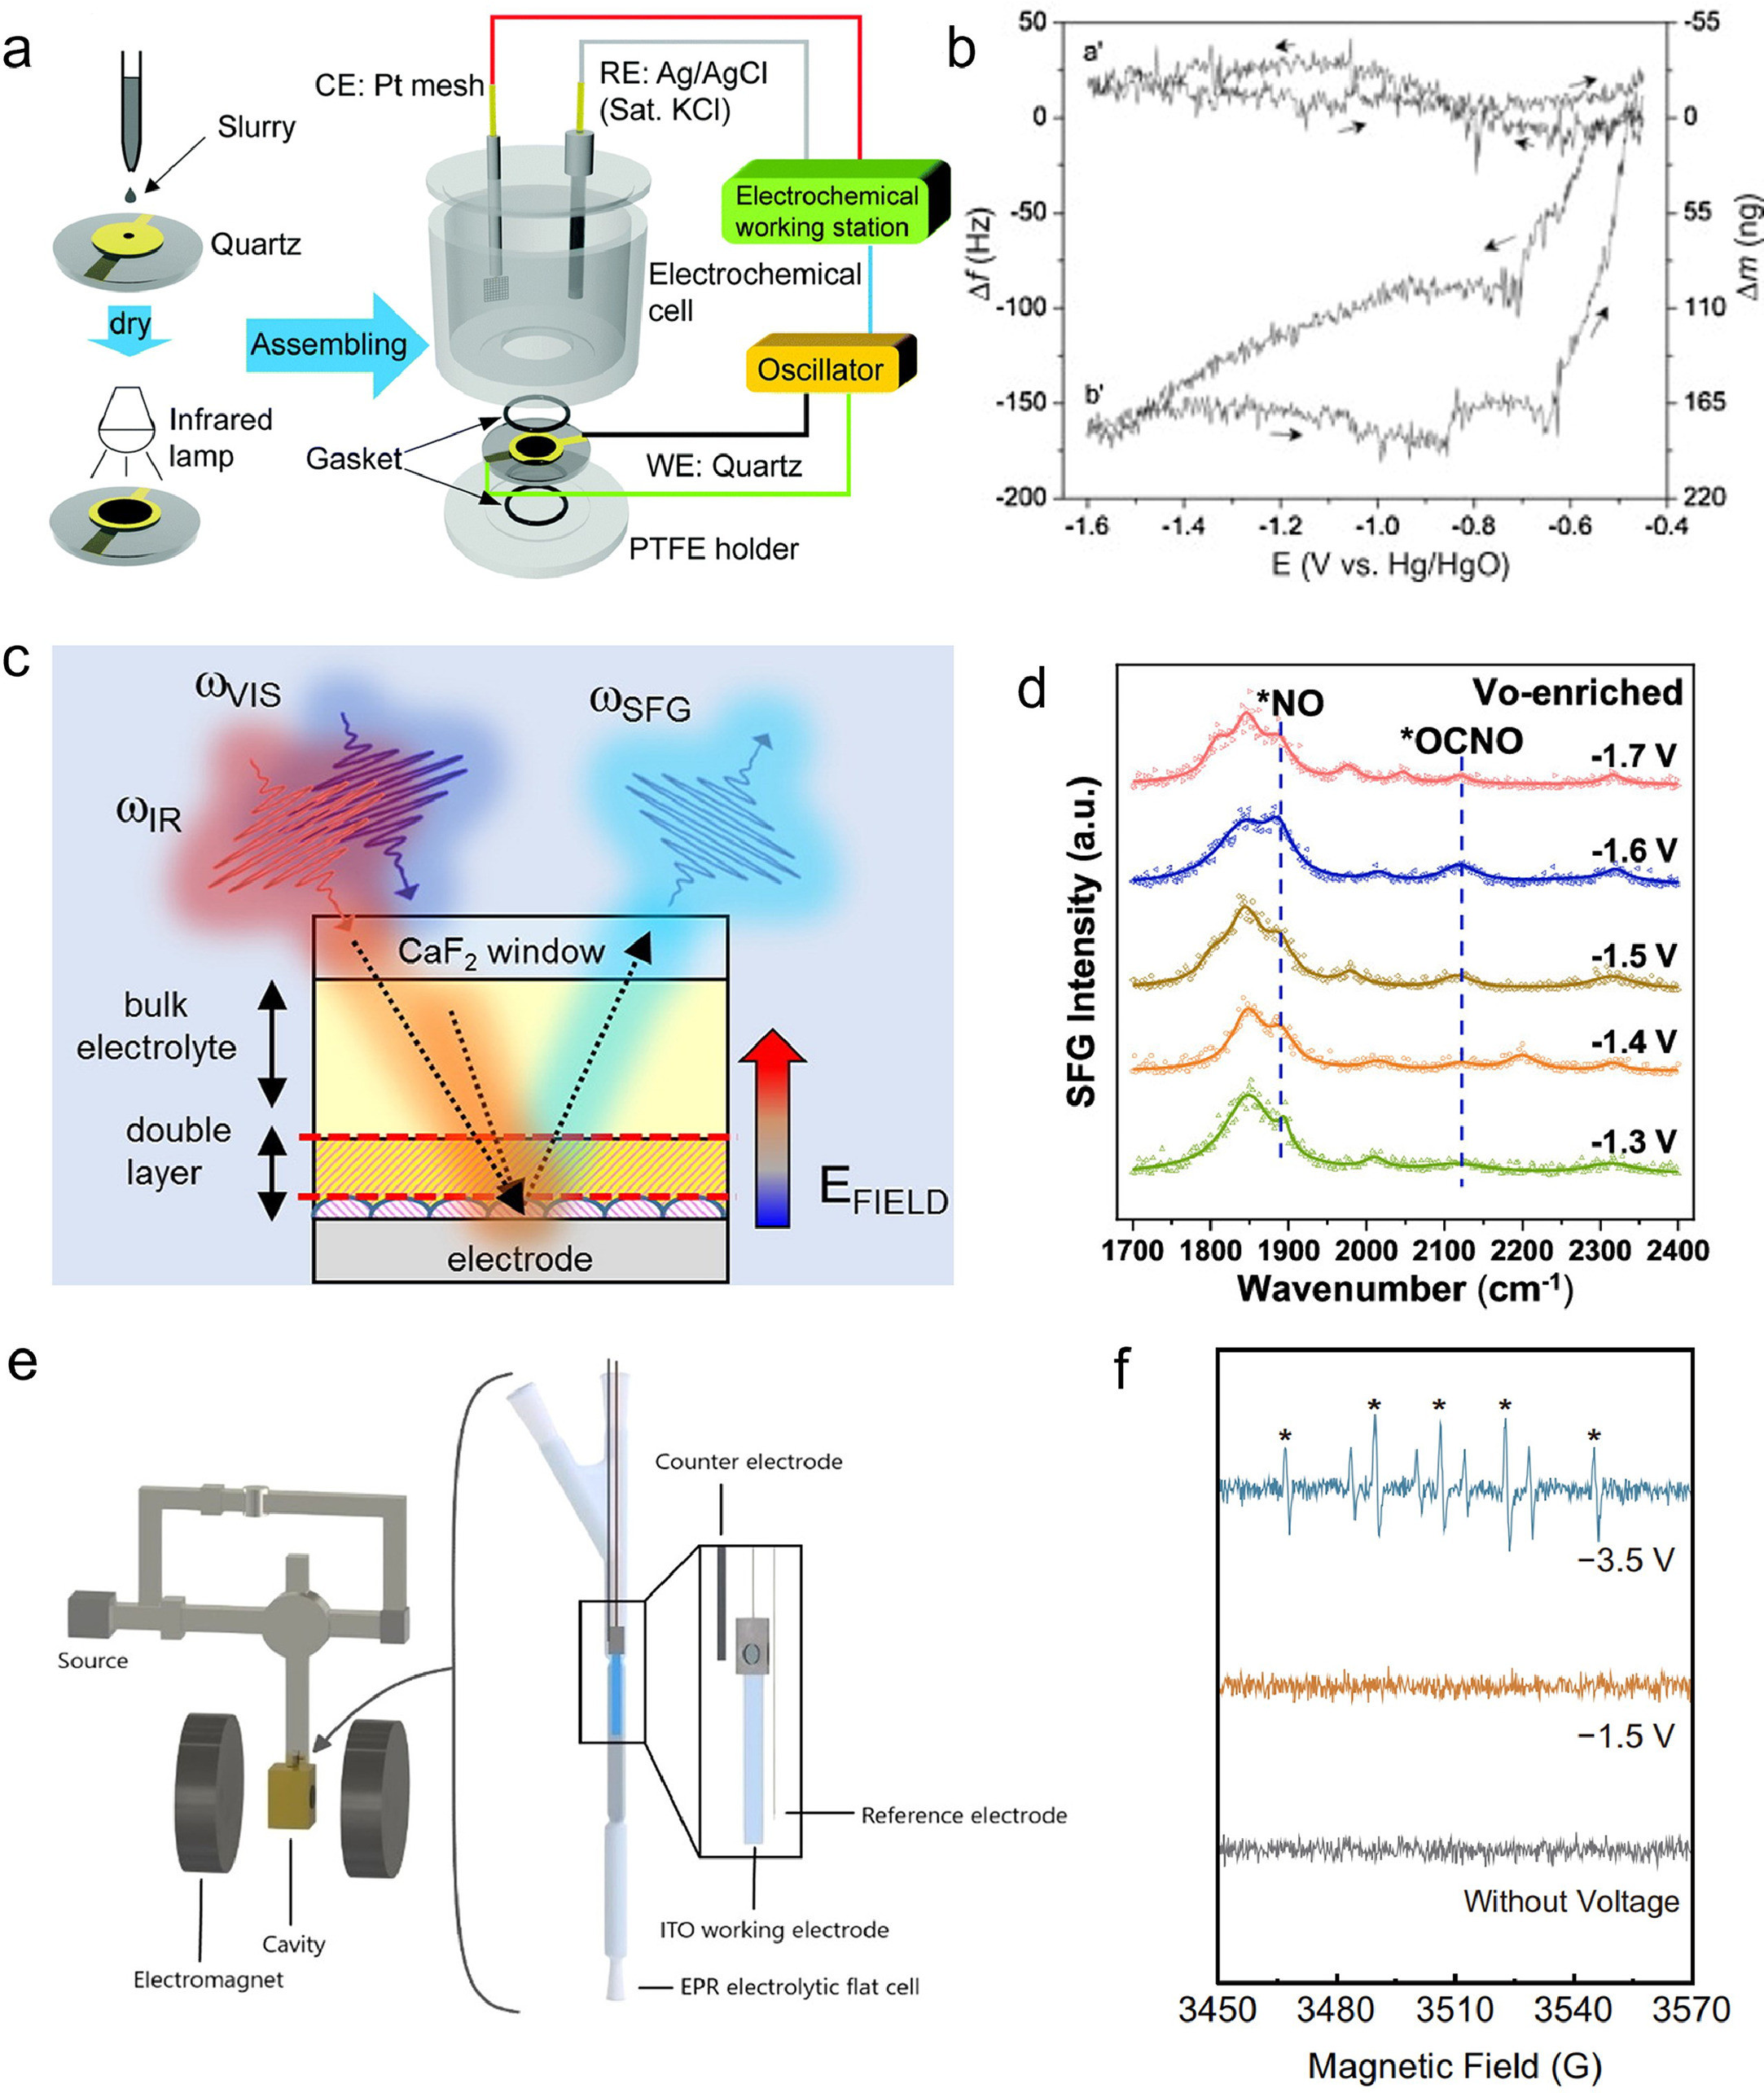
Vibrational sum-frequency generation spectroscopy (SFG) is a nonlinear optical technique that offers selective insights into the molecular structure and dynamics of electrochemical interfaces. By utilizing two laser pulses, one in the mid-infrared range and the other in the visible range, SFG generates a signal at the sum frequency. This signal contains valuable information about the vibrational modes of the interfacial molecules. Fig. 9c illustrates the fundamental setup of SFG [111]. The IR and visible pulses are directed onto the electrode surface, which is submerged beneath an electrolyte layer. The resulting SFG signal is then detected in the visible range and spectrally analyzed using a spectrograph and a CCD camera. The intensity of the SFG signal is dependent on the second- and third-order nonlinear susceptibilities of the interface, which are affected by the applied potential and the electric field of the electrode. By adjusting the frequencies of the IR pulses and manipulating the applied potential, SFG enables the monitoring of changes in the chemical composition and orientation of the adsorbed molecules on the electrode surface and within the double layer. A recent study introduced oxygen vacancies (Vo) into cerium oxide (CeO2) nanorods as the electrocatalyst for urea synthesis from nitrate and carbon dioxide under ambient conditions [112]. It demonstrated that Vo could stabilize the key intermediate of nitric oxide (*NO) and facilitate its coupling with carbon monoxide (*CO) to form *OCNO, a precursor of urea. The Vo-mediated selective C–N coupling mechanism was verified through in situ SFG (Fig. 9d) and density functional theory calculations. Among the samples, Vo-CeO2–750, which had the highest Vo concentration, showed the best electrocatalytic performance for urea synthesis. The research achieved a high urea yield rate of 943.6 mg h−1 g−1 at −1.6 Ⅴ versus reversible hydrogen electrode, outperforming some noble-metal-based electrocatalysts. It also revealed the structure–activity relationship between Vo concentration and urea yield rate.
In-situ electron paramagnetic resonance (ESR) spectroelectrochemistry is a powerful technique that combines the electrochemical generation of radicals with their EPR detection, providing valuable insights into reaction mechanisms and catalytic performance. The setup, as depicted in Fig. 9e, involves a custom-made ITO-on-PET working electrode, which is thin, conductive, and transparent to microwaves, allowing for reproducible deposition of catalytic materials [113]. An Ag-wire pseudo-reference electrode is placed close to the working electrode tip to minimize the ohmic drop, while a Pt auxiliary electrode is situated in the bulk section of the cell to avoid interference with radical detection. The electrodes are housed in a quartz flat cell, filled with electrolyte solution, and suitable for rectangular cavities and aqueous samples. The cell is connected to a rectangular cavity that enhances the sensitivity of the ESR measurements by storing the microwave energy in a resonator, which is connected to the spectrometer. Winter et al., developed a free-standing membrane that incorporates copper single-atom catalysts for efficient and selective electrochemical reduction of low-concentration nitrate in water [114]. ESR spectra displayed in Fig. 9f provide significant insights into the study. Notably, distinctive peaks corresponding to H* were only observed when the voltage is −3.5 Ⅴ vs. Ag/AgCl. This condition was notable because it signified a significant occurrence of the HER during the NitRR. Conversely, the absence of H* peaks at −1.5 Ⅴ vs. Ag/AgCl suggested that the membrane did not directly produce H* from the reduction of H+, but rather from the dissociation of H2. The presence of H* was crucial in enhancing the N2 selectivity of the NO3RR, as evidenced by the decreased N2 selectivity and increased formation of NH4+ and NO2− when H* was inhibited by t-BuOH.
In conclusion, this review provides a comprehensive overview of the recent advancements in electrocatalytic upcycling of nitrogenous waste. It addresses the urgent need for efficient and sustainable upcycling strategies due to the adverse effects of nitrogenous waste emissions on the environment and human health. Electrocatalysis has emerged as a promising solution, utilizing electrocatalysts to convert waste nitrogen compounds into valuable products through electrochemical reactions. However, several challenges need to be overcome, including the identification of suitable electrocatalysts with high activity and stability, and the understanding of reaction mechanisms and regulation of reaction pathways. To tackle these challenges, the review emphasizes the significance of advanced in situ/operando characterization techniques such as X-ray absorption, Raman spectroscopy, infrared spectroscopy, and scanning electrochemical microscopy. These techniques offer real-time insights into the structural, electronic, and chemical properties of electrocatalysts during the electrochemical reactions. By utilizing these advanced characterization techniques, researchers can guide catalyst design and overcome the challenges in electrocatalytic conversion of nitrogenous waste. The review article also provides valuable guidance for future research directions and development trends in sustainable electrocatalytic technologies for environmental restoration and resource recovery. Overall, the review highlights the importance of electrocatalytic nitrogenous species conversion as a solution for sustainable waste management and sets the stage for further advancements in the field.
For future perspectives of electrocatalytic nitrogenous waste upcycling, there is a growing need to align research efforts with the goals of environmental science and technology. It is crucial to foster collaboration and innovation by integrating relevant research from interdisciplinary fields. For instance, the emerging field of novel electrocatalytic materials has garnered significant attention [115, 116]. By combining these materials with advanced in situ characterization techniques, we can greatly advance the development of multidisciplinary approaches. This integration is anticipated to not only enhance our understanding of electrocatalytic processes but also accelerate progress in various scientific disciplines. There are three key perspectives as demonstrated in Fig. 10 that researchers should consider for future advancements in this area.
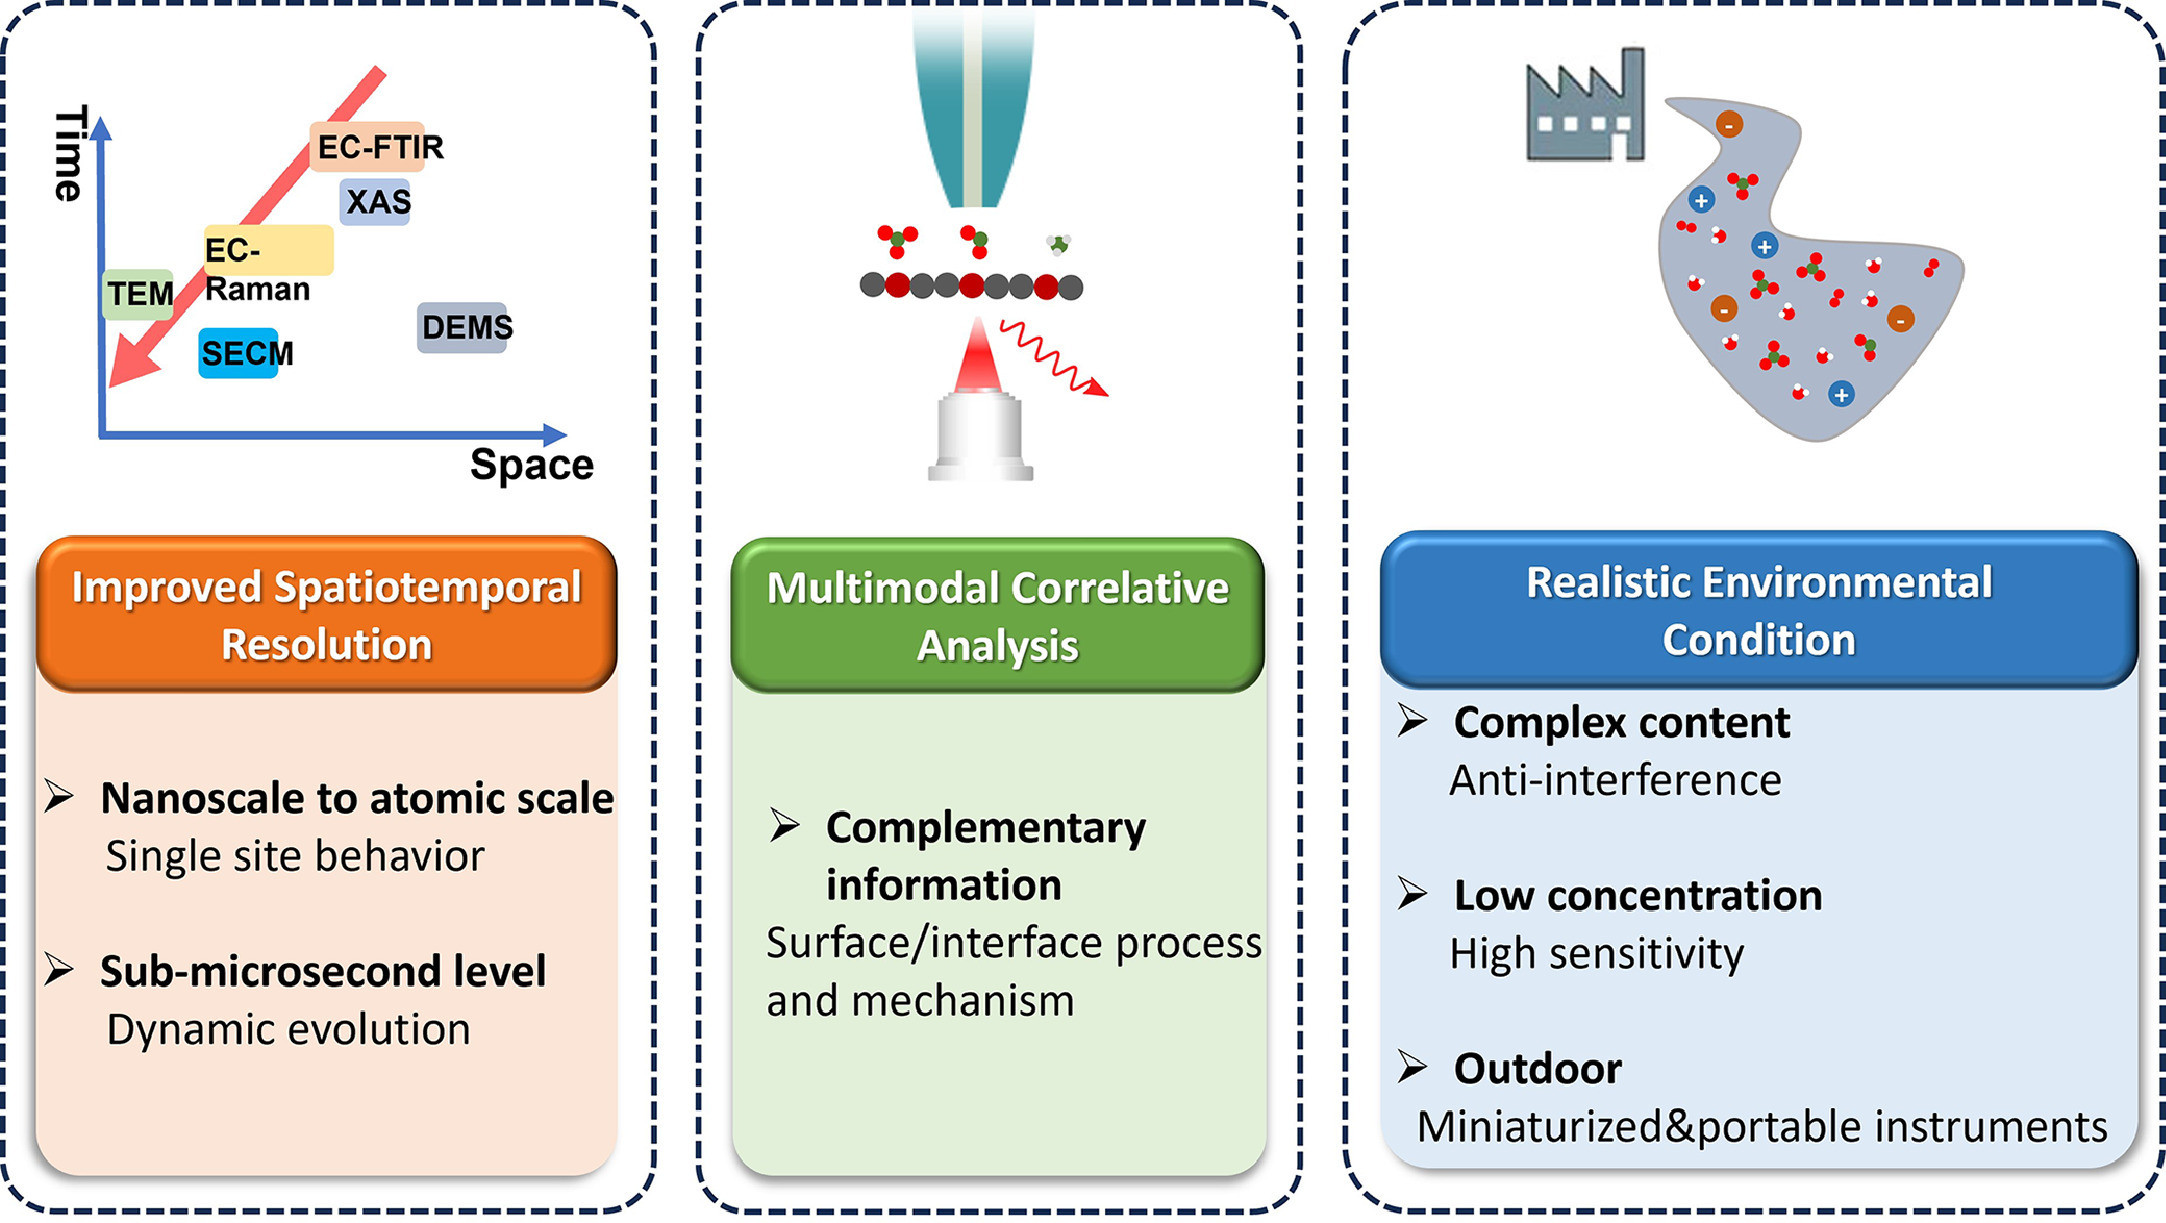
To advance our understanding of nitrogenous waste upcycling through electrocatalytic processes, it is crucial to extend both spatial and temporal resolution in characterization techniques. By pushing the boundaries of existing techniques like X-ray absorption, Raman spectroscopy, infrared spectroscopy, and scanning probe microscopy, we can enhance spatial resolution from the nanoscale to the atomic scale, enabling the probing of intrinsic behavior at the level of single catalytic sites. This provides valuable insights into their fundamental properties and reactivity, thereby facilitating the development of more efficient and selective catalysts. Additionally, improving temporal resolution to the sub-microsecond level allows us to study the dynamic evolution during catalysis [117-120]. Real-time observation of changes in electrocatalytic processes and the precise identification of transient intermediates and reaction pathways contribute to a better understanding of catalytic kinetics and mechanisms. The combination of enhanced spatial and temporal resolution provides a comprehensive understanding of electrocatalytic nitrogenous waste upcycling, including the observation of atomic-scale structural changes, dynamics, and the identification of key factors influencing catalytic efficiency and selectivity. Ultimately, these advancements will drive the development of more sustainable and effective catalysts for nitrogenous waste upcycling.
To obtain a comprehensive understanding of environmental electrocatalysis and facilitate the quantification of structure-activity relationships, the development of multimodal correlative techniques is of utmost importance. These techniques not only enhance the resolution of individual characterization methods but also allow for the integration of multiple techniques to obtain complementary information from various perspectives. By combining spectroscopy, microscopy, and electrochemical measurements, researchers can gather a wide range of data that provides a more holistic view of the electrocatalytic processes [121-124]. The integration of these techniques enables researchers to establish correlations between the structural, electronic, and chemical properties of electrocatalysts and their catalytic activity and selectivity. By analyzing the obtained data, researchers can identify the key factors influencing the performance of electrocatalysts and gain insights into the underlying mechanisms. This, in turn, enables the development of design principles for the rational design and synthesis of highly efficient electrocatalysts that align with environmental goals. The application of multimodal correlative techniques offers several advantages. Firstly, it allows for a more comprehensive characterization of electrocatalysts by providing complementary information that cannot be obtained through a single technique alone. Secondly, it enables researchers to overcome the limitations of individual techniques and obtain a more accurate and reliable assessment of the electrocatalytic performance. Finally, it facilitates the identification of structure-activity relationships by correlating different properties with the observed catalytic behavior. In conclusion, the development and application of multimodal correlative techniques play a crucial role in advancing our understanding of environmental electrocatalysis. These techniques offer a comprehensive and integrated approach to characterizing electrocatalysts, allowing for the quantification of structure-activity relationships. By harnessing the power of these techniques, researchers can uncover new insights and design principles that pave the way for the development of highly efficient electrocatalysts that address environmental challenges.
To bridge the gap between laboratory-scale experiments and real-world applications, it is crucial to develop characterization techniques that permit in situ/operando characterization of electrocatalysis under realistic environments. These techniques should be capable of handling complex content and anti-interference challenges commonly encountered in real-world scenarios, while also exhibiting high sensitivity to low concentrations of nitrogenous species for accurate detection and analysis [125-127]. Additionally, the development of minimized and portable instruments for outdoor onsite studies is essential to facilitate practicality and convenience. By conducting experiments under relevant operating conditions, such as varying pH, temperature, and gas composition, researchers can directly observe the behavior of electrocatalysts in practical settings, gaining valuable insights into stability, durability, and performance. Furthermore, in situ/operando characterization techniques help understand the effects of impurities, side reactions, and potential catalyst poisoning on electrocatalytic systems. Effectively addressing these challenges enables development of characterization techniques that offer high sensitivity, robustness, and sustainability, facilitating efficient upcycling of nitrogenous waste. The portability and convenience of instruments used for in situ/operando characterization contribute to their widespread use in outdoor onsite studies.
Overall, the future of electrocatalytic nitrogenous waste upcycling research lies in aligning efforts with the goals of environmental science and technology. By further improving the spatial and temporal resolution of characterization techniques, developing multimodal correlative techniques, and permitting in situ/operando characterization under realistic environments, researchers can contribute to the development of sustainable waste management technologies. These advancements will pave the way for effective environmental restoration and resource recovery, addressing the pressing challenges associated with nitrogenous waste emissions.
The authors declare that they have no known competing financial interests or personal relationships that could have appeared to influence the work reported in this paper.
Zhaoyu Jin: Writing – original draft. Renjun Guan: Writing – review & editing, Software. Xin Li: Writing – review & editing. Dunyi Yuan: Writing – review & editing. Panpan Li: Writing – review & editing, Project administration.
This work was supported by the National Key Research and Development Project (No. 2022YFA1505300), National Nature Science Foundation of China (Nos. 52202372 and 22304021), and Sichuan Science and Technology Program (Nos. 2023NSFSC0089 and 2023NSFSC0436).
T.W. Kim, K. Lee, R.G. Najjar, et al., Science 334 (2011) 505–509. doi: 10.1126/science.1206583
C. Yu, X. Huang, H. Chen, et al., Nature 567 (2019) 516–520. doi: 10.1038/s41586-019-1001-1
J.N. Galloway, A.R. Townsend, J.W. Erisman, et al., Science 320 (2008) 889–892. doi: 10.1126/science.1136674
C.V. Preble, R.A. Harley, T.W. Kirchstetter. Environ. Sci. Technol. 53 (2019) 14568–14576. doi: 10.1021/acs.est.9b04763
Z. Hu, J.W. Lee, K. Chandran, et al., Environ. Sci. Technol. 46 (2012) 6470–6480. doi: 10.1021/es300110x
G. Walton. Am. J. Public Health 41 (1951) 986–996.
S.S. Mirvish. Nature 315 (1985) 461–462. doi: 10.1038/315461c0
C. Jehanno, J.W. Alty, M. Roosen, et al., Nature 603 (2022) 803–814. doi: 10.1038/s41586-021-04350-0
W. Zheng, L. Zhu, Z. Yan, et al., Environ. Sci. Technol. 55 (2021) 13231–13243. doi: 10.1021/acs.est.1c02278
J. Sun, S. Garg, J. Xie, et al., Environ. Sci. Technol. 56 (2022) 17298–17309. doi: 10.1021/acs.est.2c06033
Y. Xue, Q. Yu, Q. Ma, et al., Environ. Sci. Technol. 56 (2022) 14797–14807. doi: 10.1021/acs.est.2c04456
Z. Chen, H. Yin, C. Wang, et al., Environ. Sci. Technol. 55 (2021) 9285–9292. doi: 10.1021/acs.est.1c01749
K. Zuo, S. Garcia-Segura, G.A. Cerrón-Calle, et al., Nat. Rev. Mater. 8 (2023) 472–490. doi: 10.1038/s41578-023-00564-y
K. Zheng, Y. Wu, Z. Hu, et al., Chem. Soc. Rev. 52 (2023) 8–29. doi: 10.1039/d2cs00688j
H. Xu, Y. Ma, J. Chen, et al., Chem. Soc. Rev. 51 (2022) 2710–2758. doi: 10.1039/d1cs00857a
Y. Guo, J. Bae, Z. Fang, et al., Chem. Rev. 120 (2020) 7642–7707. doi: 10.1021/acs.chemrev.0c00345
P.H. van Langevelde, I. Katsounaros, M.T.M. Koper. Joule 5 (2021) 290–294.
R. Li, T. Gao, P. Wang, et al., Appl. Catal. B 331 (2023) 122677.
R. Li, T. Gao, W. Qiu, et al., Nano Res. 17 (2023) 2438–2443. doi: 10.3390/ma16062438
T. Gao, L. Qiu, M. Xie, et al., Mater. Horiz. 10 (2023) 4270–4277. doi: 10.1039/d3mh00882g
T. Gao, X. Tang, X. Li, et al., ACS Catal. 13 (2023) 49–59. doi: 10.1021/acscatal.2c04586
Z.W. Seh, J. Kibsgaard, C.F. Dickens, et al., Science 355 (2017) eaad4998.
Z. Jin, P. Li, Z. Fang, G. Yu. Acc. Chem. Res. 55 (2022) 759–769. doi: 10.1021/acs.accounts.1c00785
P. Wang, Z. Jin, P. Li, G. Yu. Chem Catal. 2 (2022) 1277–1287.
Y. Liu, W. Qiu, P. Wang, et al., Appl. Catal. B 340 (2024) 123228.
W. Qiu, M. Xie, P. Wang, et al., Small 19 (2023) 2300437.
P. Li, Z. Fang, Z. Jin, G. Yu. Chem. Phys. Rev. 2 (2021) 041305.
M. Xie, B. Zhang, Z. Jin, et al., ACS Nano 16 (2022) 13715–13727. doi: 10.1021/acsnano.2c05190
Y. Liu, K. Liu, P. Wang, et al., Carb. Neutrality 2 (2023) 14.
M. Xie, S. Tang, Z. Li, et al., J. Am. Chem. Soc. 145 (2023) 13957–13967. doi: 10.1021/jacs.3c03432
Y. Yang, Y. Xiong, R. Zeng, et al., ACS Catal. 11 (2021) 1136–1178. doi: 10.1021/acscatal.0c04789
J. Li, J. Gong. Energy Environ. Sci. 13 (2020) 3748–3779. doi: 10.1039/d0ee01706j
X. Zhang, E.A. Davidson, D.L. Mauzerall, et al., Nature 528 (2015) 51–59. doi: 10.1038/nature15743
L.F. Greenlee. Nat. Energy 5 (2020) 557–558. doi: 10.1038/s41560-020-0670-1
B.T. Nolan, K.J. Hitt. Environ. Sci. Technol. 40 (2006) 7834–7840. doi: 10.1021/es060911u
S. Garcia-Segura, M. Lanzarini-Lopes, K. Hristovski, P. Westerhoff. Appl. Catal. B 236 (2018) 546–568.
V. Rosca, M. Duca, M.T. de Groot, M.T.M. Koper. Chem. Rev. 109 (2009) 2209–2244. doi: 10.1021/cr8003696
H. Wang, J. Huang, J. Cai, et al., Small Methods 7 (2023) 2300169.
J.G. Chen, R.M. Crooks, L.C. Seefeldt, et al., Science 360 (2018) eaar6611.
J. Long, S. Chen, Y. Zhang, et al., Angew. Chem. Int. Ed. 59 (2020) 9711–9718. doi: 10.1002/anie.202002337
L. Ouyang, J. Liang, Y. Luo, et al., Chin. J. Catal. 50 (2023) 6–44.
Y. Zang, Q. Wu, S. Wang, et al., J. Phys. Chem. Lett. 13 (2022) 527–535. doi: 10.1021/acs.jpclett.1c03938
Z. Tao, C.L. Rooney, Y. Liang, H. Wang. J. Am. Chem. Soc. 143 (2021) 19630–19642. doi: 10.1021/jacs.1c10714
M. Shibata, K. Yoshida, N. Furuya. J. Electroanal. Chem. 387 (1995) 143–145.
M. Shibata, K. Yoshida, N. Furuya. J. Electroanal. Chem. 442 (1998) 67–72.
M. Shibata, K. Yoshida, N. Furuya. J. Electrochem. Soc. 145 (1998) 595. doi: 10.1149/1.1838309
N. Meng, Y. Huang, Y. Liu, et al., Cell Rep. Phys. Sci. 2 (2021) 100378.
C. Lv, L. Zhong, H. Liu, et al., Nat. Sustain. 4 (2021) 868–876. doi: 10.1038/s41893-021-00741-3
Y. Zhu, J. Wang, H. Chu, et al., ACS Energy Lett. 5 (2020) 1281–1291. doi: 10.1021/acsenergylett.0c00305
J. Timoshenko, B. Roldan Cuenya. Chem. Rev. 121 (2021) 882–961. doi: 10.1021/acs.chemrev.0c00396
Y.Y. Birdja, E. Pérez-Gallent, M.C. Figueiredo, et al., Nat. Energy 4 (2019) 732–745. doi: 10.1038/s41560-019-0450-y
X. Li, S. Wang, L. Li, et al., J. Am. Chem. Soc. 142 (2020) 9567–9581.
Y. Wang, A. Xu, Z. Wang, et al., J. Am. Chem. Soc. 142 (2020) 5702–5708. doi: 10.1021/jacs.9b13347
J. Li, G. Zhan, J. Yang, et al., J. Am. Chem. Soc. 142 (2020) 7036–7046. doi: 10.1021/jacs.0c00418
P. Li, Z. Jin, Z. Fang, G. Yu. Energy Environ. Sci. 14 (2021) 3522–3531. doi: 10.1039/d1ee00545f
W. He, J. Zhang, S. Dieckhöfer, et al., Nat. Commun. 13 (2022) 1129.
K. Fan, W. Xie, J. Li, et al., Nat. Commun. 13 (2022) 7958.
Y. Wang, W. Zhou, R. Jia, et al., Angew. Chem. Int. Ed. 59 (2020) 5350–5354. doi: 10.1002/anie.201915992
H.D. Abruna. Electrochemical Interfaces: Modern Techniques For In-Situ Interface Characterization, VCH, New York, 1991.
J. Yano, V.K. Yachandra. Photosynth. Res. 102 (2009) 241–254. doi: 10.1007/s11120-009-9473-8
J. Timoshenko, H.S. Jeon, I. Sinev, et al., Chem. Sci. 11 (2020) 3727–3736. doi: 10.1039/d0sc00382d
F.Y. Chen, Z.Y. Wu, S. Gupta, et al., Nat. Nanotechnol. 17 (2022) 759–767. doi: 10.1038/s41565-022-01121-4
J. Yang, H. Qi, A. Li, et al., J. Am. Chem. Soc. 144 (2022) 12062–12071. doi: 10.1021/jacs.2c02262
X. Li, P. Shen, Y. Luo, et al., Angew. Chem. Int. Ed. 61 (2022) e202205923.
X. Chen, S. Lv, J. Kang, et al., Proc. Nat. Acad. Sci. 120 (2023) e2306841120.
W. Zheng. Chem. Methods 3 (2023) e202200042.
R. Daiyan, T. Tran-Phu, P. Kumar, et al., Energy Environ. Sci. 14 (2021) 3588–3598. doi: 10.1039/d1ee00594d
L. Bian, Z. -Y. Zhang, H. Tian, et al., Chin. J. Catal. 54 (2023) 199–211.
Y. Wang, C. Wang, M. Li, et al., Chem. Soc. Rev. 50 (2021) 6720–6733. doi: 10.1039/d1cs00116g
W. Gao, K. Xie, J. Xie, et al., Adv. Mater. 35 (2023) 2202952.
Y. Huang, C. He, C. Cheng, et al., Nat. Commun. 14 (2023) 7368.
Y. Wang, Y. Xu, C. Cheng, et al., Angew. Chem. Int. Ed. 63 (2024) e202315109.
S. Han, H. Li, T. Li, et al., Nat. Catal. 6 (2023) 402–414. doi: 10.1038/s41929-023-00951-2
Z. Chang, G. Meng, Y. Chen, et al., Adv. Mater. 35 (2023) 2304508.
J. Zhao, Y. Yuan, F. Zhao, et al., Appl. Catal. B 340 (2024) 123265.
T. Matsui, S. Suzuki, Y. Katayama, et al., Langmuir 31 (2015) 11717–11723. doi: 10.1021/acs.langmuir.5b02330
H. Tian, Z. -Y. Zhang, H. Fang, et al., Appl. Catal. B 351 (2024) 124001.
J. Zhang, J. -J. Dai, D. -Q. Cao, et al., J. Energy Chem. 83 (2023) 313–323. doi: 10.3390/agronomy13020313
J. -T. Li, Z. -Y. Zhou, I. Broadwell, S. -G. Sun. Acc. Chem. Res. 45 (2012) 485–494. doi: 10.1021/ar200215t
J. -Y. Fang, Q. -Z. Zheng, Y. -Y. Lou, et al., Nat. Commun. 13 (2022) 7899.
X. Zhang, X. Zhu, S. Bo, et al., Nat. Commun. 13 (2022) 5337.
H. Li, Y. Guo, Z. Jin. Carb. Neutrality 2 (2023) 22.
A.J. Bard, F.R.F. Fan, J. Kwak, O. Lev. Anal. Chem. 61 (1989) 132–138. doi: 10.1021/ac00177a011
J. Kim, J.E. Dick, A.J. Bard. Acc. Chem. Res. 49 (2016) 2587–2595. doi: 10.1021/acs.accounts.6b00340
Z. Jin. Anal. Chem. 95 (2023) 6477–6489. doi: 10.1021/acs.analchem.2c05755
J. Xu, H. Gao, F. Wang, M. Zhou. Curr. Opin. Electrochem. 39 (2023) 101299.
Z. Jin, A.J. Bard. Angew. Chem. Int. Ed. 60 (2021) 794–799. doi: 10.1002/anie.202008052
P. Li, Z. Jin, Y. Qian, et al., Mater. Today 35 (2020) 78–86.
P. Li, Z. Jin, Y. Qian, et al., ACS Energy Lett. 4 (2019) 1793–1802. doi: 10.1021/acsenergylett.9b00893
K. Liu, H. Li, M. Xie, et al., J. Am. Chem. Soc. 146 (2024) 7779–7790. doi: 10.1021/jacs.4c00429
J. Kim, C. Renault, N. Nioradze, et al., Anal. Chem. 88 (2016) 10284–10289. doi: 10.1021/acs.analchem.6b03024
Y.L. Liu, Y.X. Zhao, Y.B. Li, et al., J. Anal. Test. 6 (2022) 178–192.
H. Gao, J. Xu, X. Zhang, M. Zhou. Angew. Chem. Int. Ed. 63 (2024) e202404663.
H. Gao, J. Xu, C. Liu, et al., Anal. Chem. 94 (2022) 14092–14098. doi: 10.1021/acs.analchem.2c02296
H.S. Ahn, A.J. Bard. J. Am. Chem. Soc. 138 (2016) 313–318. doi: 10.1021/jacs.5b10977
H.S. Ahn, A.J. Bard. J. Am. Chem. Soc. 137 (2015) 612–615. doi: 10.1021/ja511740h
Z. Liang, H.S. Ahn, A.J. Bard. J. Am. Chem. Soc. 139 (2017) 4854–4858. doi: 10.1021/jacs.7b00279
H.S. Ahn, A.J. Bard. Anal. Chem. 87 (2015) 12276–12280. doi: 10.1021/acs.analchem.5b03542
Y. Pan, X. Shan, F. Cai et al., , Angew. Chem. Int. Ed. 63 (2024) e202407116.
H. Li, P. Li, Y. Guo, Z. Jin. Anal. Chem. 96 (2024) 997–1002.
P. Li, L. Liao, Z. Fang, et al., Proc. Natl. Acad. Sci. 120 (2023) e2305489120.
P. Li, R. Li, Y. Liu, et al., J. Am. Chem. Soc. 145 (2023) 6471–6479. doi: 10.1021/jacs.3c00334
A.A. Abd-El-Latif, C.J. Bondue, S. Ernst, et al., Trac-Trend. Anal. Chem. 70 (2015) 4–13.
W. Chen, F. He, Y. -X. Chen. Curr. Opin. Electrochem. 42 (2023) 101393.
E.L. Clark, A.T. Bell. J. Am. Chem. Soc. 140 (2018) 7012–7020. doi: 10.1021/jacs.8b04058
M. Duca, M.O. Cucarella, P. Rodriguez, M.T.M. Koper. J. Am. Chem. Soc. 132 (2010) 18042–18044. doi: 10.1021/ja1092503
Y. Zhao, Y. Ding, W. Li, et al., Nat. Commun. 14 (2023) 4491.
N. Shpigel, M.D. Levi, S. Sigalov, et al., Acc. Chem. Res. 51 (2018) 69–79. doi: 10.1021/acs.accounts.7b00477
M. Yao, P. Wu, S. Cheng, et al., Phys. Chem. Chem. Phys. 19 (2017) 24689–24695.
D. Reyter, D. Bélanger, L. Roué. Electrochim. Acta 53 (2008) 5977–5984.
N.G. Rey, D.D. Dlott. J. Electroanal. Chem. 800 (2017) 114–125.
X. Wei, X. Wen, Y. Liu, et al., J. Am. Chem. Soc. 144 (2022) 11530–11535. doi: 10.1021/jacs.2c03452
S. Neukermans, M. Samanipour, H.Y. Vincent Ching, et al., ChemElectroChem 7 (2020) 4578–4586. doi: 10.1002/celc.202001193
X. Wang, X. Wu, W. Ma, et al., Proc. Nat. Acad. Sci. 120 (2023) e2217703120.
B. Jiang, J. Zhu, Z. Xia, et al., Adv. Mater. 36 (2024) 2310699.
L. Zhang, J. Zhu, X. Li, et al., Interdiscip. Mater. 1 (2022) 51–87. doi: 10.1002/idm2.12011
H. Li, X. Zhang, Z. Sun, W. Ma. J. Am. Chem. Soc. 144 (2022) 16480–16489. doi: 10.1021/jacs.2c05299
Z. Gu, J. Le, H. Wei, et al., Chin. Chem. Lett. 35 (2023) 108849.
M. Kang, C.L. Bentley, J.T. Mefford, et al., ACS Nano 17 (2023) 21493–21505. doi: 10.1021/acsnano.3c06335
O.J. Wahab, E. Daviddi, B. Xin, et al., Nature 620 (2023) 782–786. doi: 10.1038/s41586-023-06247-6
J.T. Mefford, A.R. Akbashev, M. Kang, et al., Nature 593 (2021) 67–73. doi: 10.1038/s41586-021-03454-x
D. Martín-Yerga, P.R. Unwin, D. Valavanis, X. Xu. Curr. Opin. Electrochem. 42 (2023) 101405.
N.B. Schorr, Z.T. Gossage, J. Rodríguez-López. Curr. Opin. Electrochem. 8 (2018) 89–95.
H.M. Li, S.P. Li, R.J. Guan, et al., ACS Catal. 14 (2024) 12042–12050. doi: 10.1021/acscatal.4c03245
N. Singh, B.R. Goldsmith. ACS Catal. 10 (2020) 3365–3371. doi: 10.1021/acscatal.9b04167
J.F. Tan, A. Anastasi, S. Chandra. Curr. Opin. Electrochem. 32 (2022) 100926.
X. Chen, H. Pu, Z. Fu, et al., Environ. Sci. Nano 5 (2018) 1990–1999. doi: 10.1039/c8en00588e

Figure 1 Conceptual overview of nitrogenous waste conversion for value-added products and energy production.

Figure 3 In-situ/Operando characterization techniques for studying electrochemical nitrogenous species conversion. (a-f) Represented spectra of X-ray spectroscopy, scanning electrochemical microscopy (SECM), differential electrochemical mass spectrometry (DEMS) and electron paramagnetic resonance (EPR). (a) Reproduced with permission [53]. Copyright 2020, American Chemical Society. (b) Reproduced with permission [55]. Copyright 2021, Royal Society of Chemistry. (c, d) Reproduced with permission [56] and [57]. Copyright 2022, Springer Nature. (e) Reproduced with permission [58]. Copyright 2020, John Wiley & Sons, Inc. (f) Reproduced with permission [54]. Copyright 2020, American Chemical Society.

Figure 4 (a) Schematic of the electrochemical cell for in situ XAS measurements. (b) Cu K-edge XAS data for a Cu nanocatalyst. The insets in the Figure show schematics illustrating the photoelectron scattering process and the pre-edge region at the Cu K-edge. Reproduced with permission [50]. Copyright 2021, American Chemical Society. (c) In situ XANES at the open-circuit voltage (OCV), the 60-minute prereduction process of Ru-CuONW turning into Ru-CuNW, and the corresponding metal foil reference at the Cu K edge. Reproduced with permission [62]. Copyright 2022, Springer Nature. (d) Fourier-transformed operando Cu K-edge hard XAS spectra of the Cu50Ni50 catalyst are presented at various applied potentials. Reproduced with permission [54]. Copyright 2020, American Chemical Society. (e) Fourier-transformed EXAFS spectra of the Cu–N–C catalyst and reference samples including Cu foil, Cu2O, CuO, and CuPc. Reproduced with permission [63]. Copyright 2022, American Chemical Society. (f) Wavelet contour profile of operando XAS of PdFe1 catalysts during the N2 reduction at the potentials from circuit potential (OCP) to 0 Ⅴ, −0.2 Ⅴ and then back to OCP. Reproduced with permission [64]. Copyright 2022, John Wiley & Sons, Inc. (g) In situ Bi L3-edge position shifts resulting from oxidation state modulation during the catalytic process. Reproduced with permission [65]. Copyright 2023, National Academy of Science.

Figure 5 (a) Instrumental illustration of Raman spectroscopy coupled electrochemical measurement. (b) Applications of electrochemical Raman spectroscopy for studying structural transition, interfacial species detection, and electrolyte. Reproduced with permission [66]. Copyright 2023, John Wiley & Sons, Inc. (c) Operando Raman spectra of pCuO-5 were obtained by drop-casting it onto a screen-printed microelectrode (SPE) under various conditions and potentials. Reproduced with permission [67]. Copyright 2021, Royal Society of Chemistry. In situ Raman spectra of (d) Ru1Cu10 and (e) Cu obtained during nitrate NO3RR at different potentials in a mixed solution consisting of 0.1 mol/L KNO3 and 1 mol/L KOH. Reproduced with permission [70]. Copyright 2023, John Wiley & Sons, Inc. (f) Electrochemical in situ Raman spectra of 0.6W-O-CoP@NF collected at various potentials during the NO3RR in an argon-saturated electrolyte comprising 1 mol/L KOH and 0.1 mol/L NaNO3. Reproduced with permission [74]. Copyright 2023, John Wiley & Sons, Inc. Raman signals observed during (g) the co-electroreduction of NO3− and CO2 and (h) CO2RR. Reproduced with permission [75]. Copyright 2024, Elsevier.

Figure 6 (a) Schematic representation of the experimental setup for in situ ATR-IR measurements. (b) Potential-dependent IR spectra of the platinum surface in a 0.1 mol/L NH3 and 1 mol/L KOH electrolyte. Reproduced with permission [76]. Copyright 2015, American Chemical Society. (c) In situ FTIR spectra of CoP-CNS under −0.43 Ⅴ vs. RHE in a 1 mol/L OH− electrolyte with 1 mol/L NO3−. Reproduced with permission [58]. Copyright 2022, Springer Nature. (d) Electrochemical thin-layer in situ FTIR spectra of Cu50Co50 during NO3RR. Reproduced with permission [80]. Copyright 2022, Springer Nature. (e) Infrared signal in the range of 1500–3750 cm−1 observed at different potentials for B-FeNi-DASC during the electroreduction of NO3− and CO2. Reproduced with permission [81]. Copyright 2022, Springer Nature.

Figure 7 (a) An illustration of the high-resolution SECM setup. Reproduced with permission [91]. Copyright 2016, American Chemical Society. (b) Collection-generation (top) and surface interrogation mode of SECM for studying electrocatalysts at substrate. Reproduced with permission [85]. Copyright 2023, American Chemical Society. (c) Schematic of the SECM setup operated in the substrate generation-tip collection (SG-TC) mode. A Pt ultramicroelectrode (UME) was used to detect NO2− and NH3 produced during NO3RR on the Cu_Co(OH)2. Inset: SEM image of the Pt-UME tip with a scale bar of 500 nm. Two-dimensional current mapping of (d) NH3 oxidation recorded at 0.76 Ⅴ and (e) NO2− reduction recorded at 0.06 Ⅴ at the Pt-UME. Reproduced with permission [56]. Copyright 2022, Springer Nature. (f) Schematic of surface interrogation SECM for studying Fe active sites during the NO3RR. (g) Potential-dependent active site density and the corresponding oxidation state analysis obtained with SI-SECM technique. Reproduced with permission [55]. Copyright 2021, Royal Society of Chemistry. (h) Time-delay SI-SECM for measuring the kinetic rate constants of NO2RR, NO3RR and water reduction on the single-atomic Cu site. Reproduced with permission [102]. Copyright 2023, American Chemical Society.

Figure 8 (a) Schematic representation of the DEMS setup. Reproduced with permission [105]. Copyright 2018, American Chemical Society. (b) Cyclic voltammetry (top) during online electrochemical mass spectrometry (OLEMS) measurements. The working electrode used was a Pt(100) electrode, and the scan rate was set at 1 mV/s. Ion current profile for m/z = 14 (middle) and m/z = 28 (bottom) in a 0.1 mol/L NaOH solution containing 2 mmol/L NaNO2. Reproduced with permission [106]. Copyright 2010, American Chemical Society. (c) DEMS measurements of various intermediate products during the NO3RR over Cu/Cu2O NWAs. Reproduced with permission [59]. Copyright 2020, John Wiley & Sons, Inc. In situ DEMS of CuWO4 during the urea production from NO3− and CO2 co-reduction. The electrolyte contains 0.1 mol/L (d) K14NO3 or (e) K15NO3 with saturated 12CO2 or 13CO2 at −0.2 Ⅴ. Reproduced with permission [107]. Copyright 2023, Springer Nature. Online DEMS of (f) CO and (g) NH3 signals over ZnO-V in the presence of NO2− or CO2. Reproduced with permission [47]. Copyright 2021, Cell Press.

Figure 9 (a) Schematic illustration of the process of assembling the quartz electrode and constructing the EQCM cell. Reproduced with permission [109]. Copyright 2017, Elsevier. (b) Frequency/mass vs. potential curves of a Cu-plated carbon quartz crystal in 1 mol/L NaOH containing 0.1 mol/L NaNO3. Reproduced with permission [110]. Copyright 2008, Elsevier. (c) Schematic of operando broadband multiplex vibrational sum-frequency generation spectroscopy (SFG) setup. Reproduced with permission [111]. Copyright 2017, Elsevier. (d) SFG spectra of intermediate species formed on Vo-CeO2–750. Reproduced with permission [112]. Copyright 2022, American Chemical Society. (e) Setup of a typical EPR spectroscopy coupled electrochemical measurement. Reproduced with permission [113]. Copyright 2020, John Wiley & Sons, Inc. (f) EPR spectra of active hydrogen radical intermediates at −3.5, −1.5 Ⅴ, and OCP during the nitrate reduction on Cu1/NC@CNT-FEM. Reproduced with permission [114]. Copyright 2023, National Academy of Science.

 扫一扫看文章

扫一扫关注我们
 DownLoad:
 下载:
下载:


 下载:
下载: