Scheme 1.
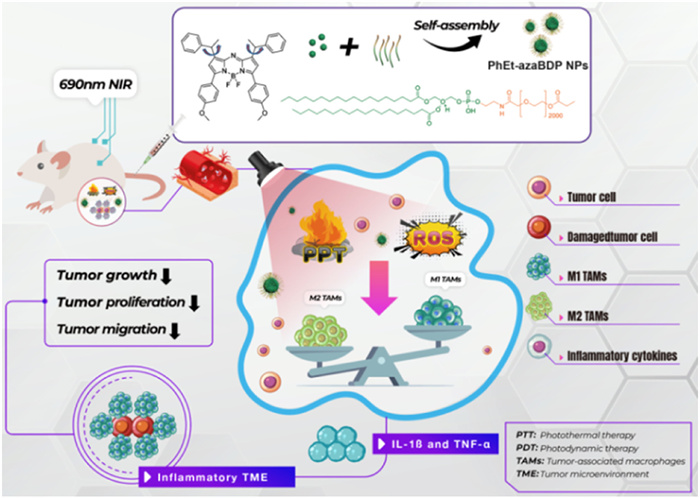
Schematic illustration of the preparation of self-assembled PhEt-azaBDP NPs and the theranostic mechanisms.
Novel 1-phenylethyl-containing aza-BDOIPY for phototherapy and simultaneous monitoring of tumor immune microenvironment reprogramming
Zhiqiang Cui , Dongxiang Zhang , Yanru Huang , Chunyu Shao , Yiming Zhang , Changliang Sun , Xin-Dong Jiang , Xiaohong Sun , Qinghuan Xiao

Tumor microenvironment (TME) plays a crucial role in tumor growth, migration and proliferation [1]. So, an important component of the TME is tumor-associated macrophages (TAMs) [2], and the TME shapes the polarization of macrophages [3]. Differentiated TAMs can further polarize into different phenotypes, which can exist in two different subtypes, M1-polarized phenotype (pro-inflammatory and tumor-suppressing) and M2-polarized phenotype (immunosuppressive and tumor-promoting) [4-6]. Repolarization of M2 to M1 TAMs has emerged as an effective option for reprogramming the TME and suppressing the tumor growth [7, 8]. Therefore, immunosuppressive TME is considered to be an opportunity for cancer treatment. Phototherapies, including photodynamic therapy (PDT) and photothermal therapy (PTT), are able to provoke an inflammatory TME through modulation of TAMs [9-13]. However, monitoring of TME modulation during the therapeutic process to accurately determine immune responses is challenging.
PDT and PTT, which generate reactive oxygen species (ROS) and heat under light irradiation, have been utilized as a non-invasive strategy for cancer treatment [14-16]. Compared with type II PDT under energy transfer mechanism, which is strongly dependent on O2 concentration, type-I PDT generate cytotoxic radicals via electron transfer, making them suitable for oxygen-deprived environments like solid tumors [17-19]. Moreover, PTT was found not to be restricted by the hypoxic environment of a tumor. PTT can induce cancer cell death through local hyperthermia generated by dye activated under light irradiation [20-24]. Therefore, type I PDT-PPT become more effective in treating tumors.
Due to the exceptional photophysical features, aza-BODIPY scaffold has shown potential in numerous intelligent fields [25]. By designing the unique structure of aza-BODIPY, the photothermal conversion efficiency and intersystem crossing (ISC) can be enhanced by restricting fluorescence. To the best of our knowledge, no case of 1-phenylethyl group at 1, 7-sites has been recorded in aza-BODIPY system. Hence, our group introduced 1-phenylethyl group to aza-BODIPY (PhEt-azaBDP) for the first time, and the rotation of 1-phenylethyl group resulted in non-radiative heat generation in the excited state. Through this property of non-radiative heat and generation of ROS from PhEt-azaBDP under light irradiation, it could be applied as phototherapy agent to treat solid tumors. The efficacy of PhEt-azaBDP nanoparticles (PhEt-azaBDP NPs) in tumor cell eradication has been demonstrated through cell and tumor inhibition experiments, wherein PhEt-azaBDP NPs effectively impede cellular proliferation and suppress tumor growth under light irradiation. Moreover, the cellular experiments showed that PhEt-azaBDP NPs with light irradiation can generate ROS and heat to induce cell death, thus inducing M1-type macrophage polarization by modulating the secretion of interleukin-1β (IL-1β) and tumor necrosis factor-α (TNF-α). In vitro and in vivo results proved that PhEt-azaBDP NPs could exert combined type I PDT-PTT and simultaneously monitor the TME reprogramming by the M1-type macrophage polarization through phototherapy (Scheme 1).
Utilizing 2-phenylpropanal as the starting material, PhEt-azaBDP with 1-phenylethyl groups at 1, 7-sites was prepared for the first time (see Supporting information). Although there are two chiral centers in the molecular structure, the optical rotation of PhEt-azaBDP is zero, suggesting that PhEt-azaBDP adopts a stable trans structure with a symmetrical center (Fig. S1 in Supporting information). Still, this provides innovative structure, which gives a synthetic strategy in the ingenious construction of nonaryl-substitutes at 1, 7-sites, following methyl, tert‑butyl and sec‑butyl groups in aza-BODIPY system [26].
To profoundly understand the effect of 1-phenylethyl group on the spectroscopic properties, the solvent effect of PhEt-azaBDP was investigated (Fig. 1a and Table S1 in Supporting information). In the nonprotonic polar solvent n-hexane or acetonitrile, the absorption and emission maxima were 654/687 nm and 656/700 nm, respectively. However, in the more polar protonated solvent dimethyl sulfoxide (DMSO) or dimethylformamide (DMF), the absorption and emission maxima were 674/715 nm and 670/708 nm respectively, exhibiting a certain redshift of absorption and emission. It is noteworthy that the fluorescence quantum yield of PhEt-azaBDP is low in CH2Cl2 (19%), mainly due to the non-radiative relaxation offered by the rotation of 1-phenylethyl group (Fig. 1b). On the other hand, PhEt-azaBDP could indeed cause the fluorescence enhancement when the temperature decreased (Fig. 1c), suggesting that the restriction of the 1-phenylethyl rotation to some extent at very low temperature was achieved. Moreover, the rotation process (Fig. S2 in Supporting information) of the 1-phenylethyl group at the ground state was explored (Fig. 1d). According to the result, there is an energy barrier of 0–32.3 kcal/mol along the rotation process, which is relatively low compared to that (34.561 kcal/mol) of the reported literature [27]. This energy barrier promises the rotation of the 1-phenylethyl group in solution at room temperature [27], and hence causes more system energy to be released in the non-radiative pathway. These results provide the possibility for high-performance application in phototherapy.
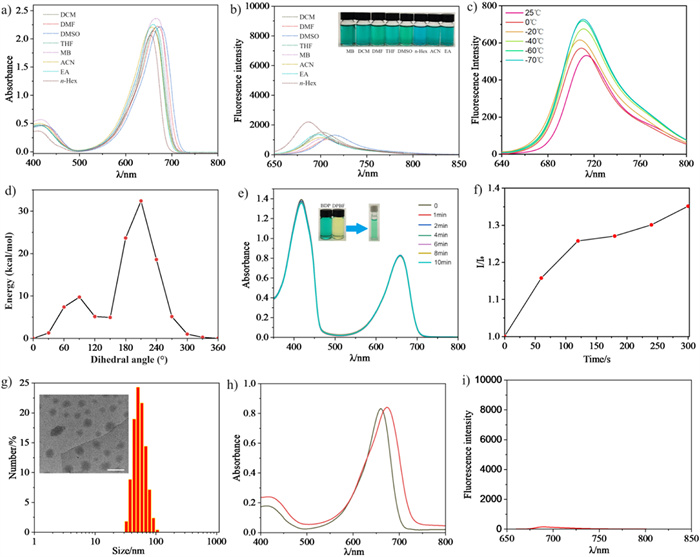
To assess type-II singlet oxygen (1O2) generation of PhEt-azaBDP under light irradiation, 1, 3-diphenylisobenzofuran (DPBF) was employed as a detection reagent. The 1O2 generation was evaluated by PhEt-azaBDP in toluene under 690 nm near-infrared (NIR) monochromatic light using a 150 W xenon lamp with an optical power density of 0.5 mW/cm2. As shown in Fig. 1e, the absorbance at 416 nm did not change significantly and almost no 1O2 was produced. Further we then evaluated the ROS generation, and the ROS generation capabilities of PhEt-azaBDP were explored using 2′, 7′-dichlorodihydrofluorescein (DCFH). DCFH showed a change in fluorescence intensity (1.35 times) while PhEt-azaBDP with light irradiation in tetrahydrofuran (THF) solutions (Fig. 1f). As illustrated in Figs. 1e and f, PhEt-azaBDP produced type-I ROS, without type-II 1O2.
PhEt-azaBDP NPs were prepared by nanoprecipitation method using 1, 2-distearoyl-sn‑glycero-3-phosphoethanolamine-N-[methoxy(polyethylene glycol)−2000] (DSPE-PEG2000) mixed with PhEt-azaBDP in aqueous solution (Scheme 1). According to the transmission electron microscopy (TEM), the stable PhEt-azaBDP NPs existed in a spherical morphology (Fig. 1g and Fig. S3 in Supporting information). Meanwhile, dynamic light scattering (DLS) results showed that the particle diameter of PhEt-azaBDP NPs was 55.4 nm and the polymer dispersion index (PDI) was 0.247 (Fig. 1g). Subsequently, the absorption maximum of PhEt-azaBDP NPs in aqueous solution was shifted to 674 nm (Fig. 1h). Compared with the 660 nm absorption band of PhEt-azaBDP in CH2Cl2, its absorption was red-shifted by 14 nm, and the absorption band was broadened to cover the range from 500 nm to 750 nm. Not only that, the fluorescence of PhEt-azaBDP NPs showed negligible (Fig. 1i) and this just provides a basis for phototherapy.
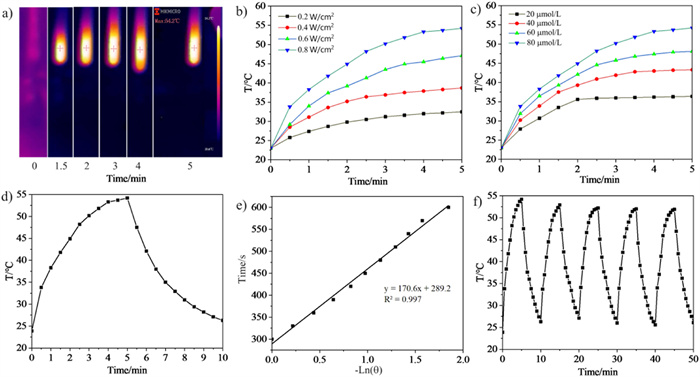
To investigate the effect of photothermal conversion with PhEt-azaBDP NPs, its warming was tested under 690 nm 0.8 W/cm2 laser irradiation (Fig. 2a). It was found that the temperature increased to 54.2 ℃ after 5 min with light irradiation, which has the potential for PTT. The effects of laser power and the concentration of PhEt-azaBDP NPs on the temperature were further explored. According to the results (Figs. 2b and c), it was observed that both the laser power (0.2–0.8 W/cm2) and the concentration of PhEt-azaBDP NPs (20–80 µmol/L) showed positive correlations with the temperature. In addition, PhEt-azaBDP NPs were rapidly warmed up within 5 min of light irradiation and rapidly cooled down after the next 5 min, using 10 min as a heating-cooling cycle (Fig. 2d). The PCE of PhEt-azaBDP NPs was calculated to be 48.6% based on the relevant time constants obtained from the cooling time and temperature (Fig. 2e). Subsequently, five heating-cooling cycle experiments were investigated (Fig. 2f), and it was found that the effects of temperature increase and cooling were almost same, confirming that PhEt-azaBDP NPs have the good photothermal stability and have the potential to be applied to treat tumor cancer cells.
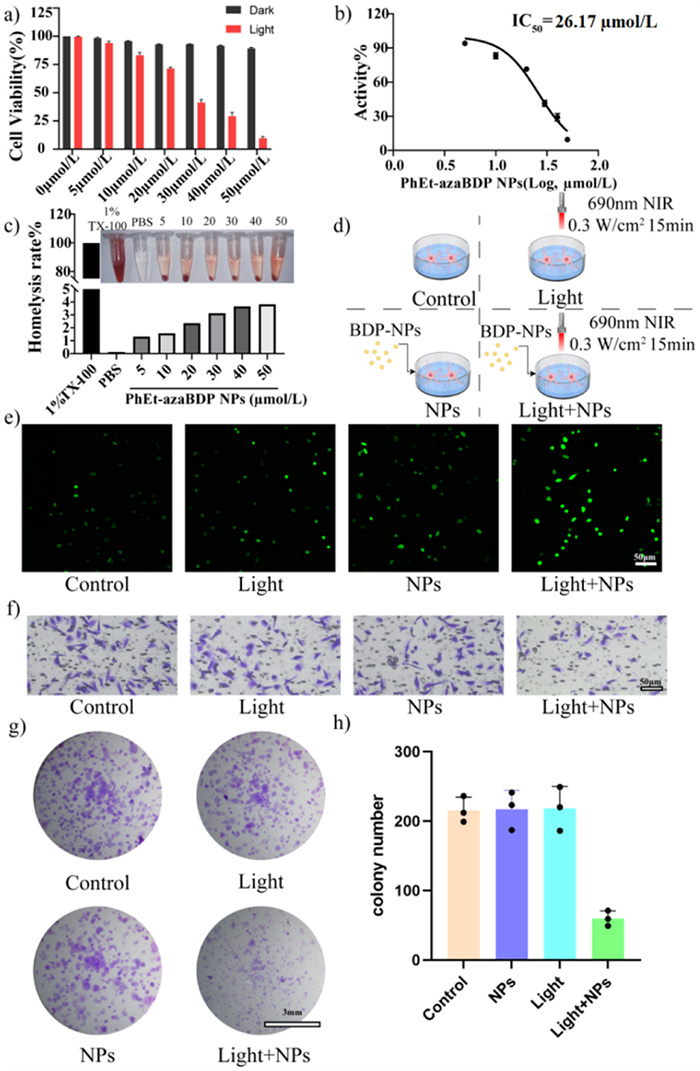
In order to investigate the phototherapy effect of PhEt-azaBDP NPs, U251 cells were used for theresearch (Fig. 3a). Firstly, we tested the viability of U251 cells under different concentrations (0–50 µmol/L) of PhEt-azaBDP NPs and the CCK8 results showed that 0, 5 and 10 µmol/L PhEt-azaBDP NPs with NIR irradiation had no significant effect on the activity of the U251 cells. From 20 µmol/L onwards, the tumor cell activity showed a significant decrease under the intervention of PhEt-azaBDP NPs, indicating that PhEt-azaBDP NPs had the dose-dependence inhibitory effect of PhEt-azaBDP NPs on the tumor activity. In addition, we calculated that half maximal inhibitory concentration (IC50) of PhEt-azaBDP NPs was 26.17 µmol/L according to the relevant data about cell viability under the laser (Fig. 3b). For the evaluation of biosecurity from the different concentrations of PhEt-azaBDP NPs, hemolysis test was conducted (Fig. 3c). The hemolysis rate of each group of samples is < 5%, which is in accordance with the relevant regulations of in vivo experiments. In hence, 30 µmol/L PhEt-azaBDP NPs were chosen as the optimal concentration of the following experiments (Fig. 3d). Afterwards, U251 cells were divided into four groups: Control group, Light group, PhEt-azaBDP NPs group and Light + PhEt-azaBDP NPs group. ROS are by-products of normal oxygen metabolism, and closely connected with the status of tumor cells [28]. DCFH probe could bind to intracellular ROS and emit green fluorescence, reflecting the expression level of ROS [29]. The results showed that the expression level of ROS in Light + PhEt-azaBDP NPs group was significantly higher than that of the other three groups, indicating that PhEt-azaBDP NPs as the photosensitiser, have the photodynamic effect in killing tumors (Fig. 3e). To determine the extent of malignancy, it is important to evaluate the migration of tumor cells [30, 31]. Based on transwell migration experiment, the number of cancer cells passing through transwell rooms decreased sharply, whereas the number of normal cells increased (Fig. 3f) [32]. The result showed that the ratio of crystal violet stained cells in Light + PhEt-azaBDP NPs group was lower than the other three groups, suggesting that PhEt-azaBDP NPs combined with 690 nm NIR irradiation could effectively inhibited the migration capacity of tumor cells. For assessing the effect of PhEt-azaBDP NPs on the proliferation level of tumor cells, we performed clone formation experiments (Figs. 3g and h) [33]. The number of tumor cell clones formed in Light + PhEt-azaBDP NPs group was significantly lower than that of the other three groups, whereas the administration of PhEt-azaBDP NPs or NIR light alone did not have a significant effect on the level of clone formation of tumor cells. The clone formation experiments suggested that PhEt-azaBDP NPs reduced the level of tumor cell proliferation under NIR light irradiation.
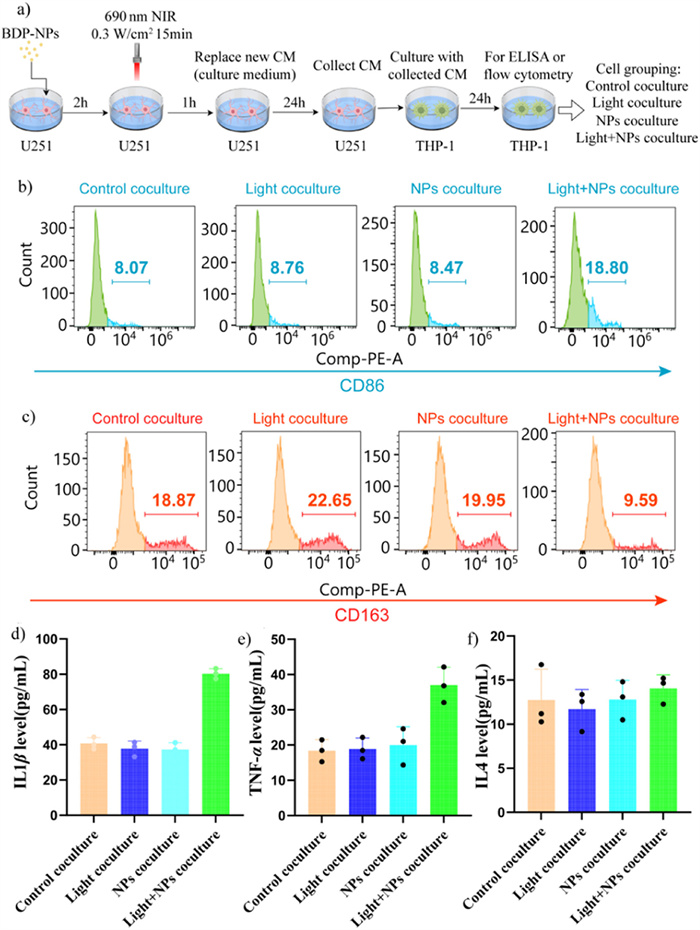
Since TME plays an important role in tumor growth, migration and proliferation [34], an important component of the TME is tumor-associated macrophages (TAMs) [35] and TME shapes the polarization of macrophages [36]. Differentiated TAMs can further polarize into different phenotypes, such as M1 and M2-type TAMs. First, co-culture system was established by U251 and THP-1 cells which can differentiate into TAMs (Fig. 4a). Further, we examined the markers of macrophage polarization in each group by flow cytometry analysis. CD86 and CD163 were chosen as the M1-type marker and M2-type marker, respectively [37]. We found that compared with the control group, there was no significant changes in the polarization marker level of TAMs by the intervention of PhEt-azaBDP NPs or NIR irradiation alone, whereas PhEt-azaBDP NPs resulted in the increasement of the expression of CD86 and the decreasement of the expression of CD163 in TAMs under NIR light irradiation (Figs. 4b and c). The result from the flow cytometry analysis demonstrated that PhEt-azaBDP NPs with NIR light irradiation could promote TAMs to switch from M2-phenotype to M1-phenotype. Moreover, since M1 phenotype polarization indicates the aggravation of inflammation and M2 phenotype macrophage exerts the anti-inflammatory role [38], we further measured the secretory level of inflammatory cytokines with enzyme-linked immunosorbent assay (ELISA) detection (Figs. 4d–f). The ELISA assay results showed that the inflammatory cytokines, IL-1β and TNF-α, were obviously upregulated in Light+PhEt-azaBDP NPs group coculture compared with the other three groups (Figs. 4d and e), but the anti-inflammatory cytokine, IL-4, was almost unchanged between the four groups of TAMs (Fig. 4f). So, we speculated that PhEt-azaBDP NPs combined with 690 nm NIR light irradiation contributed to the formation of inflammatory microenvironment around the tumor cells by polarizing TAMs into pro-inflammatory M1-type macrophage leading to the tumor-inhibitory effects.
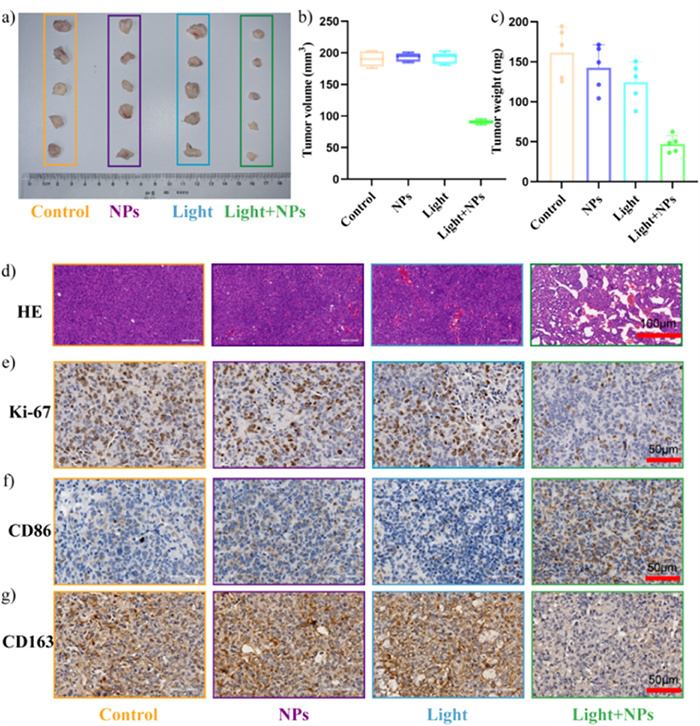
In view of the results of the cellular experiments, we further used the subcutaneous tumor-bearing nude mice to validate the tumor-inhibiting effect of PhEt-azaBDP NPs (Fig. 5). All animal experiments were approved by the Animal Experimental Ethics Committee of China Medical University. When the subcutaneous tumor volume reached 200 mm3, the mice were divided into four groups [39]. The results (Figs. 5a–c) showed that the tumor volume of mice treated with NIR laser and PhEt-azaBDP NPs after three days treatment was significantly lower than that of the control group, whereas the tumor size and volume of mice treated with PhEt-azaBDP NPs intervention or NIR light alone did not have a significant effect on the tumor size and volume of mice. This was considered to be related to the level of proliferation and migration of the subcutaneous tumors. Furthermore, we performed hematoxylin-eosin (HE) staining to evaluate the effect of PhEt-azaBDP NPs on the tissue damage and in vivo physiological toxicity. The results of HE staining showed that tumor tissue structure was disrupted and the tumors suffered cellular oedema with a large amount of vacuolated cytoplasm in Light+PhEt-azaBDP NPs group, while tumor tissue was structurally intact with no obvious damage in the other three groups (Fig. 5d). In addition, there was no significant difference among four groups based on the HE staining of brain, kidney, liver and spleen, which demonstrated PhEt-azaBDP NPs barely cause physiological toxicity on the main organs of mice (Fig. S4 in Supporting information). Furthermore, immunohistochemical detection about an indicator of cell proliferation, Ki-67, was implemented (Fig. 5e) [40]. Compared with the control group, the expression of Ki-67 in Light+PhEt-azaBDP NPs group significantly reduced after treatment, indicating that the proliferation level of the tumor tissues was significantly inhibited. Further we detected the macrophage polarization level of the tumor tissues in each group by immunohistochemical staining with CD86 (M1-type macrophage marker) and CD163 (M2-type macrophage marker) (Figs. 5f and g). The immunohistochemical results showed that, the CD86-positive ratio of tumor-bearing nude mice treated with NIR light and PhEt-azaBDP NPs was higher than that of the rest of the three groups, while the immunohistochemical result of CD163 shows the opposite trend, which are in agreement with the results of the cellular experiments, indicating that PhEt-azaBDP NPs in combination with NIR light could promote M1 tumor-associated macrophage polarization while inhibiting M2 macrophage polarization. Taken together, the results indicate that PhEt-azaBDP NPs have a significant inhibitory effect on animal tumor tissues under the 690 nm laser irradiation.
In summary, novel phototherapy agent based on 1-phenylethyl-containing aza-BODIPY was constructed. This provided innovative structure, which gave a synthetic strategy in the ingenious construction of nonaryl-substitutes at 1, 7-sites, following methyl, tert‑butyl and sec‑butyl groups in aza-BODIPY system. It is noteworthy that the fluorescence quantum yield of PhEt-azaBDP is low, mainly due to the non-radiative relaxation offered by the rotation of 1-phenylethyl group. PhEt-azaBDP produced type-I ROS, without type-II 1O2. Self-assembly PhEt-azaBDP NPs as a type I PDT-PTT agent can provide combined phototherapeutic effects under light irradiation and simultaneously induce inflammatory TME, by monitoring TAMs repolarization. CD86 and CD163 were chosen as the M1-type marker and M2-type marker respectively, and PhEt-azaBDP NPs led to the increasement of the expression of CD86 and the decreasement of the expression of CD163 in TAMs under NIR light irradiation, promoting TAMs to switch from M2-type to M1-type. Inflammatory cytokines, IL-1β and TNF-α, could be the key cytokine involved in the phototherapy-induced TME reprogramming. PhEt-azaBDP NPs could be a potential theranostic scaffold for the simultaneous induction and detection of TME reprogramming triggered by phototherapy.
The authors declare that they have no known competing financial interests or personal relationships that could have appeared to influence the work reported in this paper.
Zhiqiang Cui: Methodology, Investigation, Data curation. Dongxiang Zhang: Writing – original draft, Formal analysis. Yanru Huang: Writing – original draft, Investigation. Chunyu Shao: Methodology, Investigation. Yiming Zhang: Methodology. Changliang Sun: Software. Xin-Dong Jiang: Writing – review & editing, Resources. Xiaohong Sun: Writing – original draft. Qinghuan Xiao: Writing – review & editing.
This work was supported by the National Natural Science Foundation of China (Nos. 22078201, U1908202), Liaoning & Shenyang Key Laboratory of Functional Dye and Pigment (Nos. 2021JH13/10200018, 21–104–0–23, LJKZ0453), China Medical University's High-Quality Development Science and Technology Funding Program (Nos. 2022JH2/20200063, 2023JH2/20200162).
Supplementary material associated with this article can be found, in the online version, at doi:
H. Dai, W. Hu, L. Zhang, et al., Cell Death Dis. 12 (2021) 303.
Z. Bao, W. Zeng, D. Zhang, et al., Int. J. Biol. Sci. 18 (2022) 2867–2881. doi: 10.7150/ijbs.66854
A. Gunderson, M. Kaneda, T. Tsujikawa, et al., Cancer Discov. 6 (2016) 802.
F. Parisi, M. Tesi, F. Millanta, et al., Res. Vet. Sci. 13 (2013) 595–601.
X. Deng, H. Liang, W. Yang, et al., J. Photoch. Photobio. B 208 (2020) 111913.
Y. Yue, F. Li, Y. Li, et al., ACS Nano 15 (2021) 15166–15179. doi: 10.1021/acsnano.1c05618
F. Tong, H. Hu, Y. Xu, et al., Acta Pharm. Sin. B 13 (2023) 3471–3488.
J. Ling, Y. Chang, Z. Yuan, et al., ACS Appl. Mater. Interfaces 14 (2022) 27651–27665. doi: 10.1021/acsami.2c05533
J. Zhao, H. Huang, J. Zhao, et al., Acta Pharm. Sin. B 12 (2022) 2683–2694.
Y. Wei, Z. Wang, J. Yang, et al., J. Colloid. Interf. Sci. 606 (2022) 1950–1965.
W. Gu, W. Guo, Z. Ren, et al., Bioact. Mater. 38 (2024) 472–485.
T. Soyama, A. Sakuragi, D. Oishi, et al., Transl. Oncol. 14 (2021) 101005.
N. Hayashi, H. Kataoka, S. Yano, et al., Mol. Cancer Ther. 14 (2015) 452–460.
T. Wang, J. Ren, D. Zhang, et al., Chin. Chem. Lett. 35 (2024) 108862.
Y. Chen, Z. Wang, D. Zhang, et al., Dyes Pigm. 218 (2023) 111500.
M. Tian, W. Chen, G. Hong, et al., Mater. Lett. 5 (2023) 1922–1928. doi: 10.1021/acsmaterialslett.3c00290
Y. Yu, S. Wu, L. Zhang, et al., Biomaterials 280 (2022) 121255.
Y. Wang, D. Zhang, K. Xiong, et al., Chin. Chem. Lett. 33 (2022) 115–122. doi: 10.1117/12.2645600
Z. Li, H. Cheng, B. Wang, et al., J. Colloid. Interf. Sci. 668 (2024) 132–141.
L. Qiao, W. Xuan, Y. Ou, Redox Biol. 75 (2024) 103260.
Y. Zhu, J. Liu, M. Lv, et al., Chin. Chem. Lett. 35 (2024) 109446.
X. Zhang, S. Xue, W. Pan, et al., Chem. Comm. 59 (2023) 235.
Y. Xiao, J. Chen, S. Li, et al., Chem. Sci. 11 (2020) 888–895. doi: 10.1039/c9sc05817f
X. Guo, W. Sheng, H. Pan, et al., Angew. Chem. Int. Ed. 63 (2024) e202319875.
Y. Su, Q. Hu, D. Zhang, et al., Chem. Eur. J. 28 (2022) e202103571.
D. Zhang, G. Liu, X.D. Jiang, J. Mater. Chem. C 11 (2022) 1668–1677.
D. Xi, M. Xiao, J. Cao, et al., Adv. Mater. 32 (2020) 1907855.
S. Wang, M. Chang, J. Shiau, et al., Molecules 27 (2022) 1576. doi: 10.3390/molecules27051576
R. Mao, D. Du, X. Zhu, et al., J. Mol. Histol. 53 (2022) 915–923. doi: 10.1007/s10735-022-10099-1
Z. Yang, Y. Wang, L. Zhang, et al., Oncol. Lett. 21 (2021) 176.
H. Gu, J. Feng, H. Wang, et al., BMC Complement. Altern. Med. 16 (2016) 387.
G. Li, X. Li, M. Yang, et al., Sci. Rep. 7 (2017) 42105.
Y. Yuan, W. Ping, R. Zhang, et al., Cancer Cell Int. 22 (2022) 214.
S, Zhang, F. Xie, K. Li, et al., Acta Pharm. Sin. B 12 (2022) 3124–3138.
T. Gong, X. Song, L. Yang, et al., Int. J. Pharm. 559 (2019) 329–340.
A. Gunderson, M. Kaneda, T. Tsujikawa, et al., Cancer Discov. 6 (2016) 270–285.
Y. Zhao, Y. Zheng, Y. Zhu, et al., J. Nanobiotechnol. 20 (2022) 359.
A. Gharavi, N. Hanjani, E. Movahed, et al., Cell Mol. Biol. Lett. 27 (2022) 83.
C. Huang, C. Zhu, J. Chen, et al., Front. Bioeng. Biotechnol. 8 (2020) 571993.
L. Chen, X. Kong, Z. Wang, et al., J. Cell Mol. Med. 24 (2020) 2993–3021. doi: 10.1111/jcmm.14934

Scheme 1 Schematic illustration of the preparation of self-assembled PhEt-azaBDP NPs and the theranostic mechanisms.

Figure 1 (a) Absorption spectra of PhEt-azaBDP in different solvents. Solvents include dichloromethane (DCM), DMF, DMSO, toluene (MB), THF, acetonitrile (ACN), ethylacetate (EA) and n-hexane (n-Hex). (b) Emission spectra of PhEt-azaBDP in different solvents. Inset image: color of PhEt-azaBDP in different solvents under sunlight. (c) Temperature dependent emission of PhEt-azaBDP. The measurements were taken of this dye in solution of dry CH2Cl2. (d) Potential energy curve for the 1-phenylethyl group rotation of PhEt-azaBDP in the ground state. (e) Absorbance of DPBF decreases with increasing irradiation time (0–10 min) in the presence of PhEt-azaBDP. (f) ROS generation of PhEt-azaBDP (5 µmol/L) in a THF solution under continuous 690 nm laser (0.8 W/cm2) irradiation for 5 min, using DCFH (10 µmol/L) as an indicator. (g) Particle size of PhEt-azaBDP NPs in aqueous solution. Inset image: TEM. Scale bar: 100 nm. (h) Absorption spectra of PhEt-azaBDP (black line) in CH2Cl2 and PhEt-azaBDP NPs (red line) in aqueous solution. (i) Fluorescence spectra of PhEt-azaBDP NPs in aqueous solution.

Figure 2 (a) Infrared thermal images of 80 µmol/L PhEt-azaBDP NPs under laser irradiation (690 nm, 0.8 W/cm2) at different times (0–5 min). (b) Temperature changes of PhEt-azaBDP NPs at different concentrations (20–80 µmol/L) under 690 nm NIR irradiation for 5 min (0.8 W/cm2). (c) Temperature variations of 80 µmol/L concentration of PhEt-azaBDP NPs at different laser power densities for 5 min (690 nm, 0.2–0.8 W/cm2). (d) Temperature fluctuations of 80 µmol/L PhEt-azaBDP NPs during 5 min laser irradiation (690 nm, 0.8 W/cm2) and 5 min cooling process. (e) Plot of cooling time of PhEt-azaBDP NPs versus negative enatural logarithm of the temperature from the cooling test. (f) Temperature variations of 80 µmol/L PhEt-azaBDP NPs during five heating/cooling cycles.

Figure 3 (a) CCK8 detection of U251 tumor cells viability after treatment with different concentrations of NPs under the 690 nm laser. (b) IC50 of PhEt-azaBDP NPs in U251 tumor cells under the 690 nm laser. (c) Images of hemolysis test samples of PhEt-azaBDP NPs with quantitative analysis results. (d) Graphical experimental schema and cell grouping. (e) DCFH probe detection of ROS release in each group of U251 (scale bar: 50 µm, magnification 200×). (f) Representative image of transwell assays from each group of U251 (scale bar: 50 µm, magnification 200×). (g) Representative image of clone formation experiment from each group of U251 (scale bar: 3 mm, magnification 1×). (h) Quantitative analysis of cell clone formation. Cells from the PhEt-azaBDP NPs group were treated with 30 µmol/L NPs for 24 h. Control group: untreated. Light group: only irradiated by 0.3 W/cm2 690 nm NIR laser for 15 min. Light+PhEt-azaBDP NPs group: treated with 30 µmol/L PhEt-azaBDP NPs for 24 h and then irradiated by 0.3 W/cm2 690 nm NIR laser for 15 min. The 30 µmol/L PhEt-azaBDP NPs were abbreviated as BDP-NPs or NPs. Data are presented as mean ± standard deviation (SD) (n = 3).

Figure 4 (a) Graphical experimental schema and cell grouping. (b, c) Flow cytometry detection of CD86 (M1-type macrophage marker) and CD163 (M2-type macrophage marker) in each group of THP-1 cells. (d–f) ELISA analysis about the level of inflammatory factors IL-1β (d), TNF-α (e), IL-4 (f) in each group of THP-1 cells. The 30 µmol/L PhEt-azaBDP NPs were abbreviated as BDP-NPs or NPs. Data are presented as mean ± SD (n = 3).

Figure 5 (a–c) The representative images, tumor volume and tumor weight of tumor tissue from the four groups of tumor-bearing nude mice after different treatments. (d) Representative pictures of HE (scale bar: 100 µm, magnification 200×). (e–g) Representative immunohistochemical pictures of Ki-67, CD86 and CD163 expression (scale bar: 50 µm, magnification 400×). Control group: untreated; PhEt-azaBDP NPs group: injected with 100 µL 30 µmol/L PhEt-azaBDP NPs via the tail veins. Light group: treated by the irradiation of 690 nm NIR laser at subcutaneous tumors for 15 min. Light+PhEt-azaBDP NPs group: firstly injected with 100 µL 30 µmol/L PhEt-azaBDP NPs via the tail veins and then subcutaneous tumors were irradiated by 690 nm NIR laser for 15 min at 24 h post injection. All groups were comprised of five mice. The 30 µmol/L PhEt-azaBDP NPs were abbreviated as NPs. Data are presented as mean ± SD (n = 5).

 扫一扫看文章

扫一扫关注我们
 DownLoad:
 下载:
下载:
 下载:
下载: