Scheme 1.
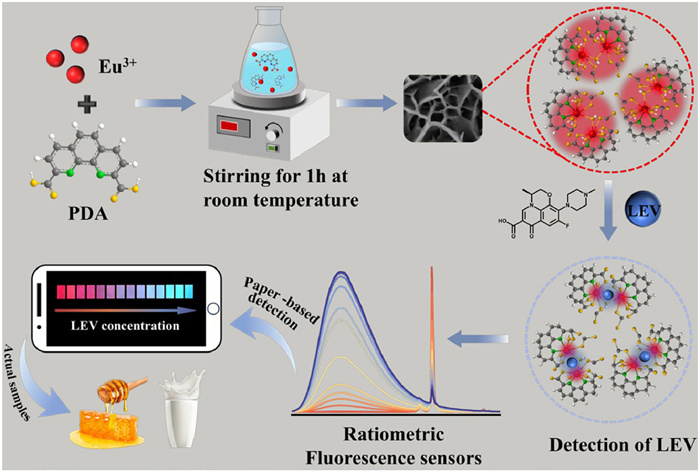
Illustration of the facile-synthesized Eu-MOF for ratiometric fluorescence and multi-color visual sensing of LEV.
Target self-calibration ratiometric fluorescent sensor based on facile-synthesized europium metal-organic framework for multi-color visual detection of levofloxacin
Li Li , Lin-Lin Zhang , Yansha Gao , Lu-Ying Duan , Wuying Yang , Xigen Huang , Yanping Hong , Jiaxin Hong , Lin Yuan , Limin Lu

Levofloxacin (LEV), as one of the fluoroquinolone synthetic antibiotics, holding effective antibacterial activity toward both gram-positive and gram-negative bacteria, which has been widely used in biomedicine, livestock farming and aquaculture [1–3]. Nevertheless, the poor biodegradability of LEV will inevitably cause high level of residue in food and environment, thereby eventually being accumulated in human body through the food chain, posing great threats to human health such as toxicity of the central nervous system, teratogenicity and carcinogenicity [4–6]. Considering the possible hazards of fluoroquinolone residues, European Union (EU) has strictly restricted the maximum residue limit in food (<100 µg/kg) [7,8]. Therefore, the development of a convenient and efficient strategy for LEV residue detection is extremely imperative to guarantee the food safety.
To date, various analytical techniques including high performance liquid chromatography (HPLC) [9], chemiluminescence [10], enzyme-linked immunosorbent assay (ELISA) [11], surface-enhanced Raman scattering (SERS) [12] and fluorometry [13], have been utilized for fluoroquinolone antibiotics detection. Among them, fluorescence analysis has gained more attentions owing to the superiority of good reproducibility, easy-to-operate, high sensitivity and fast response. Accordingly, fluorescent sensing platforms based on synthetic organic dye (e.g., fluorescein 5-isothiocyanate) [14], quantum dots (e.g., graphene quantum dots, N-doped carbon dots, CdTe quantum dots) [15–17], g-C3N4 nanosheet [18,19] and upconversion nanoparticles [20] were developed for LEV determination. Though some progress in the development of fluorescent probes, these fluorescent strategies could not avoid some disadvantages such as poor fluorescence intensity and photochemical stability, sophisticated synthesis as well as time-consuming, which greatly limit their detection performances.
As an important and promising type of metal-organic frameworks (MOFs), lanthanide MOFs (Ln-MOFs) with an efficient antenna effect from organic ligand to Ln3+ ions that showed intrinsic luminescent characteristics of strong fluorescence, long decay lifetime and large Stokes shift [21–25]. Recently, some Ln-MOFs-based strategies have been exploited for fluoroquinolone antibiotics determination [26–28], however, the detection mode for these fluorescent sensors was mostly dependent on the changes of single fluorescence signal, which greatly limited their accuracy and reliability. Meanwhile, the rigorous synthesis conditions or single-color changes undoubtedly compromised their visual analysis and practical applications to some extent [29,30]. To tackle above problems, dual-emissive ratiometric fluorescent Ln-MOFs sensors, for example, NIIC-1-EuXTb1-X or Zn/Eu-MOF have been established for fluoroquinolone antibiotics monitoring [31,32]. Nevertheless, in the above sensing systems, the synthetic ratio of bimetallic behaved a significant influence on the ratiometric fluorescence signals that should be elaborately optimized through a series of experiments. Besides, the capability to differentiate analogous antibiotics was also a noteworthy problem. Considering the intrinsic fluorescence properties of LEV, the establishment of a highly selective self-calibration ratiometric fluorescence sensing approach toward LEV by utilizing facile-synthesized Ln-MOF is of great interest and still desired.
Inspired by the above, herein, a ratiometric fluorescence and multi-color visual sensing platform was proposed for LEV detection utilizing europium metal-organic framework (Eu-MOF) as the luminescent probe. As illustrated in Scheme 1, the Eu-MOF was successfully synthesized by simply mixing Eu3+ salts with 1,10-phenanthroline-2,9-dicarboxylic acid (PDA) ligand at room temperature that delivered strong characteristic fluorescence of Eu3+ ions. Upon exposure to LEV, the emission intensity of Eu-MOF at 612 nm was quenched, whereas the emission of LEV at 462 nm was enhanced. As such, the target concentration-dependent self-calibration ratiometric fluorescence analysis of LEV can be realized. Moreover, to further simplify signal readout process, the portable visual sensing platform based on RGB color analysis and as-synthesized Eu-MOF test paper has been constructed and used for convenient multi-color detection of LEV. This developed sensor could realize highly sensitive, selective and reliable analysis of LEV in real samples, which hold appreciable potential for practical applications in food quality and safety supervision.
Eu-MOF was simply synthesized by mixing Eu3+ salts with PDA that formed three rigid five-membered rings through the coordination interaction between pyridine and carboxyl groups of PDA ligand with Eu3+ (Fig. S1 in Supporting information). As shown in Figs. 1A and B, the images of scanning electron microscopy (SEM) indicated that the Eu-MOF presented uniform honeycomb-like nanosheets structure with a thickness of 25–35 nm. X-ray diffraction (XRD) pattern exhibited evident diffraction peaks in the range of 5°–60°, which disclosed the crystal structure of Eu-MOF (Fig. S2 in Supporting information). At the same time, the element mapping analysis via energy dispersive X-ray spectroscopy (EDS) revealed that the elements of C, N, O and Eu distributed thoroughly within as-synthesized Eu-MOF (Fig. 1C). Further X-ray photoelectron spectroscopy (XPS) also verified the same elemental compositions as that EDS (Fig. 1D). The deconvolution spectra of Eu 3d displayed five peaks, in which the peaks located at 1135.2 and 1164.9 eV were assigned to Eu 3d5/2 and Eu 3d3/2 for Eu3+, and the peak at 1143.6 eV was a satellite signal (abbreviated as “Sat.”). Besides, the obvious peaks of O-Eu at 530.89 eV and C-N-Eu at 400.05 eV appeared in O 1s and N 1s XPS spectra (Fig. S3 in Supporting information), suggesting Eu3+ was successfully coordinated with O and N atoms in PDA [33,34]. Furthermore, Fourier transform infrared (FT-IR) spectra were performed to investigate the chemical structure of Eu-MOF. As can be seen from Fig. 1E, the peak of aromatic skeleton (C-N) vibration for PDA ligand at 1615 cm−1 underwent a redshift to 1602 cm−1 in Eu-MOF. Meanwhile, compared with the peak in PDA at 1738 cm−1, double peaks ascribed to C=O asymmetric stretching vibration of Eu-MOF appeared at 1635 and 1568 cm−1, demonstrating the strong coordination between Eu3+ and PDA [35]. Altogether, the above results confirmed that Eu-MOF has been resoundingly synthesized.
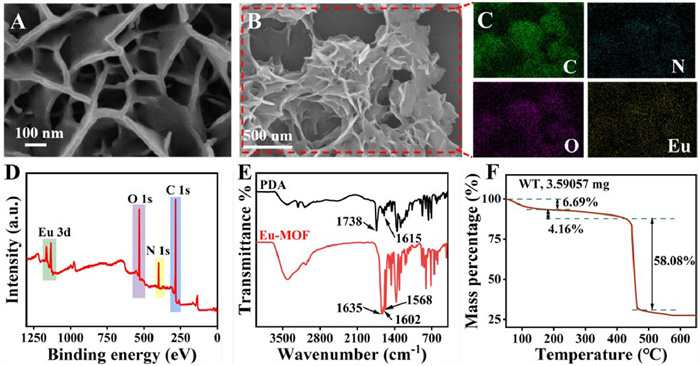
Thermogravimetric analysis (TGA) was carried out to evaluate the thermal stability of Eu-MOF. As displayed in Fig. 1F, on account of the removal of solvent molecules under heating conditions, the initial weight loss of 6.69% occurred from 68.33 ℃ to 182.83 ℃, and followed a very slow weight loss of 4.16% from 182.83 ℃ to 424.83 ℃. The framework structure of Eu-MOF began to collapse accompanied the missing of PDA ligand from 424.83 ℃ to 473.17 ℃ with a dramatic weight loss of 58.08%, manifesting this synthesized Eu-MOF had satisfactory thermal stability.
The luminescence properties of PDA ligand and Eu-MOF were investigated. As shown in Fig. S4 (Supporting information), when excitation with 350 nm, the PDA ligand delivered strong emission peak at 465 nm. Whereas, once PDA was coordinated with Eu3+ ions to form Eu-MOF, two apparent characteristic narrow emission peaks generated, which were separately attributed to 5D0→7F1 and 5D0→7F2 transitions of Eu3+ ions, indicating the PDA ligand sensitized Eu3+ ions with high efficiency. Meanwhile, the Eu-MOF displayed strong red color under a 302 nm ultraviolet (UV) light, implying the Eu-MOF could be applied for visual detection.
For the sake of guaranteeing the accuracy and reliability in practical applications, the fluorescence stability of Eu-MOF in phosphate buffered saline (PBS), honey and milk was studied. As presented in Fig. S5 (Supporting information), the fluorescence emission intensity of Eu-MOF did not show evident changes either in PBS or in actual samples of honey and milk for 7 days, indicating that the Eu-MOF possessed excellent fluorescence stability that was suitable for the development of high credibility sensors.
Subsequently, the feasibility of the proposed ratiometric fluorescence sensing platform for LEV detection was validated. As shown in Fig. 2A, upon the addition of target LEV into Eu-MOF, the intrinsic fluorescence peak for LEV at 462 nm increased, while the fluorescence emission for Eu-MOF decreased dramatically. At the same time, the color of the corresponding solutions changed from red to pink and ended up with blue under 302 nm UV light. Besides, it was worth mentioning that the fluorescence intensity of LEV without Eu-MOF increased, and then decreased with the LEV concentration of 0–150 µmol/L (Fig. S6 in Supporting information), which was different from the continuous rising trend for LEV sensing process, certifying a target self-calibration ratiometric sensor was successfully constructed by combining Eu-MOF with LEV.

To obtain the optimal sensing performances, several possible influencing parameters such as the buffer composition, pH and reaction time were systematically investigated. As depicted in Fig. S7 (Supporting information), the best analytical performances were acquired when the detection system performed in PBS buffer with pH 7.0. Besides, the reaction time was also studied. As shown in Fig. S8 (Supporting information), the fluorescence intensity at 612 nm decreased rapidly, while the fluorescence intensity at 462 nm increased simultaneously. The phenomenon reached a steady state just within 16 s accompanying with the fluorescence color changing from red to blue under UV irradiation, suggesting this developed ratiometric fluorescence sensor could meet the requirement for fast testing. Based on the above optimization experiments, PBS buffer with the pH of 7.0 and reaction time with 16 s were chosen as the optimal detection conditions for subsequent analyses.
Under the optimal detection conditions, the quantitative ability of Eu-MOF based ratiometric sensing platform for LEV was further examined. As exhibited in Figs. 2B and C, the fluorescence intensity at 612 nm gradually decreased and the intrinsic fluorescence of LEV at 462 nm increased with the increasing concentration of LEV (0–150 µmol/L). Meanwhile, the fluorescence intensity ratio of I462/I612 (y) and LEV concentrations (x) presented an excellent linear relationship of y = 0.0156 + 0.0473 x (R 2 = 0.9975) with a broad range from 0.05 µmol/L to 120 µmol/L. The limit of detection (LOD) was estimated to be 27 nmol/L based on the 3σ/k rule (n = 11), which was lower than most reported fluorescence sensors for LEV (Table S1 in Supporting information), certifying the superior sensitivity of this ratiometric sensing system for LEV analysis. Additionally, the CIE chromaticity diagram of Eu-MOF displayed LEV concentration-dependent wide dynamic color changes from red to blue (Fig. 2D), revealing the Eu-MOF possessed desirable visual detection capability for LEV that could be utilized for development of portable sensors.
Selectivity was an essential prerequisite for precise detection of target, hence, the fluorescence responses of various potential interfering substances in food samples such as common ions, amino acids, carbohydrates as well as sulfonamide antibiotics (sulphamerazine (SMR), sulfamethoxazole (SMZ) and sulfathiazole (ST)) were investigated. As shown in Fig. 2E, only target LEV generated significantly enhanced fluorescence ratio of I462/I612, while non-target analytes had almost no apparent fluorescence response, thereby uncovering this developed ratiometric fluorescent sensor enabled to detect LEV with high selectivity. Furthermore, the anti-interference performance of Eu-MOF was also evaluated (Fig. S9 in Supporting information). As anticipated, there was little change for fluorescence ratios of I462/I612 no matter whether other interfering substances coexisted or not, thus confirming that the availability of Eu-MOF was applied for LEV determination in practical samples. In addition, the selectivity and anti-interference ability of Eu-MOF toward LEV among several quinolone antibiotics (ciprofloxacin (CIP), fleroxacin (FLE), enrofloxacin (ENR), pefloxacin (PFL), ofloxacin (OFL)) that had similar structure with target LEV was further evaluated. As displayed in Fig. 2F, all these quinolone antibiotics could quench the fluorescence of Eu-MOF and their intrinsic fluorescence increased. Whereas, the fluorescence ratio of I462/I612 produced by LEV was much higher than other non-target antibiotics. Meanwhile, these antibiotics exhibited negligible influence on the fluorescence response when coexisted with LEV (Fig. S10 in Supporting information), validating the Eu-MOF could effectively discriminate the target LEV from other quinolone antibiotics with similar structure. In addition, the reproducibility and repeatability of as-developed fluorescent sensor toward LEV were studied. As shown in Fig. S11 (Supporting information), for reproducibility study, seven Eu-MOFs were separately utilized for LEV detection under the same conditions, and the calculated relative standard deviation (RSD) was 2.78%. As for the repeatability, the RSD of 1.32% was obtained after the same Eu-MOF with ten continuous tests to LEV, suggesting that this self-calibration ratiometric fluorescent strategy had satisfying reproducibility and repeatability for credible analyzing LEV.
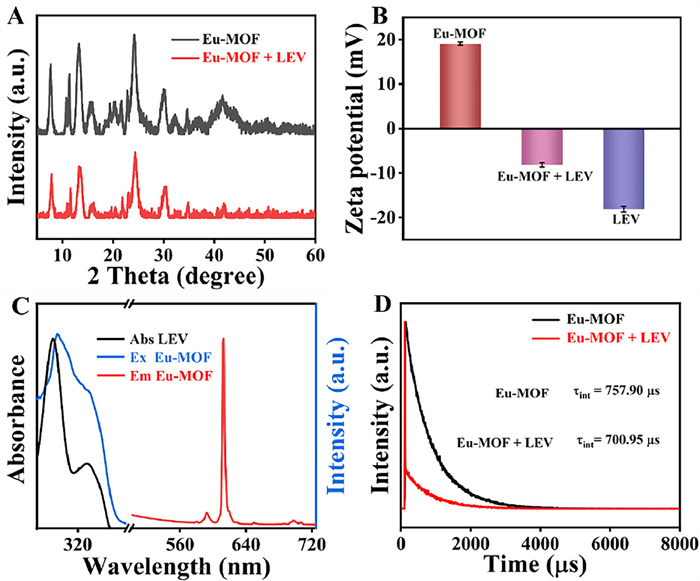
To elucidate the ratiometric sensing mechanism of Eu-MOF toward LEV, firstly, we explored whether the fluorescence responses were attributed to the change of crystal structure of Eu-MOF. As observed in Fig. 3A, the XRD patterns of Eu-MOF treated with LEV were nearly the same as the original Eu-MOF, making clear that the structure of Eu-MOF remained intact, thereby excluding the reason of structure change mediated the sensing behaviors. The zeta potentials of Eu-MOF and LEV were 19.10 and –18.10 mV. However, once addition of LEV, the zeta potential of Eu-MOF changed to be –8.17 mV, which revealed that there might be electrostatic interaction between Eu-MOF and target LEV (Fig. 3B). As we all know, fluorescence resonance energy transfer (FRET), inner filter effect (IFE) and photoinduced electron transfer (PET) were three common fluorescence quenching mechanisms. As shown in Fig. 3C, the absorption spectrum of LEV in the range of 200–400 nm overlapped well with the excitation spectrum of Eu-MOF, but not for its emission spectrum, implying the predominant sensing mechanism was ascribed to the IFE. Furthermore, the quenching process was also investigated by fluorescence lifetime measurements (Fig. 3D). The fluorescence lifetime of Eu-MOF at 612 nm underwent an obvious change from 757.90 µs to 700.95 µs after addition of LEV, indicating the fluorescence quenching of LEV toward Eu-MOF was a dynamic quenching process.
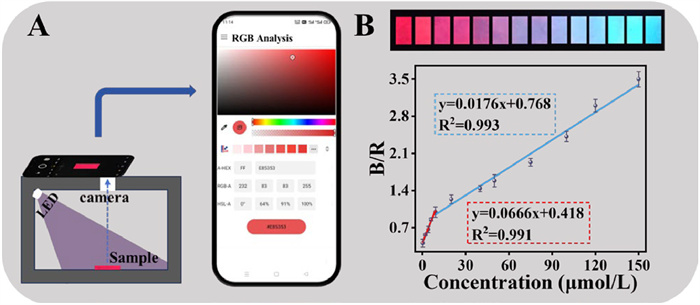
Given the growing demands for portable sensors, an intelligent visual sensing platform integrating the Eu-MOF fluorescent test paper and RGB analysis application was constructed. As shown in Fig. 4, after the addition of increasing concentrations of LEV onto the Eu-MOF-based test papers, the significantly distinct multi-color fluorescence changes from red to blue were observed under 302 nm UV light irradiation. With the assistance of RGB analysis application, the RGB values of these images were exactly extracted and the ratio of the blue channel (B) to the red channel (R) was selected to quantify the LEV concentration. The good linear relationships between B/R ratio and LEV concentrations ranged from 0.2 µmol/L to 9 µmol/L (R2 = 0.991) and 9 µmol/L to 150 µmol/L (R2 = 0.993) with a detection limit of 41.3 nmol/L, illustrating this Eu-MOF-based portable fluorescence test strip could sensitive visual analyze target LEV which endowed them with great potentials for on-site testing applications.
In order to assess the practicability and applicability of developed ratiometric fluorescent sensor, its quantitative detection ability to LEV in honey and milk samples was examined through spiked recovery experiments. As depicted in Table S2 (Supporting information), after spiking LEV with different concentration (1, 10 and 100 µmol/L) into honey and milk samples, the fluorescence sensing system in aqueous solution exhibited satisfactory recoveries from 98.00% to 103.46% with RSD (n = 3) lower than 2.84%. Besides, the recoveries obtained by Eu-MOF based test papers ranged from 96.90% to 105.00% and the RSD were calculated less than 3.29%. All these results demonstrated that the Eu-MOF based fluorescent ratiometric sensing platform equipped with good accuracy, reliability and portability for quantitative determination of LEV levels in practical samples.
In summary, a target self-calibration ratiometric fluorescent sensing strategy was deliberately established for fast and visual analysis of LEV using the one-step facile-synthesized Eu-MOF as luminescent probe. The developed fluorescence sensor exhibited good sensitivity with a low detection limit of 27 nmol/L, well-pleasing selectivity and anti-interference capability, which was able to detect the levels of LEV in honey and milk samples. The sensing mechanism studies manifested that the inner filter effect and dynamic quenching were the main reasons for fluorescence responses of Eu-MOF toward target LEV. Additionally, Eu-MOF-based test paper combining with smartphone-assisted RGB analysis was utilized for the muti-color visual, portable and sensitive detection of LEV, thereby affording a simple and instrument-free on-site testing tool. Consequently, this fluorescent ratiometric and multi-color visual detection sensor might provide an available and promising device in food-related sensing applications.
We declare that we have no known competing financial interests or personal relationships with other people or organization that could inappropriately influence the work reported in this paper.
Li Li: Writing – original draft, Investigation. Lin-Lin Zhang: Validation, Investigation. Yansha Gao: Funding acquisition, Formal analysis. Lu-Ying Duan: Writing – review & editing, Writing – original draft, Methodology, Funding acquisition. Wuying Yang: Investigation. Xigen Huang: Methodology. Yanping Hong: Investigation. Jiaxin Hong: Formal analysis. Lin Yuan: Writing – review & editing, Conceptualization. Limin Lu: Writing – review & editing, Supervision, Funding acquisition, Conceptualization.
This work was supported by the National Natural Science Foundation of China (Nos. 32260247 and 22064010), the Natural Science Foundation of Jiangxi Province (Nos. 20232BAB215071 and 20224BAB213009).
Supplementary material associated with this article can be found, in the online version, at doi:
X. Van Doorslaer, J. Dewulf, H. Van Langenhove, et al., Sci. Total Environ. 500-501 (2014) 250–269.
F. Meng, S. Sun, J. Geng, et al., J. Hazard. Mater. 453 (2023) 131322.
J. Sun, X.P. Liao, A.W. D’Souza, et al., Nat. Commun. 11 (2020) 1427.
E.S. Orman, H.S. Conjeevaram, R. Vuppalanchi, et al., Clin. Gastroenterol. Hepatol. 9 (2011) 517–523.
P. Kovalakova, L. Cizmas, T.J. McDonald, et al., Chemosphere 251 (2020) 126351.
M.K. Jin, Q. Zhang, W.L. Zhao, et al., J. Hazard. Mater. 424 (2022) 127509.
C. Aymard, H. Kanso, M.J. Serrano, et al., Food Chem. 370 (2022) 131016.
R. Jiang, D. Lin, Q. Zhang, et al., Sensor. Actuat. B: Chem. 350 (2022) 130902.
M.D.C. Gómez-Regalado, L. Espín-Moreno, L. Martín-Pozo, et al., Talanta 262 (2023) 124678.
L. Sun, Y. Chen, Y. Duan, et al., ACS Appl. Mater. Interfaces 13 (2021) 38923–38930. doi: 10.1021/acsami.1c11949
J. Xiao, L. Qin, D. Zhao, et al., J. Hazard. Mater. 465 (2024) 133221.
N. Duan, Y. Chang, T. Su, et al., Biosens. Bioelectron. 249 (2024) 116022.
X. Zhang, F. Yang, T. Ren, et al., Chin. Chem. Lett. 34 (2023) 107835.
J. Wang, D. Li, Y. Ye, et al., Adv. Mater. 33 (2021) 2008020.
C. Wang, F. Qin, S. Tang, et al., Food Chem. 411 (2023) 135514.
V. Arul, N. Sampathkumar, S. Kotteeswaran, et al., Microchim. Acta 190 (2023) 242.
S. Xu, L. Li, D. Lin, et al., Chin. Chem. Lett. 34 (2023) 107997.
T. Garg, J.Kaur Renu, et al., Chem. Eng. J. 443 (2022) 136441.
N. Ding, B. Chen, L. Zhou, et al., Chin. Chem. Lett. 33 (2022) 3797–3801.
Q. Ouyang, M. Zhang, B. Wang, et al., J. Agric. Food Chem. 71 (2023) 13114–13123. doi: 10.1021/acs.jafc.3c01578
X. Wang, K. Gopalsamy, G. Clavier, et al., Chem. Sci. 15 (2024) 6488–6499. doi: 10.1039/d3sc06899d
Y. Zhao, J. Li, Y. Shi, et al., Chin. Chem. Lett. 36 (2025) 110132. doi: 10.1016/j.cclet.2024.110132
Z.W. Huang, X.B. Li, L. Mei, et al., Adv. Funct. Mater. 34 (2024) 2404126. doi: 10.1002/adfm.202404126
L. Li, L.L. Zhang, J. Zou, et al., Anal. Chim. Acta 1290 (2024) 342022.
X. Zhou, X. Wang, L. Shang, Chin. Chem. Lett. 34 (2023) 108093.
B. Wang, B. Yan, Talanta 208 (2020) 120438.
J. Chen, Y. Jin, T. Ren, et al., Food Chem. 386 (2022) 132751.
Z. Zhou, X. Wen, C. Shi, et al., Food Chem. 417 (2023) 135883.
L. Jiang, T. Chen, E. Song, et al., Chem. Eng. J. 427 (2022) 131563.
H. Ye, S. Koo, B. Zhu, et al., Anal. Chem. 94 (2022) 15423–15432. doi: 10.1021/acs.analchem.2c03326
X. Yu, A.A. Ryadun, D.I. Pavlov, et al., Angew. Chem. Int. Ed. 62 (2023) e202306680.
Y. Wu, Y. Zhou, H. Long, et al., Food Chem. 422 (2023) 136250.
W. Shi, S. Zhang, Y. Wang, et al., Sensor. Actuat. B: Chem. 367 (2022) 132008.
H. Dong, S. Liu, Q. Liu, et al., Anal. Chem. 94 (2022) 12852–12859. doi: 10.1021/acs.analchem.2c02852
J. Song, B. Zhao, Y. Wang, et al., Food Chem. 437 (2024) 137008.

Scheme 1 Illustration of the facile-synthesized Eu-MOF for ratiometric fluorescence and multi-color visual sensing of LEV.

Figure 1 (A, B) SEM images of Eu-MOF. (C) Elemental mappings for C, N, O and Eu from Eu-MOF. (D) XPS spectrum of Eu-MOF. (E) FT-IR spectra of PDA ligand and Eu-MOF. (F) Thermogravimetric analysis of Eu-MOF.

Figure 2 (A) Fluorescence emission spectra of Eu-MOF (a), Eu-MOF + 15 µmol/L LEV (b), Eu-MOF + 75 µmol/L LEV (c) and 75 µmol/L LEV (d). (B) Fluorescence emission spectra of Eu-MOF with the addition of different concentrations of LEV. (C) Linear plot of I462/I612 versus LEV concentrations with the range of 0.05–120 µmol/L. (D) CIE chromaticity diagram of Eu-MOF incubated with different concentrations of LEV (0–150 µmol/L). (E) Selectivity of Eu-MOF toward LEV among various ions, amino acids, carbohydrates and sulfonamide antibiotics. (F) Selectivity of Eu-MOF toward LEV among various quinolone antibiotics. Inset showed corresponding fluorescence photographs under a 302 nm UV lamp irradiation. Error bars represented standard deviation of three repetitive assays.

Figure 3 (A) XRD patterns of Eu-MOF and Eu-MOF + LEV. (B) Zeta potentials of Eu-MOF, LEV and Eu-MOF + LEV. Error bars represented standard deviation of three repetitive assays. (C) Ultraviolet-visible absorption spectra of LEV, fluorescence excitation and emission spectra of Eu-MOF. (D) Fluorescence lifetime decay curves of Eu-MOF treated with LEV or not.

Figure 4 (A) Illustration of the process to acquire the B and R values with a smartphone assisted RGB analysis application. (B) The images of Eu-MOF-based test paper after treatment with increasing concentrations of LEV, and the corresponding relationship between B/R ratio and the LEV concentration. Error bars represented standard deviation of three repetitive assays.

 扫一扫看文章

扫一扫关注我们
 DownLoad:
 下载:
下载:
 下载:
下载: