Received Date:
17 April 2024 Accepted Date:
05 September 2024 Revised Date:
29 July 2024 Available Online:
15 July 2025
Abstract:
In this study, novel CePO4 supported Cr catalyst was applied to eliminate slipping NH3 from stationary sources in the presence of SO2. Experimental results revealed that over 85% NH3 conversion and well N2 selectivity could be achieved on Cr/CePO4 catalyst within 300–450 ℃ after 20 h reaction running in the presence of SO2. Importantly, superior SCO activity (about 95%) could be maintained during the stability test. Characterization results indicated that active Cr sites could form strong interactions with acidic CePO4 support on Cr/CePO4 catalyst, which slightly suppressed reactivity of active Cr species but showed enhanced surface acidity. Importantly, the existed strong interactions and enhanced surface acidity significantly impeded the adsorption and oxidation process of SO2, which weakened the deposition and thermal stability of sulfate species and retained more active sites to participate in SCO reactions, thereby enhancing sulfur tolerance of Cr/CePO4 catalyst. Such findings could pave a new way for development of highly efficient SCO catalysts with well sulfur tolerance for real application.
Nowadays, air pollution problems, including PM2.5 and O3, have become increasingly urgent environmental challenges [1], where NOx and NH3 from stationary sources indispensably contributed to that [2]. Originally, to control emissions of NOx from stationary sources, selective catalytic reduction (SCR) of NOx with ammonia (NH3-SCR) has been widely applied [3-8]. However, owing to fluctuation of gaseous distribution and operational condition, over stoichiometric ratio of NH3 had been injected to ensure deNOx efficiency during SCR process, consequently resulting in emissions of unreacted NH3 and some NOx to atmosphere [9, 10]. To solve above contradictory situation, one promising way is to establish NH3-SCO (selective catalytic oxidation of NH3) catalysts at the tail-end of SCR units, which could selectively convert unreacted NH3 to N2 and H2O [11]. Lately, noble metal and transition metal-based catalysts with suitable redox ability, which could balance the deep dehydrogenation and over-oxidation of NH3, had been developed to apply in NH3-SCO reaction [12-15]. However, SCO performances of above NH3-SCO catalysts would be significantly affected by SO2 in flue gases [9, 16], which was due to the natural affinity between SO2 and active sites in SCO catalysts, consequently resulting in pronounced decrease in SCO activity and a shortened catalyst lifespan. Recently, research about promoting sulfur tolerance of catalysts had been widely studied in NH3-SCR reactions [17-19], while conquering the problem in NH3-SCO field still had long way to go as the existed SO2 would easily form ammonium sulfates with the reactant NH3 and seriously deactivate active sites on catalysts [15].
Based on previous works [20, 21], chromic (Cr) based catalysts with excellent redox ability showed exceptional resistance to sulfur, which had been detailly investigated in NH3-SCR reactions. As such, in our previous work [22], Cr-Ce mixed oxide catalysts had been developed to study NH3-SCO performances in the presence of SO2. It was found that the existence of SO2 could greatly suppress the unselective catalytic oxidation of ammonia over Cr-Ce mixed oxide catalysts at expense of significant decrease in SCO activity within low-medium temperatures. Inherently, the existed SO2 could induce the formation of surface sulfates on Cr-Ce mixed oxide catalysts, which enhanced surface acidity but disturbed redox cycles between Cr and Ce. As reported [23, 24], owing to better surface acidity to suppress SO2 adsorption and stable Ce-O-P groups to restrain being sulfation, CePO4 materials possessed better sulfur tolerance compared with CeO2. Thus, in this study, novel CePO4 material was applied to support Cr, aiming to enhance SCO performances and catalytic stability of Cr based catalysts in the presence of SO2.
Furthermore, TiO2 supported Cr sample was served as the contrasted catalyst. Particularly, the SCO performances of the Cr/CePO4 catalysts with varying Cr ratios were shown in Fig. S1 (Supporting information), where a doping ratio of 10 wt% for Cr was identified as optimal. The NH3-SCO performances and long-term stability in the presence of SO2 over Cr/CePO4 and Cr/TiO2 were conducted. Subsequently, reaction process and physiochemical properties had been evaluated by a range of analytical techniques, including X-ray diffraction (XRD), scanning electron microscopy (SEM), transmission electron microscopy (TEM), temperature program reductions, in-situ diffuse reflection infrared Fourier transform spectroscopy (DRIFTs) Notably, TiO2 or CePO4 supported Cr catalysts were denoted as CT or CP respectively, while CT-U or CP-U represented the two catalysts after 20 h stability tests in the presence of SO2.
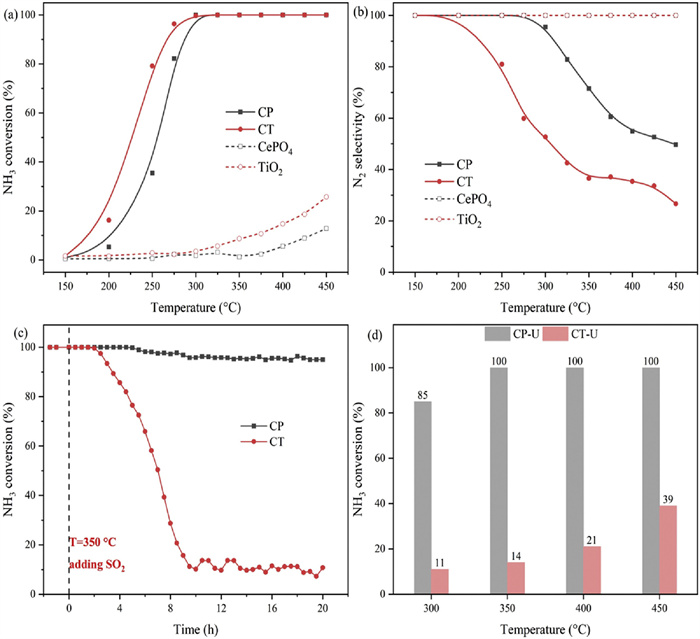
As shown in Figs. 1a and b, NH3-SCO activities of two carriers (CePO4/TiO2) were very poor, while addition of 10% Cr species significantly improved SCO activities but obviously decreased N2 selectivity. Compared with CT sample, T100 of CP catalyst shifted to higher temperature range by about 25 ℃, but better N2 selectivity within high temperature range had been achieved. Normally, well surface acidity derived from CePO4 could be responsible for that [25], as stronger surface acidity would inhibit redox performance of Cr species on CePO4 support. As such, the yield of N2O had been greatly suppressed on CP sample (Fig. S2 in Supporting information). Furthermore, as shown in Fig. 1, Fig. 1, CP sample could maintain highly stable SCO activity (about 95%) for 20 h reaction running in the presence of 350 ppm SO2 and 5 vol% H2O at 350 ℃, while CT sample experienced a significant loss in NH3 conversion within the initial 9 h, dropping from 100% to approximately 10%, and stabilized at this level thereafter. In addition, the outlet SO2 concentration detected in Fig. S3 (Supporting information) closely correlated with the changes in NH3 oxidation activity, gradually increasing until it eventually reached its inlet value in the final stage of stability tests. Moreover, from Fig. S4 (Supporting information), the catalytic stability of CP and CT samples was further tested at a relatively lower temperature (300 ℃). CP sample maintained approximately 70% SCO activity over 8 h of reaction, whereas NH3 conversion of CT sample rapidly decreased from 100% to approximately 20% within the first 3 h. Additionally, after stability tests, two samples possessed different SCO performances. In detail, NH3 conversion within 300–450 ℃ reached above 85% over CP-U sample, while that on CT-U sample was below 40%. Compared with their respective fresh samples, a slight decrease in NH3 conversion at 300 ℃ but notable enhanced N2 selectivity within operating windows could be observed on CP-U catalyst, while CT-U sample showed significant deterioration in SCO activity within medium-high temperature ranges. In all, novel CePO4 supported Cr catalyst showed superior SCO performances and robust stability in the presence of SO2.
Figure 1
Figure 1.
NH3 conversion (a), N2 selectivity (b) and catalytic stability (c) of various samples. NH3-SCO performance of various sample after stability tests (d). Reaction conditions: [NH3] = 100 ppm, [O2] = [H2O] = 5 vol%, [SO2] = 350 ppm (if applicable), N2 balance, GHSV = 40, 000 h-1.
To disclose different changes in physiochemical properties, XRD, TEM, and Brunauer-Emmett-Teller (BET) and Barrett–Joyner–Halenda (BJH) methods had been conducted. As shown in Table S1 (Supporting information), SBET of about 58 and 76 m2/g were obtained on TiO2 and CePO4 supports, while addition of Cr would decrease specific surface area to about 44 (CT) or 75 (CP) m2/g, possibly owing to the intercalation of certain Cr species into micro-channels of supports during preparation process [26]. Furthermore, after stability tests, CT-U and CP-U samples showed obvious decrease in specific surface area, where SBET of about 26 and 67 m2/g retained on CT-U and CP-U samples respectively. This should be caused by blockage effect derived from the formed sulfate species [27, 28]. Along with much higher contents of sulfur (S) or nitrogen (N) containing species deposited on CT-U sample analyzed by SEM (Fig. S5 and Table S2 in Supporting information), it was indicated that accumulation of ammonium sulfates on CT-U sample might be responsible for the pronounced decrease in specific surface area after stability tests [29]. And the transmission infrared spectra result in Fig. S6 (Supporting information) further verified above findings, as some IR bands ascribed to NH4+ and SO42- species could be detected. Additionally, as shown in Fig. S7 (Supporting information), XRD patterns of CT and CP samples were consistent with characteristic diffraction peaks of their respective supports (PDF #21–1272 and PDF #21–1276 of TiO2, PDF #34–1380 of CePO4), while no peaks ascribed to Cr species were detected, indicating the high dispersion of Cr species. Furthermore, 20 h reaction running in the presence of SO2 would weaken intensities of characteristic diffraction peaks on CT or CP catalysts, possibly owing to the damaged crystal structures by SO2 poisoning. And similar findings were confirmed by HR-TEM images (Fig. S8 in Supporting information), as blurred edges of crystals were observed on CT-U and CP-U samples compared with their respective fresh samples.
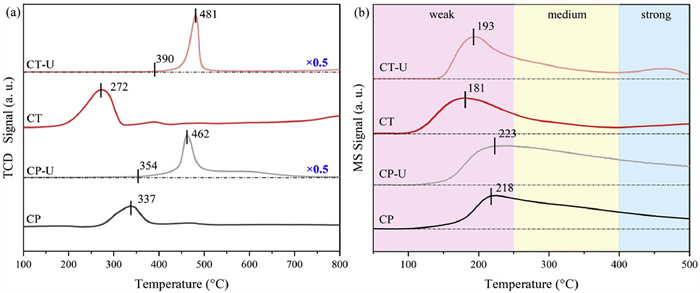
To elucidate possible changes in redox ability and surface acidity before and after stability tests, H2-TPR and NH3-TPD had been conducted over various samples. From Fig. S9 (Supporting information), it was obviously identified that CePO4 support showed superior redox ability and surface acidity compared with TiO2 support. Furthermore, as shown in Fig. 2a, reductive peaks located at 272 and 337 ℃ could be detected on CT and CP samples, respectively, which should be ascribed to reduction of CrOx [20]. Obviously, CT sample possessed better redox properties as the emerged H2 reduction peak showed much larger peak area and lower reductive temperature, which was in accordance with the fact of its comparative lower T100 and poorer N2 selectivity in Fig. 1. Particularly, much higher reductive temperature of CrOx species on CP sample could be mainly ascribed to the strong interactions between chromium oxides and acidic CePO4 support, which would weaken the reducibility of CrOx by an electronic interaction. And similar results had been found in previous works [29, 30]. Furthermore, the lowered Cr6+ to Crtotal ratio on CP sample (Fig. S10 and Table S3 in Supporting information) also verified the existence of strong interactions. After stability tests, the reductive temperature of main peak on CP-U sample shifted to 462 ℃, which was relatively lower than that on CT-U sample (481 ℃). Owing to the enhanced reductive peaks derived from sulfate species, it was assumed that sulfate species with much weaker stability deposited on CP-U sample. Furthermore, the initial reductive temperature of reduction peak on CP-U sample was about 354 ℃, while that on CT-U sample located at about 390 ℃. It was suggested that the existed strong metal-support interactions could reserve more active sites over CP-U sample to participate in SCO reactions, consequently ensuring its robust SCO performance during stability tests. And XPS analysis in Fig. S10 also confirmed that, compared with CT-U sample where a large amount of Cr6+ was reduced by SO2, the Cr6+/Crtotal ratio of CP-U sample decreased slightly. Additionally, from Table S3, it could be found that more sulfates and nitrogen containing species deposited on CT-U sample after stability tests compared with CP-U sample, as higher S and N atomic concentration were detected on CT-U sample. Along with the presence of NH4+ and SO42- species on transmission infrared spectra, it was implied that more serious accumulation of ammonium sulfates occurred on CT-U sample after stability tests [31], which well agreed with BET-BJH and SEM results. Moreover, TP-MS analysis of various samples in Fig. S11 (Supporting information) further corroborated the above results, revealing stronger intensities of signals corresponding to nitrogen-containing species on CT-U sample. Thus, the active sites on CT-U sample would be undoubtably covered by the deposited ammonium sulfates and then seriously deactivated redox ability of catalysts, consequently leading to the pronounced decline of SCO performances after stability tests.
Figure 2
Figure 2.
H2-TPR (a) and NH3-TPD (b) profiles of various fresh and used samples.
Moreover, from previous works [32, 33], the desorption peaks of NH3 could be divided into three sections within 50–250, 250–400 and 400–500 ℃, corresponding to NH3 desorbed from weak, moderate and strong acidic sites, respectively. As such, NH3-TPD profiles in Fig. 2b indicated that more strong acidic sites existed on CP sample compared with CT catalyst, as CP sample possessed much bigger area of NH3 desorption peaks within medium-high temperature range. Furthermore, after stability tests, surface acidity of CT-U and CP-U samples obviously enhanced compared with their respective fresh sample, which should be the electron-withdrawing effect of sulfate species deposited on catalysts [34]. And the above findings could be the reasons of promoted N2 selectivity of samples after stability tests.
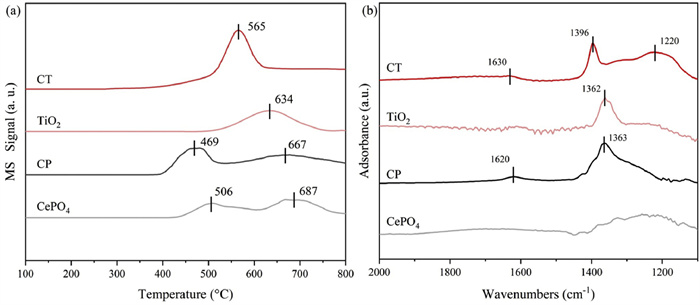
Additionally, SO2-TPD and DRIFT spectra of SO2+O2 co-adsorption had been conducted to disclose the robust sulfur tolerance of CP catalyst. As shown in Fig. 3a, compared with CT sample where strong SO2 desorption peak emerged at 565 ℃, CP sample showed lower desorption temperatures at 469 and 667 ℃ and smaller desorption area of SO2 desorption peaks, indicating the suppressed adsorption and oxidation of SO2 on CP catalyst. And the phenomena could be inherently derived from their supports, as differences in SO2-TPD results of CePO4 and TiO2 were like their respective Cr doped samples. These findings elucidated why CP catalyst demonstrated enhanced SCO activity and stability in the presence of SO2. To confirm existence status of the deposited sulfate species on catalysts, DRIFT spectra of SO2+O2 co-adsorption was conducted. As depicted in Fig. 3b, after exposure to 500 ppm SO2 + 5 vol% O2 at 350 ℃ for 1 h, various characteristic peaks emerged, which could be ascribed to H2O (1630, 1620 cm−1), surface sulfate species (1362, 1363, 1396 cm−1) and bulk-like sulfate species (1220 cm−1), respectively [35-37]. In comparison, CT catalyst exhibited abundant characteristic peaks ascribed to surface and bulk sulfate species, while CP sample only presented some peaks subjected to surface sulfate species. And the results were consistent with their respective supports. Notably, the bulk-like sulfate species usually possessed more harmful effect on the catalytic activity compared to the surface sulfate species [28, 32]. These findings indicated that CP sample possessed strong sulfur aversion feature compared with CT sample. In all, it could be concluded that the existed strong interactions and enhanced surface acidity significantly inhibited formation of sulfate species on CP catalyst [38, 39], which aligned with results of SO2-TPD and stability tests mentioned earlier.
Figure 3
Figure 3.
SO2-TPD (a) and DRIFT spectra of SO2+O2 co-adsorption (b) over various samples.
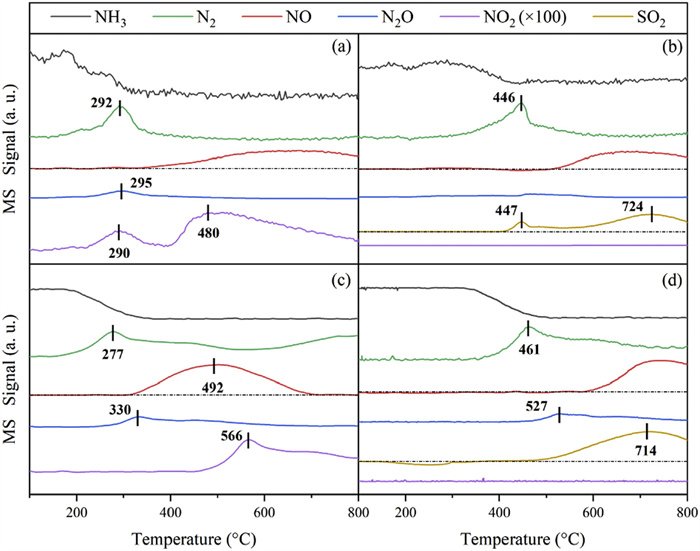
Subsequently, NH3+O2-TPSR spectra of various catalysts before and after stability tests were depicted in Fig. 4. As shown, for fresh samples, the released temperature of N2 signal progressively increased from 277 ℃ of CT sample to 292 ℃ of CP sample. Along with the heightened NO release signal observed on CT sample, it was suggested that strong NH3 oxidation ability on CT sample led to the generation of more by-products like NO and even NO2. Conversely, although NH3 oxidation ability of CP catalyst was slightly inferior, it demonstrated notable advantage in N2 selectivity. After catalysts being poisoned during stability tests, NH3 activation performances over CT-U and CP-U samples had been significantly restrained, specifically exhibiting the obvious retrograde release temperature of N2 signal peak over CP-U (446 ℃) and CT-U (461 ℃) samples. Furthermore, by-product yields of two poisoned catalysts were significantly suppressed, with almost disappearance of NO2 signal and weak NO signal shifted to higher temperature range. However, compared with CT-U sample, much lowered release temperature of strong N2 signal and the emerged weak NO signal on CP-U sample further confirmed its better SCO activity after stability tests. Additionally, focusing on SO2 signal peaks on two poisoned samples, CT-U sample exhibited a broad peak at 714 ℃, while CP-U sample displayed two separate peaks at 447 and 724 ℃. In comparison, the intensity and released temperature of emerged SO2 signal peaks on CP-U sample was significantly lower than that on CT-U sample, confirming that the deposited sulfate species on CP catalyst were less and unstably. And the above findings consistent with the results obtained from SO2-TPD and H2-TPR analysis.
Figure 4
Figure 4.
NH3+O2-TPSR profiles of various samples: CP (a), CP-U (b), CT (c) and CT-U (d).
In summary, this study focused on disclosing the mechanism of novel CePO4 supported Cr catalyst with superior sulfur tolerance for selective catalytic oxidation of ammonia. Experimental results indicated that CP catalyst maintained a stable NH3 conversion rate of approximately 95% at 350 ℃ in the presence of 5 vol% H2O and 350 ppm SO2 within 20 h reaction running. Moreover, CP-U sample demonstrated broad NH3-SCO operating temperature window, achieving over 85% NH3 conversion and well N2 selectivity within the temperature range of 300–450 ℃. Characterization results deduced that there existed strong interactions between chromium oxides and acidic CePO4 support, which slightly suppressed reactivity of active Cr species, thus somewhat lowering its low-medium temperature SCO activity. Importantly, the existence of strong interaction and enhanced surface acidity significantly impeded the adsorption and oxidation process of SO2, which weakened the deposition and thermal stability of sulfate species and retained more active sites to participate in SCO reactions, thereby enhancing its sulfur tolerance. As for TiO2 supported Cr sample, although remarkable NH3 oxidation ability had been achieved, its effectiveness would be significantly compromised in the presence of SO2. The coexistence of SO2 resulted in the accumulation of considerable ammonium sulfates on CT catalyst, which not only caused serious loss in specific surface area but also led to sulfation of active sites, consequently inducing a rapid decline in SCO activity during stability tests.
Declaration of competing interest
The authors declare that they have no known competing financial interests or personal relationships that could have appeared to influence the work reported in this paper.
The authors acknowledge for the financial support of National Key R & D Program of China (No. 2022YFC3701600), National Natural Science Foundation of China (Nos. 22276162 and 22306072), China Postdoctoral Science Foundation (No. 2023M731441) and Young Talent Fund of Jiaxing Science and Technology Project (No. 2023AY40030).
Supplementary materials
Supplementary material associated with this article can be found, in the online version, at doi:10.1016/j.cclet.2024.110420.
[1]
B. Gu, L. Zhang, R. Van Dingenen, M.A. Sutton, et al. Science 374 (2021) 758–762. doi: 10.1126/science.abf8623
[2]
Q. Zhang, Y. Zheng, D. Tong, et al., Proc. Natl. Acad. Sci. U. S. A. 116 (2019) 24463–24469. doi: 10.1073/pnas.1907956116
[3]
L. Ye, P. Lu, D. Chen, et al., Chin. Chem. Lett. 32 (2021) 2509–2512.
[4]
Y. Dong, P. Wang, X. Liu, et al., Chin. Chem. Lett. 35 (2024) 108635.
[5]
J. Du, J. Wang, Y. Shan, et al., Chin. Chem. Lett. 35 (2024) 108781.
[6]
L. Liu, W. Xiong, M. Fu, et al., Chin. Chem. Lett. 35 (2024) 108870.
[7]
H. Wang, T. Zhu, Y. Qiao, S. Dong, Z. Qu, Chin. Chem. Lett. 33 (2022) 5223–5227.
[8]
N. Zhu, Z. Lian, Y. Zhang, W. Shan, H. He, Chin. Chem. Lett. 30 (2019) 867–870.
[9]
Y. Yu, D. Wei, Z. Tong, et al., Chem. Eng. J. 442 (2022) 136356.
[10]
Y. Zhang, M. Zhang, Y. Zang, et al., ACS Catal. 13 (2023) 1449–1461. doi: 10.1021/acscatal.2c05226
[11]
H. Wang, T. Murayama, M. Lin, et al., ACS Catal. 12 (2022) 6108–6118. doi: 10.1021/acscatal.1c05762
[12]
F. Gao, Y. Liu, Z. Sani, et al., J. Environ. Chem. Eng. 9 (2021) 104575.
[13]
T. Lan, Y. Zhao, J. Deng, et al., Catal. Sci. Technol. 10 (2020) 5792–5810. doi: 10.1039/d0cy01137a
[14]
L. Zhou, M. Zhang, C. Liu, et al., ACS Appl. Energy Mater. 5 (2022) 14211–14221. doi: 10.1021/acsaem.2c02777
[15]
Z. Li, C. Wang, J. Qiu, et al., Chin. Chem. Lett. 35 (2024) 108432.
[16]
C. Chen, Y. Cao, S. Liu, W. Jia, Appl. Surf. Sci. 507 (2020) 145153.
[17]
J. Ji, L. Han, W. Song, et al., Chin. Chem. Lett. 34 (2023) 107769.
[18]
F. Wei, Y. Rao, Y. Huang, W. Wang, H. Mei, Chin. Chem. Lett. 35 (2024) 108931.

 DownLoad:

 下载:
下载:


 下载:
下载:
