Figure 1.
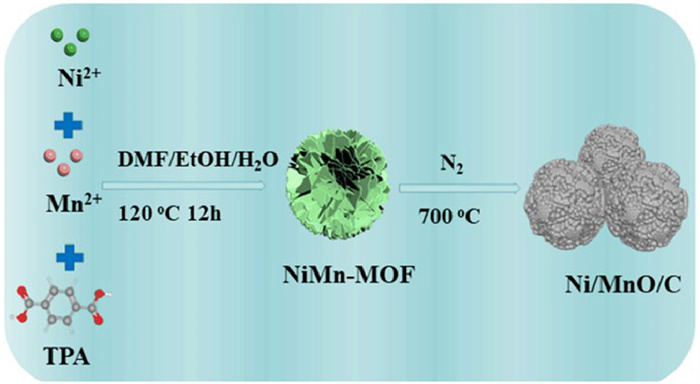
Schematic preparation process of NiMn-MOF and Ni/MnO/C.

Currently, electromagnetic waves (EMWs) have become a crucial means in the production and everyday life of modern society, being extensively utilized in wireless electronic communications, household appliances, electronic base stations, military radars, and other applications [1, 2]. Nevertheless, the excessive EMWs produced also present a significant threat to human health and the environment. To mitigate the effects of EMWs, scientists have created numerous EMWs absorbing materials that can capture and transform EMWs into alternate forms of energy for dissipation. An ideal EMWs absorbing material should possess a broad absorption bandwidth, low filling mass, minimal material thickness, and high absorption capacity [3, 4]. Achieving the desired effect with just one material and a single loss mechanism is challenging. As a result, researchers are now focusing on developing composite materials that can satisfy the mentioned criteria.
After a lot of research, there are many materials that exhibit good electromagnetic wave absorption (EMWA) characteristics, such as iron [5], cobalt [6], nickel [7], and transition metal oxides [8-10]. There are also other materials with dielectric loss, such as reduced graphene oxide [11], carbon materials [12], barium titanate [13], conductive polymers [14], MXene [15]. For example, Dong et al. used coaxial electrospinning and high-temperature carbonization process to prepare Fe/C core-shell nanofibers. By varying the carbonization temperature, the Fe/C-800 ℃ composite exhibited a minimum reflection loss (RLmin) value of −20.6 dB at a corresponding thickness of 2.5 mm, and an effective absorption bandwidth (EAB) of 3.84 GHz at 2.9 mm with a mass loading of 10% [16]. Zhang et al. synthesized carbon-based nanofibers by electrospinning and vacuum carbonization, and Co and CoO were introduced into carbon nanofibers (CNFs) at the same time. The sample acquired at a carbonization temperature of 650 ℃ exhibited a RLmin of −43.57 dB at a thickness of 3 mm, and an EAB of 5.78 GHz at 2.5 mm with a 10% loading ratio [17]. Yin et al. obtained a Ni/NiO@C composite material with a radial structure by hydrothermal and high-temperature annealing methods. When the filling amount is 40%, the EAB of the prepared composites reaches an ultra-wide frequency range of 9.07 GHz at a matching thickness of 1.79 mm [18]. The above studies show that magnetic metals usually have large saturation magnetization, high snooker limit, excellent magnetocrystalline anisotropy and Curie temperature, and strong magnetic loss properties, which are extensively employed in the realm of EMWA. The combination of magnetic metals with dielectric dissipation is a good strategy to achieve efficient composite absorbers.
Metal-organic frameworks (MOFs) are coordination compounds formed through coordination reactions involving metal ions as nodes and organic substances containing nitrogen and oxygen as ligands. As a precursor, they can be transformed into metal or metal oxide carbon-based materials through high-temperature pyrolysis, offering numerous advantages including multiple loss mechanisms, a distinctive porous structure, chemical stability, and lightweight properties [19-22]. However, monometallic MOF derivatives have fewer components and limited loss performance. Bimetallic MOFs can flexibly change the type and ratio of metal ions to optimize the dielectric and magnetic properties of materials, so as to control impedance matching and EMWA performance [23, 24]. For instance, Xiong et al. synthesized NiCo nanoparticle/graphitic carbon/nanoporous carbon (NiCo/GC/NPC) core-shell nanocomposites using metal-organic frameworks. When the molar ratio of nickel to cobalt is 1:2, and then pyrolysis at high temperature to obtain Ni1Co2/GC/NPC nanocomposites, when the filling ratio is 30%, the RLmin value is −52.2 dB, and the EAB is 7.2 GHz [25]. Jia et al. By pyrolyzing ZnCo-MOF@ multi-walled carbon nanotubes produced composites of Co/ZnO/C@ multi-walled carbon nanotubes. This synthesis resulted in an RLmin of −41.75 dB at 2.4 mm and an EAB of 4.72 GHz at 2.2 mm with a 10% sample content [26]. Wang et al. successfully prepared novel layered multi-interface Ni@C@ZnO microspheres after annealing the bimetallic NiZn-MOF precursor. Ni@C@ZnO material shows high performance of microwave absorption with the sample filling is 25%, and the RLmin reached −55.8 dB, and the EAB covered 4.1 GHz at 2.5 mm [27].
MnO is a classic transition metal oxide, with findings indicating that it features a wide band gap and low conductivity. This property allows MnO to effectively control the dielectric of the material, addressing the impedance mismatch issue often encountered by absorbing materials [28]. Zeng et al. prepared Co/MnO/C nanocomposite fibers by electrospinning and high-temperature pyrolysis process. Co is used as a magnetic nanoparticle to provide magnetic loss, and manganese monoxide particles are used to adjust the impedance matching. The resulting sample have a RLmin intensity (−71.7 dB)and a decent EAB (6.3 GHz) with the absorber thickness of 2.3 and 2.6 mm, respectively [29]. Liu et al. used electrospinning and high-temperature pyrolysis to prepare Ni/MnO/C nanofiber materials. When the amount ratio of MnO/Ni is 1:1, the EAB of the obtained nanocomposites is 6.5 GHz and the RLmin is −53.23 dB at 2.9 and 2.3 mm, respectively [30]. Zhang et al. prepared derivatives of MnCo-MOF by hydrothermal method and high-temperature pyrolysis, whose RLmin was as high as −68.89 dB at 2.64 mm, and extended EAB even 5.3 GHz at 2.3 mm [31].
In order to simplify the preparation process, NiMn-MOF was directly prepared by a simple hydrothermal method. Then, after high-temperature pyrolysis, a special porous spherical structure of Ni/MnO/C composites was obtained. The absorption performance of the obtained sample at 700 ℃ was the best with the filling amount is 30%, the RLmin value reaches −19.2 dB at 17.6 GHz with a matched thickness of 1.4 mm, and the EAB was as broad as 5.04 GHz at only 1.6 mm thickness. Such effective EMWA performance ascribe the magnetic loss arising from the presence of Ni, and the three-dimensional porous carbon microsphere's structure, which provides a way for the multiple reflection and scattering of EMWs inside the material, and provides a medium for the transmission and transition of electrons, which not only improves the probability of EMWs entering the material, but also produces conduction loss, converts electromagnetic energy into Joule heating and is dissipated. The low conductivity of MnO can adjust the high dielectric properties generated by Ni and C, optimize impedance, create numerous heterostructure interfaces, induce interface polarization, and enhance the material's attenuation performance.
The preparation of flower NiMn-MOF was based on previous reports [32]. First, 4.0 mmol of 1, 4-terephthalic acid, 2.0 mmol of Ni (NO3)2·6H2O and 2.0 mmol of MnCl2 were dissolved in 25 mL of N, N-dimethylformamide solution and stirred magnetically for 20 min at room temperature. Then add 2 mL of ethanol and 2 mL of deionized water and continue to stir for 10 min. The resultant solution was transferred into a high-pressure PTFE reaction vessel, and subsequently placed in an oven to be heated at 120 ℃ for a duration of 12 h After the reaction is cooled to room temperature, the obtained product is filtered and washed 3 times with deionized water and ethanol. Finally, it is dried overnight in a vacuum drying oven at 60 ℃ to obtain a uniform green powder.
The prepared NiMn-MOF was put into a porcelain boat and fed into a vacuum tube furnace. It is heated to a suitable temperature (600, 700, 800 ℃) with a programmed heating rate of 2 ℃/min and kept warm for 2 h. During the high-temperature pyrolysis process, N2 is continuously passed as protective gas to prevent the sample from being oxidized by oxygen. According to the different pyrolysis temperatures, the obtained samples are labeled as NMC-600, NMC-700, and NMC-800.
The chemical composition and crystal structure of samples NMC-600, NMC-700, and NMC-800 were analyzed by X-ray diffraction (XRD, Bruker D8 Advance A25). X-ray photoelectron spectroscopy (XPS, Thermo Fischer ESCALAB Xi+) was used to investigate the valency of the surface of the sample NMC-700. The Raman spectra of the samples NMC-600, NMC-700 and NMC-800 were measured with a Raman spectrometer (Lab RAM HR800) between 1000 cm-1 and 2000 cm-1. The saturation magnetization and coercivity of the all samples were measured with a vibrating sample magnetometer (VSM) at a test temperature of 40–50 ℃. The morphology, microstructure and elemental composition of NMC-700 were observed by field emission scanning electron microscopy (FE-SEM, FEI Nova SEM450), transmission electron microscopy (Talos F2000X) and energy dispersive X-ray spectroscopy (EDX). All of the samples were homogeneously mixed with paraffin wax at a mass ratio of 3:7, compacted into circular samples with an internal strength of 3.04 mm and an outer diameter of 7.0 mm, and the electromagnetic properties of all samples within the 2–18 GHz frequency range were evaluated using a vector network analyzer (N5234A, Agilent, USA) to determine the reflection coefficient and attenuation characteristics.
The synthesis of Ni/MnO/C composites is depicted in Fig. 1. The process involves preparing a NiMn-MOF precursor using a hydrothermal method and then conducting high-temperature pyrolysis under a N2 atmosphere to obtain the black porous spherical composite Ni/MnO/C. Ni contributes to magnetic loss, while the porous carbon network structure enhances multiple reflections and scatterings of EMWs and improves multiple attenuations. MnO particles prevent aggregation of magnetic metals, adjust dielectric properties, create diverse interfaces, increase polarization losses, and enhance EMW absorber performance.
Fig. 2a shows the XRD patterns of samples NMC-600, NMC-700, and NMC-800. The three samples have distinct diffraction peaks at 44.50° (110), 51.84° (200), and 76.37° (220) of Ni metal (JCPDS No. 04–0850), respectively [33]. Additional peaks at 2θ = 34.65° (111), 40.22° (200), 58.19° (220), 69.53° (311), and 73.11° (222) can be indexed MnO, respectively (JCPDS No. 73–1533) [34]. It can be seen that with the increase of carbonization temperature, the intensity of the MnO diffraction peak gradually decreases and is almost observable in the sample NMC-800. In addition, the diffraction peak observed at 25.3° corresponds to the (002) crystal plane of graphitic carbon (JCPDS 41–1487) [26], which is masked by the high and strong peaks of Ni and MnO. The above results indicate that Ni/MnO/C composites have been synthesized.
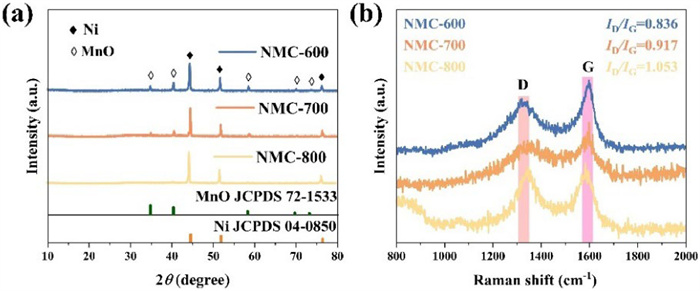
Fig. 2b shows the Raman spectra of all samples. Significant diffraction peaks can be observed in the wavelength range around 1360 cm-1 and 1580 cm-1 for all three samples. Generally speaking, the diffraction peaks in these two wavelength ranges are called D-band and G-band respectively, and the ratio of ID/IG is often used to judge the degree of graphitization in the material [35]. The ID/IG values for all samples were calculated to be 0.836, 0.917, and 1.053, respectively. This suggests that the level of graphitization of the sample rises in tandem with the escalation of the pyrolysis temperature. The stronger the graphitization, the stronger the conductivity, resulting in stronger dielectric properties [36, 37].
Fig. 3a shows the hysteresis loop plots of the samples, and it can be observed that all the samples are S-shaped hysteresis loops, indicating that they all have typical soft magnetic properties [38]. In Fig. 3b, the saturation magnetization (Ms) values of NMC-600, NMC-700, and NMC-800 are 24.056, 37.145 and 43.007 emu/g, respectively. It may be that the high temperature favors the nucleation crystallization of Ni metal, increasing the content of magnetic metal Ni, thereby enhancing the saturation magnetization [39], corresponding to the XRD characterization structure. The coercivity (Hc) values were 23.69, 42.83 and 27.19 Oe, respectively, which is affected by the size of the crystal particles [39].
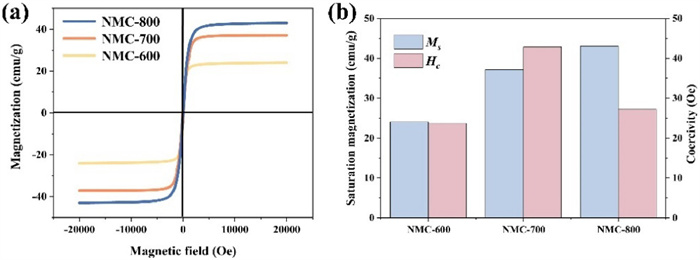
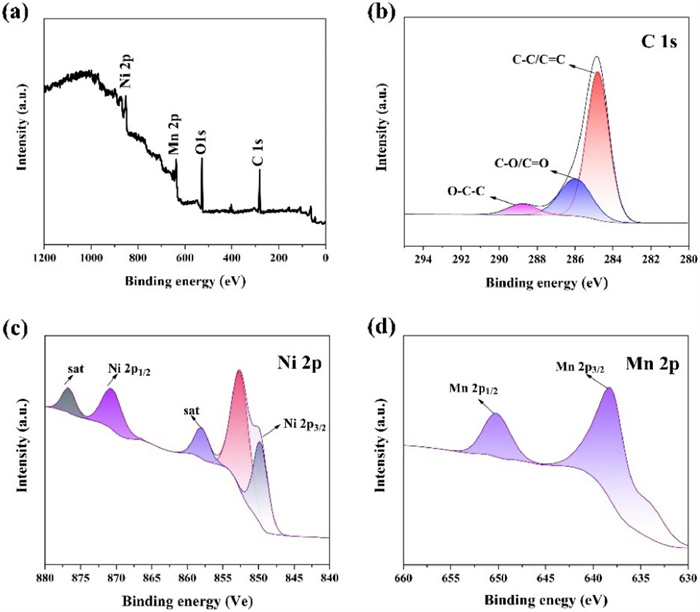
Fig. 4a shows the XPS spectrum of the sample NMC-700, which can be used to demonstrate that the sample is composed of C, O, Ni, and Mn elements. Fig. 4b shows the high-resolution diffraction spectrum of C 1s, which can be seen at 284.8, 286.3, and 289.1 eV, consisting of three diffraction peaks attributed to C—C/C—C, C—O/C=C, and O—C-O bonds, respectively [21]. Fig. 4c is a high-resolution diffraction spectrum of Ni 2p, with two typical diffraction peaks around 851.93 eV and 870.77 eV being Ni 2p3/2 and Ni 2p1/2 of the metal Ni0, and the corresponding satellite peaks of Ni 2p3/2 and Ni 2p1/2, respectively. Here there are two different valence states of Ni metal, indicating that Ni is inevitably oxidized by oxygen in the air [40]. Fig. 4d is a high-resolution diffraction spectrum of Mn 2p. It can be seen that the two peaks of electron binding energy at 641.3 and 653.1 eV correspond to Mn 2p3/2 and 2p1/2, respectively, which is consistent with the binding energy values of MnO reported in the previous literature [41]. Based on the above analysis, the sample NMC-700 is composed of Ni, MnO, and C, and also corresponds to the XRD results.
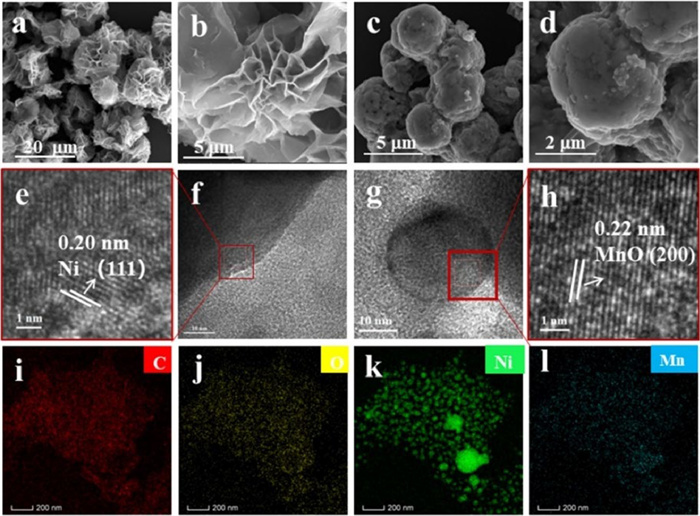
Figs. 5a and b are the low- resolution and high- resolution images of NiMn-MOF, respectively, and it can be seen that the NiMn-MOF is in the shape of a tremella fungus with a diameter of about 10 µm. Figs. 5c and d are the low- resolution and high-resolution images of the NiMn-MOF derivatives after pyrolysis, respectively, the organic matter in the MOFs is pyrolyzed and carbonized, resulting in structural contraction, and the metal particles are gathered together to form a composite material with a spherical structure of about 5 µm. Fig. 5d show that the microspheres are assembled from abundant small particles. Figs. 5e-h are the TEM plot of the NMC-700, and Figs. 5e and h are the high-resolution TEM plots of the NMC-700. The lattice spacing of 0.20 and 0.22 nm should be assigned to the (111) crystal plane of metal Ni and the (200) crystal plane of MnO, respectively [29, 42]. Figs. 5i-l is the energy-dispersive X-ray spectrum of NMC-700, which further demonstrates the existence of C, O, Ni, and Mn elements, which is consistent with the XPS results. From the characterization results of SEM and TEM, it can be concluded that the morphology of NMC-700 is a spherical structure in which Ni and MnO particles are uniformly dispersed in a carbon skeleton.
The relative complex permittivity (εr = ε′ - jε″) and complex permeability (μr = μ′ - jμ″) are the factors affecting the EMWA characteristics of materials. The real part of the complex permittivity (ε′) and complex permeability (μ′) signify the material's ability to store electrical and magnetic energy, respectively. The imaginary parts (ε″) and (μ″) stand for the material's dissipation capacity, respectively [43, 44]. Figs. 6a and b show the ε′ and ε″ of all samples in the 2–18 GHz frequency range. Specifically, the ε′ of NMC-600, NMC-700 and NMC-800 are 4.95–4.36, 17.46–8.87 and 24.94–8.57, respectively. The ε″ of NMC-600, NMC-700 and NMC-800 are 0.53–0.29, 11.20–4.76 and 17.89–9.04, respectively. This may be due to the increase of pyrolysis temperature, the degree of graphitization and conductivity is enhanced, and the dielectric is also improved. Besides, the increased temperature promotes the nucleation and crystallization of metal Ni, increases the content of metal, and also enhances the conductivity and dielectric properties of the material. Fig. 6e is the tanδε = (ε″/ε′) plot for all samples, and the magnitude of the tanδε value can be used to evaluate the dielectric loss properties [45]. It is obvious that NMC-800 has the largest tanδε value, which is said to have the greatest dielectric loss performance. NMC-600 has the smallest tanδε value, indicating that its dielectric loss ability is the worst, which may be attributed to the low level of graphitization and the excessive MnO content also inhibits the overall conductivity. The NMC-700 has a suitable dielectric loss capability.

In accordance with the Debye theory, the dielectric loss is influenced by both polarization and conductive loss. The Cole-Cole semicircle has been employed to elucidate the polarization process based on Eq. 1 [31].
|
|
(1) |
The greater the number of semicircles, the more indicative of the presence of polarization processes [46]. As can be seen from Fig. S1 (Supporting information), more semicircles were found in the NMC-700 and NMC-600 curves compared to NMC-800, indicating that the NMC-700 and NMC-600 samples exhibited more polarization characteristics. In addition to the dipole polarization caused by heteroatom O, there are also polarization centers generated by the boundary between graphitization and disordered carbon. The graphitization degree of NMC-700 is moderate, so there are more polarization centers and stronger polarization losses [47]. In addition, NMC-700 has a suitable MnO content, which produces a substantial number of heterogeneous interfaces and rich interface polarization losses [48]. The above reasons lead to the strong polarization loss ability of the sample NMC-700. In addition, a tail was observed for 3 samples at the Cole-Cole curve. NMC-700 and NMC-800 have a longer tail than NMC-600, indicating that all samples have conduction losses, and NMC-700 and NMC-800 have relatively strong conduction losses. This is because the organic matter is pyrolyzed and carbonized, and the higher the pyrolysis temperature, the higher the degree of graphitization, and the porous carbon skeleton formed provides a good channel for the free movement and jumping of electrons, forming a complete conductive network and transmission path. In Ni/MnO/C composites, The Ni and MnO particles serve as interconnected nodes, while the carbon skeleton functions as the electron conduction network. This arrangement effectively lowers the energy barrier for electron migration and facilitates the conversion of passing electromagnetic energy into Joule heat [48].
Figs. 6c and d are the μ′ and μ″ curves of NMC-600, NMC-700 and NMC-800, respectively. In general, the values of μ′ and μ″ gradually decrease with the increase of frequency, and the μ″ value is negative in the high-frequency range, which may be the outward radiation energy of EMWs absorbing materials [49]. The proximity of the μ′ of the permeability of all composites indicates that they have similar magnetic storage capacity. However, the μ″ value gradually increases with the rise of pyrolysis temperature, which indicates that NMC-800 has strong magnetic loss ability, and NMC-600 has weak magnetic loss ability. The trend of tanδμ (tanδμ = μ″/μ′) is the same as that of μ″, which also proves the above conclusion (Fig. 6f). In most cases, natural resonance and exchange resonance are the two main loss mechanisms of magnetic loss [50]. When it comes to determining whether the magnetic loss contributes to eddy current loss, it can be evaluated by C0 = μ″(μ′)−2f-1. According to the results in Fig. S2 (Supporting information). Between 2–6 GHz, C0 diminishes as the frequency increases, indicating the predominance of natural and exchange resonances in magnetic loss. In the 6–18 GHz range, the variation in C0 is not substantial, but multiple resonance peaks emerge at 12–18 GHz, signifying the dominance of eddy current loss and ferromagnetic resonance in the 6–18 GHz frequency band. Significantly, within the 2–18 GHz range, the tanδε (Fig. 6e) for all samples exhibits a greater magnitude than the tanδμ value (Fig. 6f), implying a notably superior dielectric loss compared to magnetic loss.
Based on the transmission line theory, we calculated the values of reflection loss (RL) at different frequencies (f) and thicknesses (d) using the following Eqs. 2 and 3 and the measured data of dielectric constant and permeability [51].
|
|
(2) |
|
|
(3) |
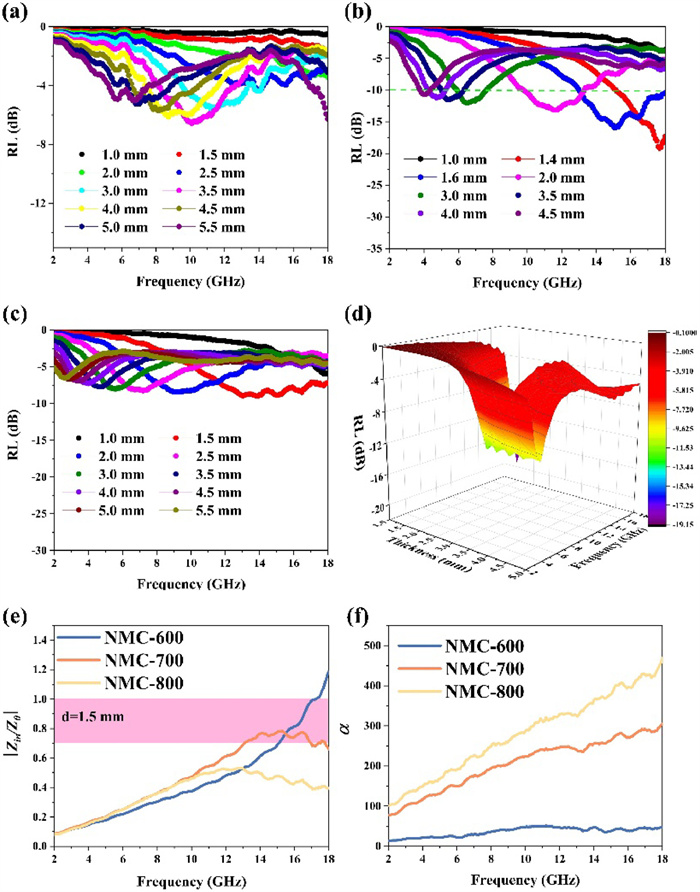
Generally, when the RL is below −10 dB, 90% of the EMWs contained within the substance are dissipated. This frequency range, characterized by an RL value below −10 dB (RL < −10 dB), is also recognized as the effective absorption bandwidth (EAB) [52]. Figs. 7a-d show that NMC-700 has the best EMWA performance. The NMC-700 sample had a measured RLmin of −19.1 dB at 17.5 GHz with a low matching thickness 1.4 mm and an EAB of 5.04 GHz at a thickness of 1.6 mm (Figs. 7b and d). For NMC-600 with more MnO, the RLmin was −6.5 dB a t 3.5 mm thickness (Fig. 7a). However, with a further increase in Ni content, the RLmin of NMC-800 decreases to −8.4 dB (Fig. 7c). It is clear that only NMC-700, which produces the appropriate ratio of Ni and MnO at the right pyrolysis temperature, has the best EMWA capacity. Impedance matching (|Zin/Z0|) and attenuation constant (α) are two important coefficients that determine the absorption performance of EMWs. It is generally believed that when (|Zin/Z0|) value is in the range of 0.7–1.2, the impedance is well matched. As shown in Fig. 7e, at a matching thickness of 1.5 mm, the NMC-700 (Zin/Z0|) values occupy the widest frequency range in the range of 0.7–1.2, which means that NMC-700 has better impedance matching, followed by sample NMC-600. In comparison, NMC-800 at this thickness, the (|Zin/Z0|)value is far away from the range of 0.7–1.2, indicating that the impedance is not well matched, and the EMWs cannot enter the material efficiently and is dissipated.
α is a parameter for the comprehensive evaluation of electromagnetic loss capacity, which can be delineated by the Eq. 4 [53].
|
|
(4) |
As depicted in Fig. 7f, the attenuation curves of all samples continue to increase with the increment of pyrolysis temperature, NMC-800 exhibits the highest α value, signifying its superior capacity for attenuating EMWs. From the above impedance matching, NMC-800 has a strong attenuation ability, the impedance does not match, resulting in EMWs cannot enter the material and are attenuated. Although NMC-600 has a certain impedance matching, the attenuation ability is poor, resulting in poor absorbing performance. Only NMC-700 possesses favorable impedance and robust attenuation, and the amalgamation of these attributes contributes to its exceptional EMWA characteristics.
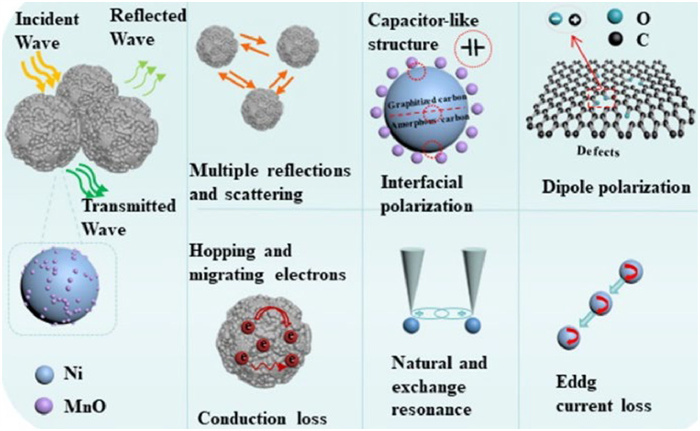
Upon the aforementioned analysis, we propose the mechanism of EMW absorption, as illustrated in Fig. 8. First, the composite material's porous structure enhances EMW attenuation by promoting multiple reflection and scattering, as well as optimizing impedance matching through reduced dielectric disparity with air [54]. Second, the carbon matrix from MOFs facilitates electron migration and hopping, increasing conduction loss. Interconnected nodes of Ni and MnO particles, along with the carbon skeleton, ease the energy barrier for electron migration, supporting conduction loss effectively [45, 55]. Third, MOF derivatives with oxygen-based functional groups intensify polarization dissipation through dipole alignment with oxygen atoms. Post-pyrolysis, the carbon-based materials exhibit a mix of graphitized and disordered carbon, creating enhanced polarization loss. Heterogeneous interfaces among Ni, MnO, graphitized carbon, and disordered carbon further amplify interface polarization loss due to varying conductivity, resembling a capacitor-like structure. When exposed to an external electromagnetic field, energy is reduced [56]. Lastly, evenly dispersed nickel nanoparticles in the materials boost magnetic loss capability through natural and exchange resonances at lower frequencies, as well as ferromagnetic resonance and eddy current losses at higher frequencies [57].
In summary, NiMn-MOF was successfully synthesized using a one-step hydrothermal method. By adjusting the pyrolysis temperature, absorption performance could be optimized easily. NMC-700 product, which displayed efficient EMWA performance. With an RLmin of −19.2 dB at 1.4 mm thickness and an effective absorption bandwidth up to 5.04 GHz at 1.6 mm thickness, the exceptional EMWA performance was attributed to the material's unique porous spherical structure, optimized impedance matching, suitable conduction loss, rich interfacial and dipole polarization, and magnetic loss mechanisms. This study offers a simple method for producing highly effective composite absorbers.
The authors declare that they have no known competing financial interests or personal relationships that could have appeared to influence the work reported in this paper.
Chunwei Lei: Writing – original draft, Methodology, Investigation. Jian Li: Writing – original draft, Methodology, Investigation. Bo Xu: Methodology, Investigation. Yu Xie: Writing – review & editing, Supervision, Data curation. Yun Ling: Methodology, Investigation. Juhua Luo: Writing – review & editing, Supervision, Data curation. Wei Zhang: Writing – review & editing, Supervision, Data curation.
This work was financially supported by the National Natural Science Foundation of China (Nos. 20904019, 51273089, 52173267), the Aviation Science Foundation of China (No. 2017ZF56020) and the First Training-class High-end Talents Projects of Science and Technology Innovation in Jiangxi Province (No. CK202002473).
Supplementary material associated with this article can be found, in the online version, at doi:
J. Wang, Y. Wang, R. Jiang, et al., Mat. Today Phys. 35 (2023) 101126.
Z. Su, S. Yi, W. Zhang, et al., Nano-Micro Lett. 15 (2023) 183.
F. Wu, P. Hu, F. Hu, et al., Nano-Micro Lett. 15 (2023) 194.
S. Li, Y. Sun, L. Zhang, X. Jiang, H. Yu, Mat. Today Phys. 42 (2024) 101390.
K.S. Sista, S. Dwarapudi, D. Kumar, G.R. Sinha, A.P. Moon, J. Alloy. Compd. 853 (2021) 157251.
J. Zhang, Y. Su, H. Zhang, Z. Luo, Q. Yu, Ceram. Int. 47 (2021) 30616–30627.
Y. Qian, X. Meng, H. Liu, et al., Adv. Mater. Interfaces 10 (2023) 2201604.
G. Dai, R. Deng, T. Zhang, Y. Yu, L. Song, Adv. Funct. Mater. 32 (2022) 2205325.
G. Dai, R. Deng, X. You, et al., J. Mater. Sci. Technol. 116 (2022) 11–21.
G. Dai, X. You, R. Deng, et al., Adv. Funct. Mater. 34 (2024) 2308710.
X. Wang, Y. Lu, T. Zhu, S. Chang, W. Wang, Chem. Eng. J. 388 (2020) 124317.
R. Xu, D. Xu, Z. Zeng, et al., Chem. Eng. J. 427 (2022) 130796.
P. Gong, Y. Li, C. Xin, et al., Carbon 194 (2022) 257–266.
K. Muhammad Zarrar, G. Iftikhar Hussain, A.T. Farooq, Ceram. Int. 49 (2023) 27796–27814.
Z. Liu, Y. Zhao, S. Li, et al., ACS Appl. Nano Mater. 5 (4) (2022) 5764–5775. doi: 10.1021/acsanm.2c00829
S. Dong, J. Li, N. Li, et al., Ceram. Int. 49 (2023) 8181–8189.
Y. Zhang, Y. Shen, M. Dang, F. Zhang, X. Du, Ceram. Int. 47 (2021) 9178–9187.
P. Yin, L. Zhang, J. Wang, et al., Ceram. Int. 48 (2022) 12979–12987.
Y. Liu, X. He, Y. Wang, et al., Small 19 (2023) 2302633.
S. Zhang, G. Liu, S. Lv, et al., Chem. Eng. J. 468 (2023) 143763.
X. Wang, L. Zhang, E. Ding, et al., Carbon 214 (2023) 118316.
Z. Chen, J. Zhou, X. Fu, et al., Chem. Eng. J. 474 (2023) 145917.
X. Xu, F. Ran, Z. Fan, et al., Carbon 171 (2021) 211–220.
Z. Liu, J. Chen, M. Que, et al., Chem. Eng. J. 450 (2022) 138442.
J. Xiong, Z. Xiang, B. Deng, et al., Appl. Surf. Sci. 513 (2020) 145778.
Z. Jia, M. Kong, B. Yu, et al., J. Mater. Sci. Technol. 127 (2022) 153–163.
L. Wang, X. Yu, X. Li, et al., Chem. Eng. J. 383 (2020) 123099.
M. Liu, R. Tian, H. Chen, et al., J. Magn. Magn. Mater. 499 (2020) 166289.
S. Zheng, Z. Zeng, J. Qiao, Y. Liu, J. Liu, Compos. Part. A 155 (2022) 106814.
Y. Liu, Z. Zeng, S. Zheng, et al., Compos. Part. B 235 (2022) 109800.
X. Zhang, X. Tian, C. Liu, et al., Carbon 194 (2022) 257–266.
D. Zheng, H. Wen, X. Sun, et al., Chem. Eur. J. 26 (2020) 17149–17155. doi: 10.1002/chem.202003220
N. Zhai, J. Luo, M. Xiao, et al., Carbon 203 (2023) 416–425.
J. Luo, X. Li, W. Yan, P. Shu, Ji. Mei, Carbon 205 (2023) 552–561.
R. Jiang, Y. Wang, J. Wang, Q. He, G. Wu, J. Colloid. Interf. Sci. 648 (2023) 25–36.
B. Wen, H. Yang, Y. Lin, et al., Compos. Part A 138 (2020) 106044.
B. Deng, Z. Xiang, J. Xiong, et al., Nano-Micro Lett. 12 (2020) 1–16.
Y. Jiao, Z. Dai, M. Feng, J. Luo, Y. Xu, Mat. Today Phys. 33 (2023) 101058.
Y. Lü, Y. Wang, H. Li, et al., ACS Appl. Mater. Interfaces 7 (2015) 13604–13611. doi: 10.1021/acsami.5b03177
L. Lei, Z. Yao, J. Zhou, et al., Carbon 173 (2021) 69–79.
H. Zhao, X. Yang, C. Jin, M. Li, Y. Cheng, Ceram. Int. 49 (2023) 35982–35990.
Y. Qiu, H. Yang, M. Liu, et al., Appl. Surf. Sci. 645 (2024) 158885.
K. Rajesh, S. Sumanta, J. Ednan, Carbon 211 (2023) 118072.
Q. Su, Y. He, D. Liu, et al., J. Colloid. Interf. Sci. 650 (2023) 47–57.
H. Peng, Z. Xiong, Z. Gan, C. Liu, Y. Xie, Compos. Part. B: Eng. 224 (2021) 109170.
C. Zhou, C. Wu, M. Yan, Chem. Eng. J. 370 (2019) 988–996.
B. Wen, M. Cao, Z. Hou, et al., Carbon 65 (2013) 124–139.
Z. Yang, Y. Zhang, M. Li, et al., ACS Appl. Energy Mater. 2 (2019) 7888–7897. doi: 10.1021/acsanm.9b01881
B. Zhao, N. Wu, S. Yao, et al., ACS Appl. Nano Mater. 5 (2022) 18697–18707. doi: 10.1021/acsanm.2c04460
X. Shen, K. Ran, B. Zheng, F. Chen, Mater. Lett. 321 (2022) 132373.
P. Miao, J. Chen, J. Chen, J. Kong, K. Chen, Chin. J. Chem. 41 (2023) 1080–1098. doi: 10.1002/cjoc.202200691
Y. Yang, L. Xia, T. Zhang, et al., Chem. Eng. J. 352 (2018) 510–518. doi: 10.12799/jkachn.2018.29.4.510
L. Wang, S. Su, Y. Wang, ACS Appl. Nano Mater. 5 (2022) 17565–17575. doi: 10.1021/acsanm.2c02977
R. Zhang, J. Qiao, X. Zhang, et al., Mater. Chem. Phys. 289 (2022) 126437.
H. Wu, R. Tian, F. Huang, et al., Carbon 196 (2022) 552–561.
L. Liang, W. Gu, Y. Wu, et al., Adv. Mater. 34 (2022) 2106195.
Y. Wang, X. Zhou, L. Han, et al., Ceram. Int. 49 (2023) 35476–35487.

Figure 2 (a) XRD patterns for NMC-600, NMC-700, and NMC-800. (b) Raman spectra of NMC-600, NMC-700, and NMC-800.

Figure 3 (a) The hysteresis curves and (b) Ms and Hc of NMC-600, NMC-700, and NMC-800.

Figure 5 SEM images of NiMn-MOF (a, b), and NMC-700 (c, d). TEM images of NMC-700 (e-h), and elemental mapping images of the NMC-700 sample (i-l).

Figure 6 (a, b) Real and imaginary parts of permittivity, (c, d) real parts and imaginary parts of permeability, (e, f) dielectric and magnetic loss tangent of all the samples.

Figure 7 RL graphs of NMC-600 (a), NMC-700 (b), NMC-800 (c) and 3D RL graphs of NMC-700 (d). 2D |Zin/Z0| graphs of all samples at 1.50 mm (e) and ɑ value of all samples (f).

 扫一扫看文章

扫一扫关注我们
 DownLoad:

 下载:
下载:


 下载:
下载: