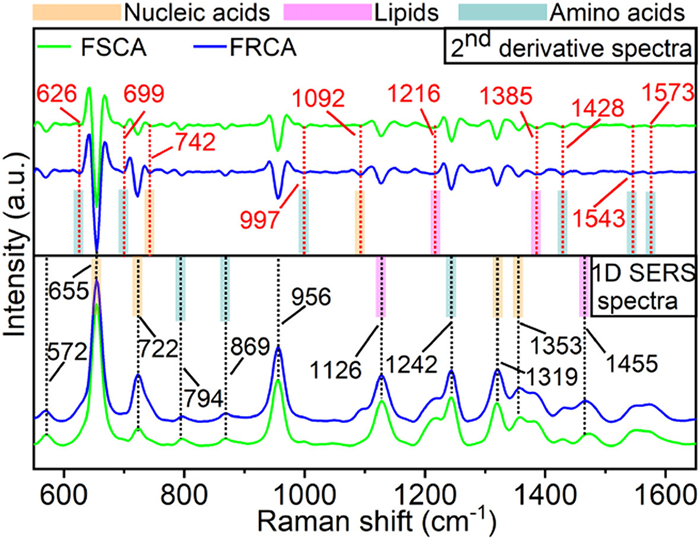
Figure 1.
1D SERS and 2nd derivative spectra of FRCA and FSCA.
Dynamic surface-enhanced Raman spectroscopy-based metabolic profiling: A novel pathway to overcoming antifungal resistance
Hao Li , Hanzhi Lu , Linlin Hu , Xueli Zhang , Hua Shao , Fulun Li , Yanfei Shen

Invasive candidiasis (IC) is a serious clinical disease that typically occurs in patients at high risk of infection [1,2]. Candida albicans (C. albicans) is the most common pathogen (accounting for about 45% [3]) in IC. fluconazole (Diflucan), as a first-line clinical drug has been used for the treatment of invasive C. albicans for decades [4]. However, the severe resistance caused by the long-term use of antifungals leads to the failure of antifungal treatment, resulting in a high mortality [5]. Given the urging clinical needs for mitigating antifungal resistance, deepening the understanding of resistance mechanisms can assist clinicians in proposing new precise regimens to defend resistant microbes. Traditional researches about antifungal resistance mechanisms are mainly focused on transcription level [6,7], which barely promotes the development of new antifungals (the delayed development cycle of antifungals also fails to respond in a timely manner to the increasing antifungal resistance) or clinical regimens. Metabolic rewiring, has been found as a primitive role in cellular function and is therefore commonly associated with different antimicrobial resistance mechanisms [8-10]. Inspired by this, the association between metabolic rewiring and antifungal resistance might be the breakpoint to propose new antifungal regimens. Metabolomics, as a versatile approach, has been applied for revealing the changes in metabolites during the metabolism and mass spectrometry (MS) and nuclear magnetic resonance (NMR) are classical techniques [11,12]. However, these methods have limitations such as high cost, complex sample preparation, false-positive, and database-dependency.
Surface-enhanced Raman spectroscopy (SERS) has the advantages such as rapidity, low cost, simplicity, non-destructiveness, and high specificity, which might be a good choice and has been widely applied in biomedical fields [13-15]. While conventional label-free SERS offers a promising technique for studying antifungal resistance, it faces challenges such as low sensitivity and reproducibility. Additionally, the laser irradiation used in conventional SERS can damage biological samples like fungal cells, potentially compromising data accuracy. Our research could potentially benefit from utilizing dynamic SERS (D-SERS). This technique, pioneered by Yang's group [16-18], offers a simpler approach by continuously acquiring spectra during evaporation process, eliminating the need for complex substrate design. The formation of a 3D hotspot matrix, which traps analytes in a trapping well (T-well) during continuous acquisition, could finally acquire a significant signal enhancement according to the classical electromagnetic enhancement theory. This could account for a superior sensitivity and reproducibility compared to conventional SERS (C-SERS). Additionally, the solvent protection inherent to D-SERS makes it particularly well-suited for studies involving biological systems, minimizing laser-induced damage. Besides, faced with the complexity of biological system, it is not enough to simply enhance detecting sensitivity. In order to understand the specific metabolic changes of C. albicans during resistance, precise identification and screening of metabolic biomarkers are crucial. Compared to the naked eye observation of 1D SERS, advanced data processing methods such as 2nd derivative and machine learning (ML) algorithms are feasible. The second derivative could enhance spectral resolution to find more information and ML is capable of further screening key metabolites through reducing data dimensions. Furthermore, next step is to understand the dynamic changes in these screened metabolites during antifungal resistance. A versatile technique called two-dimensional correlation spectroscopy (2DCOS) is proposed. 2DCOS, could sensitively capture internal changes (especially change orders for different components) in complex systems under various perturbations [19,20]. Therefore, in order to fully understand the antifungal resistance mechanism of C. albicans, we will combine the above three methods to carry out relevant research. This integrated methodology is facile, sensitive, precise, and dynamic, which is promising to find adjuvants from metabolic profiling instead of developing new antifungals and contributes to the timely clinical therapy against antifungal resistance.
Fluconazole-resistant C. albicans (FRCA) and fluconazole-sensitive C. albicans (FSCA) are chosen in this work. And the antifungal susceptible testing (AFST) results were shown in Table S1 in Supporting information (according to Clinical & Laboratory Standards Institute (CLSI), minimum inhibition concentration (MIC) ≤ 2 µg/mL are defined as sensitive to azoles and MIC ≥ 8 µg/mL are defined as resistant to azoles). And then D-SERS analysis was performed for the characterization of FRCA and FSCA (Fig. S1 in Supporting information). It should be noted that in our previous study [21,22], the D-SERS methodology used for detecting C. albicans was substantially developed and validated, and highly sensitive and reproducible spectra could be obtained, which is not discussed in this work. Here, the average main SERS peaks with varied intensity between two phenotypes occurred at 572, 655, 722, 794, 869, 956, 1126, 1242, 1319, 1353, and 1455 cm-1 (Fig. 1). Besides, since the complexity of the SERS spectra of fungal cells can obscure key spectral features of metabolites readily apparent in 1D SERS, we employed 2nd derivative spectra spectroscopy to enhance the spectral resolution of some bands and improve signal discrimination. This technique allows us to uncover previously hidden minor peaks, which effectively increases spectral resolution and reveals more valuable information about the underlying metabolites. Thus, by aid of 2nd derivative processing, several invisible features including peaks at 626, 699, 742, 997, 1092, 1216, 1385, 1428, 1543, and 1573 cm-1 were distinctly resolved (red mark) as shown in Fig. 1.
Regarding various experimental conditions in different laboratories, SERS spectra of model compounds were collected under our laboratory conditions. According to Premasiri's work [23], model compounds including adenine (A), hypoxanthine (HAT), xanthine (Xan), guanine (G), adenosine monophosphate (AMP), guanosine (Guo), and adenosine (Ado) may dominate the main SERS bands of common bacteria. In addition, other related literatures [24-31] also indicate the SERS bands of bacteria are deviating from amino acids, lipids, and several model compounds such as phenylalanine (Phe), tyrosine (Tyr), tryptophan (Trp), phosphatidylcholine (PC), and phosphatidylinositol (PI) which have larger Raman scattering sections. Besides, ergosterol (Erg), as the key component consisting of fungal cellular membrane is also included. In summary, all the resolved peaks appearing in both FRCA and FSCA could be putatively assigned, as shown in Fig. S2 and Table S2 (Supporting information).
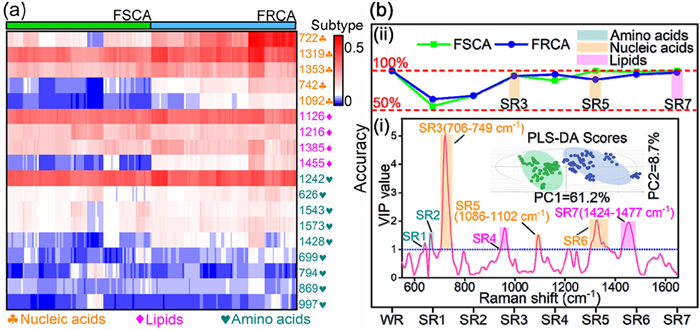
Subsequently, a rough comparison in metabolic profiling between two phenotypes was performed over heatmap analysis shown in Fig. 2a. Although color differences representing components are visible, simply comparison and naked-eye identification is difficult to substantially profile the metabolic behavior. Fortunately, as a common ML algorithm, partial least square-linear discriminant (PLS-DA) is capable of processing multi-variable data, reducing dimension and exploring the data feature, was used to distinguish between the two phenotypes. And the corresponding score plot for FRCA and FSCA is shown in Fig. 2b(ⅰ) insert. It could be found that both groups representing two phenotypes separates remarkably as a high total PCs (PC1 + PC2 = 69.9%) indicating the obvious classification between them. Meanwhile, several common parameters including R2Y (interpretability), Q2 (predictive quality), and root mean square error of cross-validation (RMSECV) are used to evaluate the classification model. As observed in Fig. S3a (Supporting information), with an increase in latent variables, R2Y exhibited an upward trend, indicating that the interpretability of the model is high. Meanwhile, Q2 initially increases and then decreases with more latent variables, whereas RMSECV exhibits the opposite behavior. The turning points of the latent variables represent the peak predictive capability of the constructed classification model. Moreover, extra permutation test further demonstrates the avoidance of overfitting in the established classification model as all Q2 values were < 0 and lower than R2 (Fig. S3b in Supporting information). Therefore, this classification model is reasonably robust to distinguish between FRCA and FSCA. Then, after optimizing the latent variables, the accuracy of this classification model required further evaluation for the diagnosis of new samples, particularly for the diagnosis of antifungal-resistant phenotypes. Subsequently, utilizing variable importance in projection (VIP), an effective method that identifies differential metabolites between two phenotypes where variables with VIP > 1 are considered important discriminators between two groups and the results are shown in Fig. 2b(ⅰ). Several specific ranges (SR) are thus discerned including SR1 (635–647 cm-1), SR2 (660–672 cm-1), SR3 (706–749 cm-1), SR4 (942–971 cm-1), SR5 (1086–1102 cm-1), SR6 (1300–1376 cm-1), and SR7 (1424–1477 cm-1). After calculating classification accuracy for the above ranges, SR3, SR5, and SR7 (Fig. 2b(ⅱ)) reveal excellent accuracy (> 95%) to distinguish between two phenotypes indicating nucleic acid and lipid are the key differential metabolites which also implies that PLS-DA has the advantage of further lowering the scope in metabolic differences between two phenotypes and more importantly, D-SERS combined with ML algorithms could accurately (> 95%) and rapidly (~20 min per sample including centrifugation of fresh culture (3 min), washing three times by PBS (9 min) and mixing Ag NPs solution with washed cultures (5 min) as to collect D-SERS spectra (3 min)) identifies FRCA strains. Apart from the gold standard-culture methods (a timeframe consuming 24–48 h), even if compared with other emerging methodologies for AFST (Table S3 in Supporting information), our D-SERS method displays more superiorities, including its shortened turnaround time (TAT) of approximately 0.3 h, high sensitivity, low cost, and ease of operation. These features make D-SERS a promising tool for rapid AFST.
Moreover, the detailed subtypes of nucleic acids and lipids are needed to be further validated by more rigid criteria (Fold change (FC) and P-value). According to the cut-off value including FC, (FC > 2 or FC < 0.5 or Log2(FC) > 1 or Log2(FC) < −1), and P-value (P < 0.05), three variables including 722, 1092 and 1455 cm-1 were screened (Fig. S4a in Supporting information). Combined with the corresponding biochemical origins, FRCA have higher content of A/Ado/AMP (722 cm-1), HAT (1092 cm-1) and Erg (1455 cm-1) than those in FSCA (Figs. S4b-d in Supporting information). It was worth noting that, according to the result, Erg as a biomarker indicating antifungal resistance [32], upregulates among FRCA compared with sensitive pairs which infers the reliability and superiority by using D-SERS to identify antifungal resistance.
Furthermore, apart from Erg, other metabolites such as HAT, A/Ado/AMP also upregulate in resistant microbes. However, the causality between Erg and these metabolites is unclear, and the detailed cellular regulation might be beneficial for deepening understanding of antifungal resistance mechanism. That is, it is to be clarified whether these metabolites could induce the changes of Erg or Erg induces the changes of those metabolites. Here, 2DCOS was introduced to address this issue. As an advanced mathematics technique, 2DCOS could reveal internal changes in various complex systems under various perturbations by interpreting synchronous and asynchronous spectra simultaneously. However, simply two spectra representing FRCA and FSCA are not enough to conduct this analysis. Given that FRCA vary according to resistance levels from MIC = 8 µg/mL to 64 µg/mL, FRCA are thus divided into three parts, regarded as Low-FRCA (LFRCA, MIC = 8 µg/mL), Medium-FRCA (MFRCA MIC = 16 µg/mL), and High-FRCA (HFRCA MIC = 64 µg/mL), which could meet the requirements of calculating 2DCOS. It was worth noting that this process also has another advantage. In clinical practice, the degree of resistance to a specific antimicrobial drug is closely associated with precise medication use. Through establishing the correlation between resistant biomarker (Erg) and resistant level (MIC value), a more precise medication could be proposed avoiding the cost of adverse effects or medical resources.
After involving the average SERS spectra of L/M/H-FRCA (Fig. S5 in Supporting information), 2DCOS analysis was conducted in which MIC is as the perturbation and the results were shown in Figs. S6a and b (Supporting information). Faced with the complicated patterns, not all the components are our interests. Come back to the differential metabolites mentioned above, these components are crucial for the explanation of antifungal resistance mechanisms. However, after dividing the original FRCA into three parts, differential metabolites between them and FSCA are needed to be rescreened, respectively. Likewise, the corresponding VIP values (Fig. S7 in Supporting information) between three FRCA subtypes and FSCA were recalculated and new differential metabolites were screened according to FC and P-value (Figs. 3a-c). It could be expected that new screened metabolites are still A/Ado/AMP (722 cm-1), HAT (1092 cm-1), and Erg (1455 cm-1).
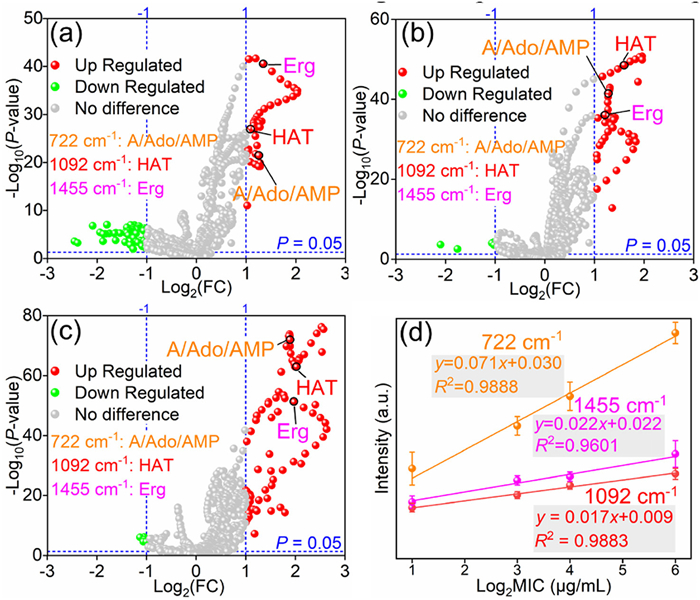
Before conducting 2DCOS analysis at specific ranges, it is necessary to find more antifungal resistant biomarkers and ensure these biomarkers and resistant levels as was mentioned above. Thus, the correlation between the screened metabolites and MIC were conducted as shown in Fig. 3d. After linear fitting, high R2 could be achieved for three peaks (722, 1092, and 1455 cm-1) which are 0.9888, 0.9883, and 0.9601, respectively indicating besides Erg, these metabolites including A/Ado/AMP, and HAT could be regarded as the promising resistant biomarkers. To strengthen our findings, future studies will incorporate additional data points to definitively confirm linearity and explore potential underlying mechanism influencing the observed correlation.
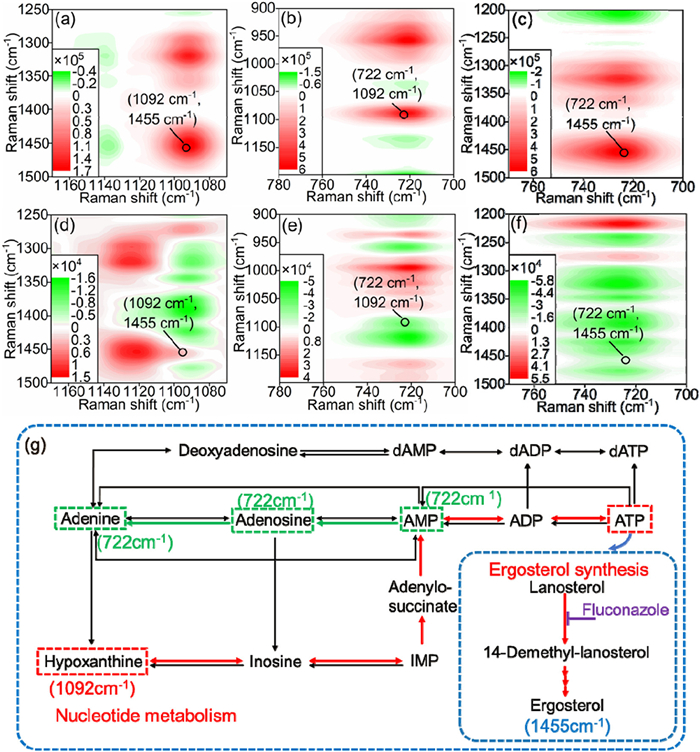
Subsequently, according to the above selected metabolites, correlation spectra in the specific range were obtained, as shown in Figs. 4a-f. According to the Noda's rule [19], whatever φ (υ1, υ2) or ψ (υ1, υ2) > or < 0, if φ (υ1, υ2) × ψ (υ1, υ2) > 0, υ1 is ahead of υ2 and vice versa, υ1 is behind of υ2. Therefore, after carefully checking the contour intensity of three maps, the change order was as follows: 1092 cm-1 (HAT) → 1455 cm-1 (Erg) → 722 cm-1 (A/Ado/AMP). The results indicates that, with the increase of resistant levels, HAT changes before Erg. That is, HAT induces the antifungal resistance and then A/Ado/AMP are thus induced by Erg or HAT. In order to further clarify this regulation, Kyoto Encyclopedia of Genes and Genomes (KEGG) was used. According to the nucleotide metabolism pathway (referring to
This work introduced a versatile methodology to identify the resistance of clinical isolates C. albicans accurately and rapidly, and first reveal an underlying fluconazole (Diflucan)-resistance mechanism. In short, by means of D-SERS and PLS-DA, FRCA and FSCA, could be classified with an accuracy of exceeding 95% and a time cost of ~20 min per sample, which is promising for the rapid AFST. Furthermore, based on the MICs as the perturbation way, the putative fluconazole (Diflucan) resistance mechanism could be reasonably clarified by means of 2DCOS, which could be delineated as metabolic rewiring facilitating the production of HAT and subsequently synthesizing ATP used for the synthesis of extra Erg while maintaining the integrity of the cellular membrane. And we emphasize that the synergistic amalgamation of diverse methodologies effectively overcomes the limitations inherent to individual approaches, progressively elucidating the intricate metabolic patterns that emerge during the antifungal resistance development in C. albicans, which paves the way for a novel paradigm in the investigation of antifungal resistance mechanisms. In addition, purine metabolites mediated mechanism to regulate fungal resistance discovered in this work is also beneficial to apply purine inhibitors as adjuvants to exert synergistic effect with traditional antifungals upon validated by molecular biology methods, which is rather ahead of developing new antifungals and contributes to a timely clinical therapy.
The authors declare that they have no known competing financial interests or personal relationships that could have appeared to influence the work reported in this paper.
Hao Li: Writing – review & editing, Writing – original draft, Methodology, Investigation, Formal analysis, Data curation, Conceptualization. Hanzhi Lu: Writing – review & editing, Formal analysis. Linlin Hu: Writing – review & editing, Formal analysis. Xueli Zhang: Writing – review & editing, Formal analysis. Hua Shao: Writing – review & editing, Validation, Formal analysis. Fulun Li: Writing – review & editing, Validation, Formal analysis. Yanfei Shen: Writing – review & editing, Validation, Supervision, Funding acquisition, Formal analysis.
This work was supported by grants from the National Natural Science Foundation of China (Nos. 22074015 and 82074428), Youth Talent Cultivation Initiation Fund of Zhongda Hospital, Southeast University (No. CZXM-GSP-RC110) to Hao Li, Evidence-Based Capacity Building for TCM Specialty Therapies for Skin Diseases of National Administration of TCM, and Innovative Team Projects of Shanghai Municipal Commission of Health (No. 2022CX011) to Fulun Li.
Supplementary material associated with this article can be found, in the online version, at doi:
P.G. Pappas, M.S. Lionakis, M.C. Arendrup, et al., Nat. Rev. Dis. Primers 4 (2018) 18026.
A. Soriano, P.M. Honore, P. Puerta-Alcalde, et al., J. Antimicrob. Chemoth. 78 (2023) 1569–1585. doi: 10.1093/jac/dkad139
T.P. McCarty, C.M. White, P.G. Pappas, et al., Infect. Dis. Clin. N. Am. 35 (2021) 389–413.
C. Hu, Z. Xu, Z. Huang, et al., ACS Med. Chem. Lett. 14 (2023) 1448–1454. doi: 10.1021/acsmedchemlett.3c00361
A. Oliva, F.G. De Rosa, M. Mikulska, et al., Expert Rev. Anti-Infect. Ther. 21 (2023) 957–975. doi: 10.1080/14787210.2023.2240956
M. Handelman, N. Osherov, Front. Fungal Biol. 3 (2022) 957577.
Y. Feng, H. Lu, M. Whiteway, et al., J. Global Antimicrob. Resist. 35 (2023) 314–321.
X. Li, D. Feng, J. Zhou, et al., ACS Infect. Dis. 10 (2024) 184–195. doi: 10.1021/acsinfecdis.3c00480
M. Jiang, X. Li, C.L. Xie, et al., Int. J. Antimicrob. Agents 62 (2023) 106907.
X.L. Zhao, Z.G. Chen, T.C. Yang, et al., Sci. Transl. Med. 13 (2021) eabj0716.
A. Curtoni, D. Ghibaudo, C. Veglio, et al., J. Med. Microbiol. 72 (2023) 001638.
I. Sy, N. Bühler, S.L. Becker, et al., J. Clin. Microbiol. 61 (2023) e0056923.
C. Qiu, Z. Cheng, C. Lv, et al., Chin. Chem. Lett. 32 (2021) 2369–2379.
B. Tian, Y. Fang, S. Lei, et al., Chin. Chem. Lett. 34 (2023) 108144.
G. Wu, W. Li, W. Du, et al., Chin. Chem. Lett. 33 (2022) 519–522.
H. Liu, Z. Yang, L. Meng, et al., J. Am. Chem. Soc. 136 (2014) 5332–5341. doi: 10.1021/ja501951v
K. Qian, L. Yang, Z. Li, et al., J. Raman Spectrosc. 44 (2013) 21–28. doi: 10.1002/jrs.4137
L. Yang, P. Li, H. Liu, et al., Chem. Soc. Rev. 44 (2015) 2837–2848.
P. Lasch, I. Noda, Appl. Spectrosc. 73 (2019) 359–379. doi: 10.1177/0003702818819880
Y. Park, S. Jin, I. Noda, et al., Spectrochim. Acta A 284 (2023) 121636.
H. Li, L. Wang, Y. Chai, et al., Nanotoxicology 12 (2018) 1230–1240. doi: 10.1080/17435390.2018.1540729
H. Li, Y. Cao, F. Lu, J. Innov. Opt. Heal. Sci. 14 (2021) 2141002.
W.R. Premasiri, J.C. Lee, A. Sauer-Budge, et al., Anal. Bioanal. Chem. 408 (2016) 4631–4647. doi: 10.1007/s00216-016-9540-x
E. Akanny, A. Bonhommé, F. Bessueille, et al., Appl. Spectrosc. Rev. 56 (2021) 380–422. doi: 10.1080/05704928.2020.1796698
G. Cutshaw, N. Hassan, S. Uthaman, et al., Anal. Chem. 95 (2023) 13172–13184. doi: 10.1021/acs.analchem.3c02073
C. Krafft, L. Neudert, T. Simat, et al., Spectrochim. Acta A 61 (2005) 1529–1535.
I. Sayin, M. Kahraman, F. Sahin, et al., Appl. Spectrosc. 63 (2009) 1276–1282. doi: 10.1366/000370209789806849
D. Drescher, T. Büchner, D. McNaughton, et al., Phys. Chem. Chem. Phys. 15 (2013) 5364–5373. doi: 10.1039/c3cp43883j
B. Hernández, F. Pflüger, A. Adenier, et al., J. Phys. Chem. B 114 (2010) 15319–15330. doi: 10.1021/jp106786j
G.P. Szekeres, J. Kneipp, Front. Chem. 7 (2019) 30.
B. Fazio, C. D'Andrea, A. Foti, et al., Sci. Rep. 6 (2016) 26952.
L.G. Chivukula, D. Lajeunesse, ACS Biomater. Sci. Eng. 9 (2023) 6724–6733. doi: 10.1021/acsbiomaterials.3c00938

Figure 2 (a) SERS-based heatmap of FRCA and FSCA which gives the landscape of biochemical components, (b) PLS-DA scores, and VIP (ⅰ) and accuracy calculation (ⅱ) under the comparison of these two phenotypes.

Figure 3 The volcano plots of metabolites for FRCA (MIC = 2 µg/mL) vs. (a) LFRCA (MIC = 8 µg/mL), (b) MFRCA (MIC = 16 µg/mL), and (c) HFRCA (MIC = 64 µg/mL) based on fold change FC and P-value. And red and green circles represent the variables which meets the criteria Log2(FC) > 1 (red) / Log2(FC) < −1 (green) and P < 0.05, respectively. (d) The correlation between different MICs of FSCA, LFRCA, MFRCA, and HFRCA and their corresponding SERS intensities in three peaks including 722, 1092, and 1455 cm-1 screened according to the volcano plots.

Figure 4 Synchronous and asynchronous spectra analysis in different spectral ranges are as follows: (a) Synchronous spectra and (d) asynchronous spectra between 1070 and 1170 cm-1 and 1250–1500 cm-1, (b) synchronous spectra and (e) asynchronous spectra between 700 and 780 cm-1 and 900–1200 cm-1, and (c) synchronous spectra and (f) asynchronous spectra between 700 and 770 cm-1 and 1200–1500 cm-1. (g) Associated schematic pathways of nucleotide metabolism and Erg synthesis which combined with detailed 2DCOS analysis according to the screened metabolites including 722, 1092, and 1455 cm-1could be applied to deduce the antifungal resistance mechanism.

 扫一扫看文章

扫一扫关注我们
 DownLoad:

 下载:
下载:
 下载:
下载: