College of Chemistry and Chemical Engineering, Chongqing University of Technology, Chongqing 400054, China
b.
Institute of smart city and intelligent transportation, Southwest Jiaotong University, Chengdu 611756, China
c.
State Key Laboratory of Physical Chemistry of Solid Surfaces, Collaborative Innovation Center of Chemistry for Energy Materials, and Department of Chemistry, College of Chemistry and Chemical Engineering, Xiamen University, Xiamen 361005, China
Received Date:
19 June 2024 Accepted Date:
30 July 2024 Revised Date:
12 July 2024 Available Online:
15 September 2025
Abstract:
Lithium-ion capacitors (LICs) hold promise as next-generation energy storage devices due to the synergy of the advantageous features of lithium-ion batteries (LIBs) and supercapacitors (SCs). Recently, the use of nanostructured conjugated carboxylate organic anode materials in LICs has attracted tremendous attention due to their high capacity, excellent capacitive behavior, design flexibility, and environmental friendliness. Nevertheless, no studies have reported the use of non-conjugated organic compounds in LICs. In this study, we report for the first time that non-conjugated adipamide (ADIPAM) nanocrystals fabricated using a dissolution-recrystallization self-assembly technique serve as an excellent anode material for LICs. The unique ADIPAM nanocrystals–PVDF–Super P conductive integrated network architecture accelerates Li+ ion and electron diffusion and enhances lithium storage capability. Consequently, ADIPAM electrodes exhibit a high capacity of 705.8 mAh/g, exceptional cycling stability (308 mAh/g after 2100 cycles at 5 A/g), and remarkable rate capability. Furthermore, a LIC full cell comprising the ADIPAM anode with a porous activated carbon cathode demonstrates a wide working window (4.5 V), high energy density (238.3 Wh/kg), and superb power density (22,500 W/kg). We believe this work may introduce a new approach to the design of non-conjugated organic materials for LICs.
Lithium-ion capacitors (LICs), which are a bridge between lithium-ion batteries (LIBs) and supercapacitors (SCs), have emerged as extremely promising energy storage candidates for next-generation portable electronics and electric vehicles due to their remarkable energy density and power density [1–5]. It is well understood that electrode active materials are a key factor in establishing high-performance LICs, and that inorganic anodes for LICs have been a topic of intense research efforts for several decades [6–9]. Although Nb2O5 [10,11], LiV3O4 [12–14], Cu5FeS4-x [15], MnO [16], and carbon-based materials [17–21] have been shown to be successful in LICs, designing LIC anode materials that are capable of meeting stringent criteria for high energy densities, exceptional rate capability, and low carbon emissions has remained a challenge. Therefore, considerable efforts have been devoted to developing an ideal candidate anode material.
Particularly, organic small molecule anodes have recently gained significant attention due to their high capacity, remarkable pseudocapacitive behavior, excellent structural designability, and low environmental footprint [22–24]. Theoretically, employing organic small molecule materials as anode candidates should be a promising, intriguing approach to developing advanced LICs. However, owing to their high solubility, poor electrical conductivity, and limited Coulombic efficiency (CE) [25,26], there have been few reports of the use of organic small molecules in LICs thus far. Recently, our group reported an innovative dissolution-recrystallization self-assembly approach to constructing a profoundly conductive network structure. This strategy offers substantial mitigation of dissolution and remarkably enhances the electrical conductivity of organic small carbonyl compounds such as maleic acid (MA), 2,2′-bipyridine-4,4′-dicarboxylic acid (BPDCA), and cyclohexanehexanone (C6O6) [27–29]. Consequently, the LICs based on these anodes display excellent energy and power densities that are comparable to those of conventional inorganic anode materials. Specifically, BPDCA-based LICs demonstrate maximum energy and power densities of 178.7 Wh/kg and 20,430 W/kg, respectively. Their outstanding electrochemical performance motivates us to pursue the development of organic compounds for LICs. Notably, these small carbonyl molecules are predominantly classical conjugated aromatic or conjugated quinone compounds that exhibit uncontrolled voltage due to non-quantitative delocalization [30,31]. Wang et al. were the first to observe hydrogen transfer-mediated orbital conversion from antibonding π*- to σ-bonding through the double bond reformation, which could effectively prevent electron stabilization [30]. Furthermore, non-conjugated molecules show a greater steric hindrance than conjugated compounds and are able to avoid radical coupling effects [32]. Thus, the non-conjugated dicarboxylate compounds (1,4-cyclohexanedicarboxylic acid, C8H12O4, CHDA) delivers a high capacity of 284 mAh/g and excellent rate capability. Broadly speaking, this work represents a breakthrough in overcoming the limitations inherent in traditional conjugated organic materials. However, up-to-date, non-conjugated organic compounds have only been investigated and reported for metal-ion batteries. Considering this, we were interested in extending the scope of organic anode materials for conjugated carbonyl compounds to non-conjugated organic compounds in high-performance LICs for the first time.
In this work, we used a non-conjugated organic molecule (adipamide, named ADIPAM) as an anode material for an LIC. Interestingly, the ADIPAM nanocrystals (5–10 nm) were tightly integrated into the PVDF matrix with the use of our previous dissolution-recrystallization self-assembly strategy to generate ADIPAM@PVDF granules, and these granules were embedded in Super P to form a highly conductive ADIPAM nanocrystals–PVDF–Super P network architecture (Fig. 1a). Notably, the nanosized network architecture promotes the transmission and migration of Li+ ions and electrons in the ADIPAM materials and hinders the dissolution of the ADIPAM molecules, thereby ensuring the superior Li+ ions storage of the ADIPAM electrodes. Accordingly, the ADIPAM electrodes exhibited a high capacity (705.8 mAh/g at 100 mA/g), outstanding long-term cyclability (91.2% capacity retention after 2100 cycles), and impressive rate capability. ADIPAM compounds were further explored as a new anode material for LICs. Most importantly, the as-constructed ADIPAM||activated carbon (AC) LICs offered a wide working window of 4.5 V, and achieved a prominent energy density of 238.3 Wh/kg and a high-power density of 22,500 W/kg. Using non-conjugated ADIPAM materials expands the repertoire of organic anode materials for LICs and provides new insights for the advancement of LICs.
Figure 1
Figure 1.
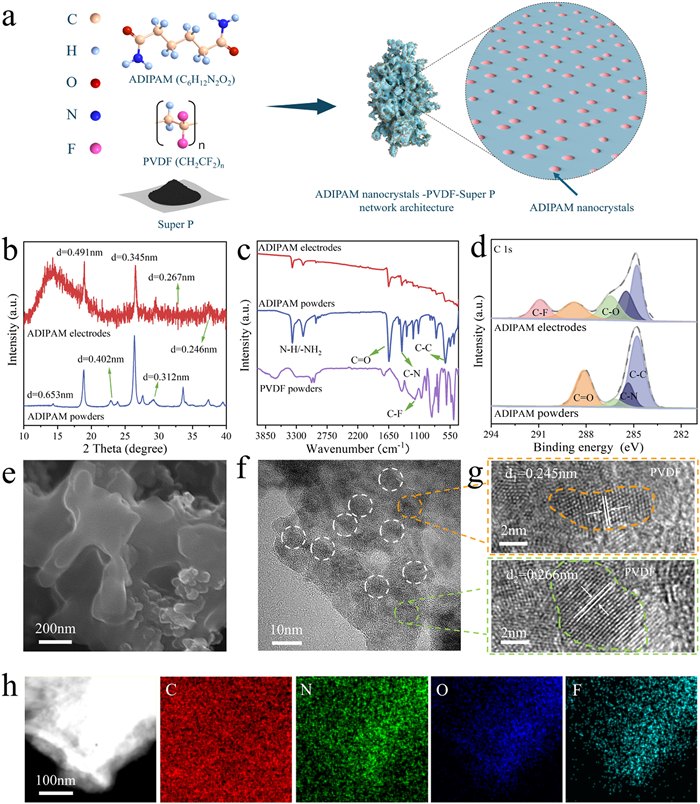
(a) Schematic diagram of the synthetic procedure of the ADIPAM nanocrystals-PVDF-Super P network architecture. (b) XRD patterns of ADIPAM powders and ADIPAM electrodes. (c) FTIR spectra of PVDF powders, ADIPAM powders, and ADIPAM electrodes. (d) High-resolution XPS spectra of C 1s for ADIPAM powders and ADIPAM electrodes. (e) SEM images and (f) TEM images of ADIPAM electrodes. (g) HRTEM images of ADIPAM electrodes. (h) EDS mapping images of ADIPAM electrodes (C, red; N, green; O, blue; F, cyan).
The as-purchased ADIPAM powders were first investigated by thermogravimetric (TG) analysis to ensure their thermal stability. As shown in Fig. S1 (Supporting Information), the ADIPAM powders showed minimal weight loss up to 240 ℃, revealing their excellent thermal stability and suitability as anode materials for LIBs and LICs. Subsequently, ADIPAM electrodes were prepared according to our previous self-assembly strategy [27–29], which involved mixing ADIPAM powders with Super P and PVDF powders in NMP solvent. To investigate the structure and chemical stability of ADIPAM powders during the self-assembly process, X-ray diffraction (XRD) and Fourier transform infrared (FTIR) measurements were captured. Fig. 1b shows the XRD patterns of the ADIPAM powders, PVDF powders, and ADIPAM electrodes. The ADIPAM powders present distinct diffraction peaks at 14.4°, 18.8°, 22.8°, 26.3°, 29.3°, 33.5°, and 37.4° that correspond to interplanar lattice spacing’s of 6.53, 4.91, 4.02, 3.45, 3.12, 2.67, and 2.46 Å, respectively. Specifically, the broad crystal spacing would significantly promote Li+ ions diffusion and accommodate a large amount of Li+ ions within the ADIPAM materials [33,34]. Notably, the diffraction pattern of the ADIPAM electrodes closely resembles that the ADIPAM powders, which indicates the absence of chemical interaction between the ADIPAM powders and PVDF or Super P during the dissolution-recrystallization process, as was found by our previous reports [27–29]. The FTIR spectrum further supports this result. As Fig. 1c demonstrates, the ADIPAM powders display FTIR characteristic peaks at 3375.4/3178.6, 1647.2, 1415.9, and 632.6 cm−1, which were assigned to the chemical bonds of N-H/-NH2, -C=O, -C-N, and -C-C, respectively [35–37]. Additionally, the FTIR spectrum of the PVDF powders displays a characteristic peak at 1180.3 cm−1 corresponding to the -C-F bond. Obviously, the FTIR spectra of the ADIPAM electrodes not only show the typical peaks of ADIPAM but also those of PVDF, which demonstrates the only physical interaction between ADIPAM and PVDF.
The compatibility and chemical compositions of ADIPAM with PVDF were further characterized by X-ray photoelectron spectroscopy (XPS) measurements. Notably, the C, O, N, and F signals were present in the XPS survey spectrum of the ADIPAM electrodes (Fig. S2 in Supporting information). As shown in Fig. 1d, the high-resolution C 1s spectrum of the ADIPAM powders display four peaks at 284.8, 285.4, 286.6, and 288.7 eV, which could be ascribed to the -C-C, -C-N, -C-O, and -C=O bonds, respectively. The appearance of the -C-O peak could be attributed to adsorbed oxygen. It is apparent that the -C-C, -C-N, -C-O, and -C=O bonds remain almost unchanged after the dissolution-recrystallization process, whereas a new characteristic peak of -C-F band that belongs to the PVDF emerges, which indicates that there was no significant interaction between the ADIPAM powders and the PVDF powders. The O 1s spectrum of the ADIPAM electrodes is deconvoluted into two peaks corresponding to -C=O (531.5 eV) and -C-O (532.9 eV) (Fig. S3a in Supporting information), which match well with those of the ADIPAM powders. Our analysis of the N 1s XPS spectra (Fig. S3b in Supporting information) further confirms the stability of the ADIPAM powders during the electrode preparation process, where peaks identify the existence of -C-N (401.0 eV) and -NH2 (399.6 eV) bonds in both the ADIPAM powders and the ADIPAM electrodes [36,38]. Notably, the C 1s, O 1s, and N 1s spectra of the ADIPAM electrodes exhibit significant redshifts relative to the ADIPAM powders, and these are attributed to the encapsulation of the ADIPAM nanocrystals by PVDF, which is consistent with our previously reported results [27]. To investigate the positive impact of the dissolution-recrystallization strategy on hindering the dissolution of ADIPAM molecules, dissolution experiments and 1H nuclear magnetic resonance (NMR) measurements were conducted. As shown in Fig. S4 (Supporting information), the color of the electrolytes remains nearly unchanged, whereas the ADIPAM powders are completely dissolved after 2 days. Moreover, the 1H NMR spectrum of the electrolytes after they were soaked in ADIPAM powders for 2 days shows characteristic resonances for ADIPAM (Fig. S5 in Supporting information), whereas the 1H NMR spectrum after soaking ADIPAM electrodes did not display any ADIPAM molecule signals. These results suggest that ADIPAM electrodes possess excellent chemical stability in electrolytes.
Scanning electron microscopy (SEM) images of the ADIPAM powders and ADIPAM electrodes were further captured to gain insight into their self-assembly strategy. As shown in Fig. S6 (Supporting information), the ADIPAM powders exhibit an irregular granules structure with a size of approximately 3–12 µm in diameter. Notably, the dissolution-recrystallization process downsized the ADIPAM to nanoparticles (Fig. 1e and Fig. S7 in Supporting information). The ADIPAM nanoparticles in the ADIPAM electrodes are remarkably tightly interconnected within the Super P conductive matrix to form a highly integrated ADIPAM–PVDF–Super P network architecture. Interestingly, the transmission electron microscope (TEM) images reveal that the ADIPAM nanoparticles comprise numerous tiny and highly dispersed ADIPAM nanocrystals encapsulated within the PVDF polymeric network and having a diameter of 5–10 nm (Fig. 1f and Fig. S8 in Supporting information). In addition, distinct lattice fringes that correspond closely to the interplanar spacings of 2.45 and 2.66 Å can be observed in the high-resolution TEM images (Fig. 1g and Fig. S9 in Supporting information), consistent with the XRD patterns. Moreover, energy-dispersive spectroscopy (EDS) mapping images (Fig. 1h) show that C, N, O, and F elements uniformly distributed within the ADIPAM–PVDF–Super P network. Owing to the advantageous conductive ADIPAM–PVDF–Super P network structure and the unique ADIPAM nanocrystal structure, the diffusion of Li+ ions and electrons within the ADIPAM electrodes should be significantly improved. Simultaneously, the presence of the PVDF network would serve to suppress the dissolution of the ADIPAM molecules.
To demonstrate the storage of Li+ ions by ADIPAM compounds, the cyclic voltammogram (CV) and galvanostatic charge-discharge (GCD) measurements of pure ADIPAM electrodes without Super P were first carried out. Fig. 2a shows that three weak cathodic peaks (1.61, 1.26, and 0.68 V) and three anodic peaks (1.02, 1.90, and 2.33 V) can be observed, which indicate the occurrence of three lithiation and delithiation processes by ADIPAM. This observation confirms that ADIPAM molecules can be used as anode materials for LIBs. Meanwhile, the redox peaks exhibit a slight offset during cycling, which suggests the pure ADIPAM electrodes have excellent reversibility and stability. Additionally, the GCD profiles show three pairs of reversible discharge and charge plateaus (Fig. S10 in Supporting information), which coincide with the CV results. Notably, the pure ADIPAM electrodes deliver an initial discharge and charge capacity of 613.5 and 113.7 mAh/g, respectively, at the ultralow current density of 5 mA/g, respectively, corresponding to an 18.5% CE. The great capacity loss may have stemmed from the formation of a solid-state electrolyte interface (SEI) layer or the dissolution and shuttle behavior of ADIPAM in electrolytes [39–41]. The electrochemical activity of pure ADIPAM electrodes was further confirmed through cycling stability and rate capability measurements. As illustrated in Fig. S11 (Supporting information), the pure ADIPAM electrodes display a limited reversible capacity (57.3 mAh/g) and stable cycling performance after 400 cycles at 1 A/g. Moreover, the pure ADIPAM electrodes exhibit and excellent rate capability and achieve capacities of 67.4, 57.7, 40.1, 29.9, 23.3, 20.8, and 16.8 mAh/g at 0.1, 0.2, 0.5, 1, 2, 5, and 10 A/g, respectively (Fig. S12 in Supporting information). Nonetheless, the weak redox peaks and limited capacity in the pure ADIPAM electrodes might have been due to the poor electronic conductivity and high solubility of ADIPAM. To maximize storage of the Li+ ions by ADIPAM materials, optimized ADIPAM electrodes were prepared by introducing Super P. CV and GCD analysis were then carried out. Fig. 2b shows the typical CV curves of the optimized ADIPAM electrodes within a voltage window of 0.01–3.0 V at a scan rate of 0.1 mV/s. During the initial cathodic process, three reduction peaks can be observed at 0.64, 1.44, and 1.72 V. Notably, the broad and pronounced reduction peak at 1.44 V disappears in the subsequent cycling, which corresponds to electrolyte decomposition and SEI layer formation. During the initial anodic process, three obvious oxidation peaks at 0.97, 1.88, and 2.34 V can be observed. After the first cycle, three pairs of redox peaks at 0.98/0.64, 1.89/1.23, and 2.35/1.65 V are clearly retained, and these are consistent with the CV results for the pure ADIPAM electrodes, which further demonstrates that the ADIPAM electrodes undergo a three-step, stable and reversible lithiation and delithiation process. The typical GCD profiles for the ADIPAM electrodes at 5 mA/g are shown in Fig. S13 (Supporting information). At the initial lithiation, the ADIPAM electrodes show one weak and narrow plateau at approximately 1.94–2.51 V, accompanied by a prolonged plateau at approximately 1.64 and 0.75 V. Subsequently, three inapparent lithiation and de-lithiation plateaus are observed, which signify excellent capacitive behaviors that are in agreement with the corresponding CV curves. After the introduction of Super P, the ADIPAM electrodes deliver a higher initial discharge capacity of 1966.4 mAh/g, which is significantly better than that of the pure ADIPAM electrodes. Due to the SEI layer formation and irreversible side reactions, the initial reversible capacity of the ADIPAM electrodes is 661.8 mAh/g, and they achieve a CE of approximately 33.7%.
Figure 2
Figure 2.
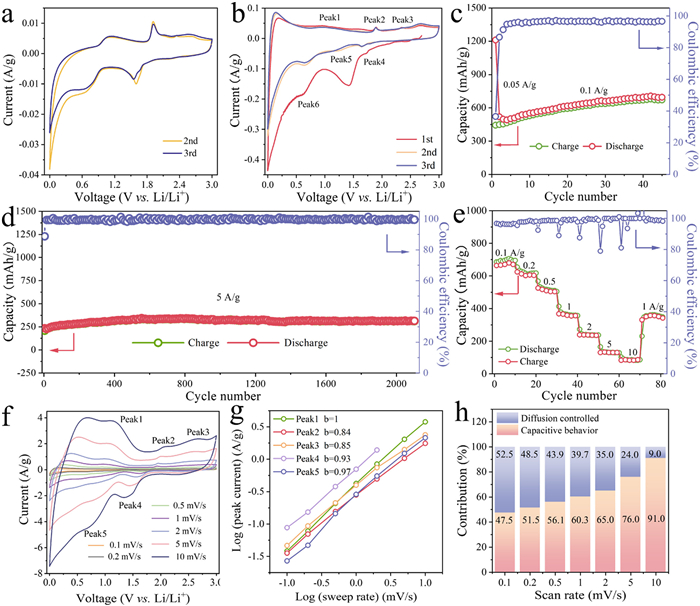
CV curves of (a) pure ADIPAM electrodes and (b) ADIPAM electrodes at 0.1 mV/s. Cycling performance of ADIPAM electrodes at (c) 0.1 A/g and (d) 5 A/g. (e) Rate performance of ADIPAM electrodes at various current densities from 0.1 A/g to 10.0 A/g. (f) CV profiles for the ADIPAM electrodes at different sweep rates. (g) Relationship between log(i) and log(v). (h) Capacity contribution at various scan rates.
Fig. 2c presents the cycling performance of the ADIPAM electrodes at 0.1 A/g. During the activation process at 0.05 A/g, the ADIPAM electrodes exhibit a discharge capacity of 1211.9 mAh/g. When the current is switched to 0.1 A/g, the discharge capacity decreases to 518.3 mAh/g. Furthermore, the discharge capacity gradually increases to 705.8 mAh/g between the 3rd and the 40th cycle, and then it maintains a stable discharge capacity of 693.5 mAh/g. This observed increase in capacity is mainly ascribed to the gradual activation of and pseudocapacitance-type behavior of the ADIPAM electrodes, and this is in good accordance with several previous reports [27,28,42,43]. As shown in Fig. S14 (Supporting information), the ADIPAM electrodes demonstrate remarkable cycling stability, achieving a discharge capacity of 680.1 mAh/g after 365 cycles at 0.5 A/g and a high CE of approximately 98.5% after the first 10 cycles. Furthermore, the ADIPAM electrodes retain a discharge capacity of 501.5 mAh/g after 465 cycles at 2 A/g (Fig. S15 in Supporting information). To further evaluate the cycling stability of the ADIPAM electrodes under higher current densities, the ADIPAM electrodes were tested at 5 A/g. As illustrated in Fig. 2d, a stable discharge capacity of 308 mAh/g can be achieved even after 2100 cycles, which suggests their superior high-rate cycling performance. These results prove that the ADIPAM electrodes have high specific capacity, excellent cycling stability, and high-rate electrochemical performance.
To identify the structural stability of the ADIPAM electrodes, SEM and TEM characterization were carried out. In Fig. S16 (Supporting information), the well-integrated ADIPAM–PVDF–Super P network architecture is shown to remain intact even after 200 cycles, except for the dense spiderweb-like SEI layer adhering to the surface of the ADIPAM network structure. Furthermore, the TEM images of the ADIPAM electrodes after 200 cycles show that the typical ADIPAM nanocrystals are uniformly coated by the PVDF (Fig. S17 in Supporting information). Notably, the size and interplanar lattice spacing of the ADIPAM nanocrystals remain almost unchanged relative to those of the pristine ADIPAM electrodes. This observation serves as compelling evidence of the excellent cycling and chemical stability of the ADIPAM electrodes during the discharge/charge process.
We further explored the rate capability of the ADIPAM electrodes at different current densities from 0.1 A/g to 10 A/g. Owing to the gradual activation process, we performed a rate measurement after 0.1 A/g cycling. Fig. 2e shows that the discharge capacities of the ADIPAM electrodes at 0.1, 0.2, 0.5, 1, 2, 5, and 10 A/g are 705.8, 602.1, 509.2, 358.8, 237.9, 130.5, and 83.3 mAh/g, respectively. Impressively, the discharge capacity recovered to 356.1 mAh/g when the current density returned to 1 A/g, which confirms the exceptional rate capability of the ADIPAM electrodes. To further elucidate the excellent rate performance of the ADIPAM electrodes, CV measurements were carried out at various scan rates ranging from 0.1 mV/s to 200 mV/s (Fig. 2f and Fig. S18 in Supporting information). Remarkably, all the CV curves displayed a similar shape, with slight shifts in both the anodic and cathodic peaks, which indicated the low polarization, fast redox kinetics, and excellent capacitive behavior of the ADIPAM electrodes.
Generally, the current (i) and the scan rate (v) obey a power law relationship according to i = av, in which a and b are adjustable constants. More importantly, the b value, which is determined by the slope of the log(v)–log(i) plots, is significantly related to the Li+ ions reaction kinetics and serves as a means to discern different types of Li+ ions storage. The values of b = 0.5, b = 1, and b = 0.5–1 correspond to Li+ ions diffusion-controlled behavior, the Li+ ions capacitive process, and the coexistence of both of these processes, respectively [12,28,33]. As shown in Fig. 2g, the calculated b values at Peak1, Peak2, Peak3, Peak4, and Peak5 are 1, 0.84, 0.85, 0.93, and 0.97, respectively. These values verify the existence of hybrid Li+ ions reaction kinetics, in which diffusion-controlled behavior is combined with predominant capacitive process. Moreover, according to the equation i = k1v + k2v1/2, where k1v and k2v1/2 represent the surface capacitance and Li+ ions diffusion [44,45], respectively, we are able to quantify the contributions of the capacitive behaviors to the overall capacity. Fig. 2h summarizes the contributions of the capacitive behaviors of the ADIPAM electrodes from 0.1 mV/s to 10 mV/s. The calculated capacitive contributions are 47.5%, 51.5%, 56.1%, 60.3%, 65.0%, 76.0%, and 91.0% at 0.1, 0.2, 0.5, 1.0, 2.0, 5.0 and 10.0 mV/s, respectively, which further reveal that capacitive behavior occupies the majority of the whole capacity. Meanwhile, the quantitative analysis at 10 mV/s demonstrates that 91.0% of the total capacity results from the capacitance effect (Fig. S19 in Supporting information). Thus, the ADIPAM electrodes exhibit rapid reaction kinetics and excellent rate capability.
To reveal the Li+ ions storage mechanism of the ADIPAM molecules during the cycling process, we analyzed the ADIPAM electrodes at different discharge depths using the ex-situ FTIR (Fig. 3a). In the FTIR spectra of pristine ADIPAM electrodes (Fig. 3b and Fig. S20 in Supporting information), three distinct FTIR peaks at 3179.5/3375.5, 1647.2 and 1411.9 cm−1 can be observed, and these are assigned to the N-H/-NH2, -C=O, and -C-N bonds, respectively. Upon discharge at 2.5 V, the -C=O groups weaken, and a new peak appears at 837.1 cm−1 that indicates the formation of -C-O-Li groups, which demonstrates the reaction of Li+ ions with the -C=O bonds [28]. Specifically, the appearance of -C=N signals suggests a structural conversion from the -C-NH2-O groups to the -C=NH-O groups via a hydrogen-transfer mechanism, which agrees well with the previous literature [30]. Meanwhile, a blueshift can be observed in the -C-N bonds, and it is attributed to the intercalation of Li+ ions. On further discharge, the intensity of the peak at 3740.5 cm−1 that is attributed to the -Li-N bands significantly increases [46], whereas the -C=N peak remains unchanged. This observation further demonstrates that the -NH2 groups serve as the active sites for Li+ ions, which contrasts with previous reports that the Li+ ions are primarily stored in -C=N groups.
Figure 3
Figure 3.
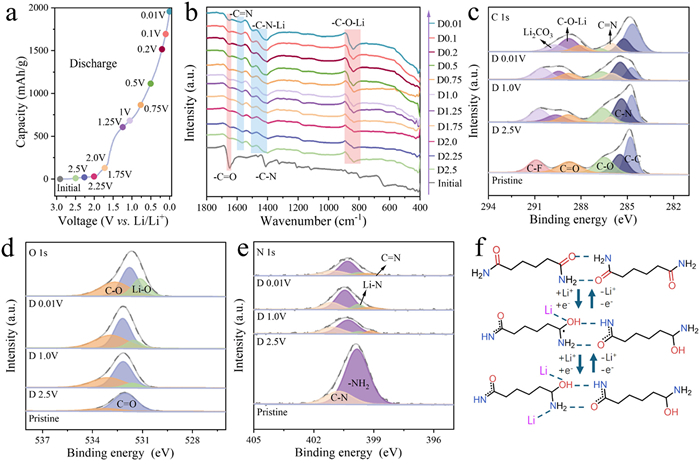
(a) The galvanostatic discharge profile of ADIPAM electrodes at 5 mA/g during the initial discharge process. (b) Ex-situ FTIR spectra, (c) C 1s, (d) O 1s, and (e) N 1s XPS spectra of ADIPAM electrodes cycled to different discharge states. (f) Redox mechanism of ADIPAM electrodes.
The structural evolution of the ADIPAM electrodes upon discharging was further deciphered by ex-situ XPS analysis. As shown in Fig. S21 (Supporting information), the XPS survey of the pristine ADIPAM electrodes reveals the presence of C, N, and O elements, whereas the discharged ADIPAM electrodes newly present the Li element, which confirms the intercalation of Li+ ions. The C 1s spectrum of the pristine ADIPAM electrodes can be split into the five major components of the -C-C, -C-N, -C-O, -C=O, and -C-F bonds (Fig. 3c). Upon the insertion of Li+ ions into the ADIPAM molecules (at 2.5 V), the -C=N bonds at around 286.1 eV appeared, as a manifestation of the transformation of the functional groups from -C-NH2-O to -C=NH-O. Simultaneously, the emergence of -C-O-Li bonds can be seen at 2.5 V, followed by a continuous increase. Moreover, the -C=O bonds gradually decreased, which demonstrates that the -C=O groups were the corresponding active sites for lithiation [29]. The O 1s spectra further provide support for this interpretation (Fig. 3d). When it was discharged to 2.5 V, the Li-O bonds appeared, revealing a reduction in the -C=O groups. In addition, the area ratio of the -C-O/Li-O groups to the -C=O groups gradually increased during the lithiation process. This corresponded to the intercalation of Li+ ions into the -C=O groups. The N 1s XPS spectra of the ADIPAM electrodes during discharge are shown in Fig. 3e. When the electrodes are discharged to 2.5 V, two new peaks emerge at 399.8 and 399.1 eV that are ascribed to the -Li-N and -C=N bonds [47], respectively, attributed to the Li+ ions insertion and hydrogen transfer behavior. Notably, a redshifted, decreased area ratio of the -NH2 groups on Li+ ions uptake can be observed, and the -C=N single remains until discharge at 0.01 V, confirming that the -NH2 bonds are the active redox sites. The Li 1s spectra of the ADIPAM electrodes (Fig. S22 in Supporting information) reveal that at discharge to 2.5 V, the peaks located at 55.6 and 55.0 eV represent the Li-N and Li-O bonds, respectively, which further shows the reaction of the -C=O and -NH2 bonds. Considering these results, we infer that both the -C=O and -NH2 groups participated in the Li+ ion intercalation processes.
Accordingly, we propose the Li+ ions storage mechanisms of the ADIPAM electrodes (Fig. 3f). During the lithiation process, the ADIPAM electrodes preferentially undergo hydrogen transfer, accompanied by the lithiation of the -C=O bonds, which is followed by Li+ ions insertion into the -NH2 groups as well.
To demonstrate the potential practical applications of the ADIPAM electrodes, a full LIC cell was fabricated that comprised an ADIPAM anode and an AC cathode (denoted as the ADIPAM||AC LIC), as shown in Fig. 4a. The CV curves of the AC electrodes at various voltage windows displayed a quasi-rectangular shape (Fig. S23 in Supporting information), which confirmed the typical surface adsorption/desorption capacitive characteristic. Theoretically, the ADIPAM||AC LICs can achieve a wide voltage window of up to 5.0 V (Fig. S24 in Supporting information). We first performed CV tests on the ADIPAM||AC LICs at 2 mV/s under varying voltage windows. As shown in Fig. 4b, all the CV curves of the ADIPAM||AC LICs exhibit a similar quasi-rectangular shape with little difference when the voltage window is expanded from 3.0 V to 5.0 V. This indicates the presence of pseudocapacitive behavior in ADIPAM||AC LICs and suggests they can operate up to 5.0 V, thereby enabling high energy densities. Furthermore, the GCD profiles also demonstrate the viability of operation of the ADIPAM||AC LICs at 5.0 V (Fig. S25 in Supporting information). We further calculated the energy density, CE, and voltage drop of the ADIPAM||AC LICs according to the GCD profiles (Fig. 4c). The energy density exhibits a significant increase with the expansion of the voltage window. In particular, the energy densities (calculated based on the total mass of the ADIPAM and AC materials) are 74, 101, 125.2, 143.7, 178.8, 204.1, 215.4, 247.8, and 268.5 Wh/kg at voltage windows of 3.0, 3.5, 3.8, 4.0, 4.3, 4.5, 4.6, 4.8, and 5.0 V, respectively. In addition, the CE of the ADIPAM||AC LICs is 97.4% at 3.0 V, and it gradually decreases to 83.5% at 4.5 V and then significantly drops to an ultralow CE of 55.4% at 5.0 V. Meanwhile, the voltage drop shows a slight change from 3.0 V to 4.5 V, and notably increases to 162.5 mV from 4.5 V to 5.0 V. This decrease in CE and increase in voltage drop are mainly ascribed to the oxidation decomposition of the electrolyte at high voltage and to the formation of a passivation film. Moreover, the ADIPAM||AC LICs show poor cycling stability (Fig. S26 in Supporting information) and rate capability (Fig. S27 in Supporting information) when the voltage window extends to 5.0 V. Therefore, we ultimately chose the range of 0.001–4.5 V as the optimal working voltage window with which to evaluate the electrochemical performance of the ADIPAM||AC LICs.
Figure 4
Figure 4.
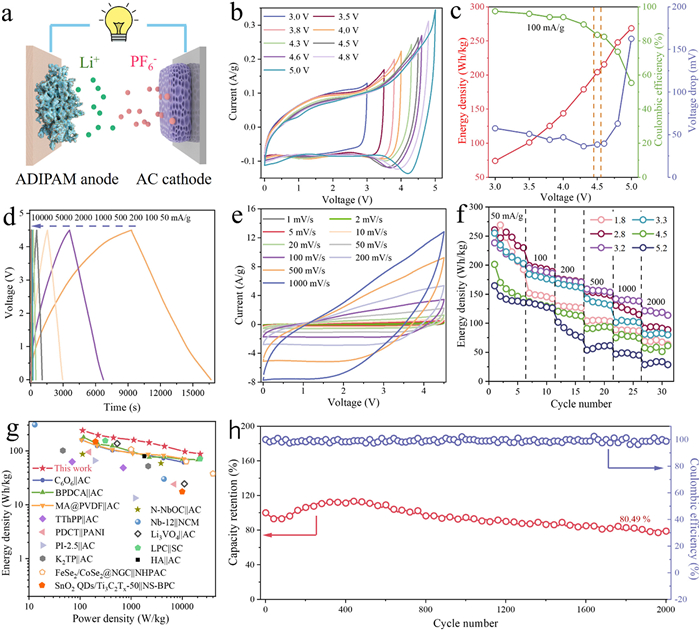
(a) Schematic illustration of ADIPAM||AC LICs. (b) CV curves of ADIPAM||AC LICs for voltage windows of various sizes. (c) The energy density, CE, and voltage drop for the ADIPAM||AC LICs at different voltage windows. (d) GCD profiles of ADIPAM||AC LICs. (e) CV curves of ADIPAM||AC LICs at different scan rates. (f) Rate energy density of ADIPAM||AC LICs at various weight ratios for the AC cathode to ADIPAM anode. (g) Ragone plots of ADIPAM||AC LICs compared with recently reported LICs, NICs, and KICs. (h) Cycling performance of ADIPAM||AC LICs at 1 A/g.
Fig. 4d presents the GCD curves of the ADIPAM||AC LICs in the voltage window of 0.001–4.5 V at various current densities that range from 50 mA/g to 10,000 mA/g. These curves display a nonlinear and approximately symmetric triangle without a noticeable voltage drop, and they confirm the coexistence of a double-layer of electrical capacitance and pseudocapacitance within the ADIPAM||AC LICs, which can be ascribed to the non-Faradic reactions at the AC cathode and the pseudocapacitance at the ADIPAM anode. Moreover, the GCD profiles retain an approximately symmetric triangular shape even at 10 A/g, which demonstrates the excellent rate capability and high-power density of the ADIPAM||AC LICs. CV measurements at various scan rates from 1 mV/s to 1000 mV/s were captured to further investigate the charge storage mechanism and electrochemical properties of the ADIPAM||AC LICs. As presented in Fig. 4e, the CV curves exhibit a quasi-rectangular shape with a weak redox peak, which further imply the coexistence of adsorption/ desorption and pseudocapacitive reactions. Even at 10 V/s, the CV profiles present a mirror-image, quasi-rectangular symmetry, which indicates the excellent capacitive behavior and superior reversibility of the ADIPAM||AC LICs. To achieve optimal electrochemical performance for the ADIPAM||AC LICs, the weight ratio between the non-Faradic AC cathode and the Faradic ADIPAM anode must be balanced. Of all the tested weight ratios, the weight ratio of 3.2 results in the best rate performance for the ADIPAM||AC LICs (Fig.4f), which indicates that the optimal mass ratio of the AC cathode to the ADIPAM anode is 3.2.
With an optimal mass ratio and a high voltage window of 4.5 V, the ADIPAM||AC LICs achieve a maximum energy density of 238.3 Wh/kg at a power density of 112.5 W/kg (Fig. 4g). Interestingly, even at a power density of 22,500 W/kg, the ADIPAM||AC LICs maintain an energy density of 87.5 Wh/kg. Please note that the energy-power density performance of the ADIPAM||AC LICs surpasses that of previously reported organic anode-based Li/Na/K-ion capacitors (LICs/NICs/KICs) and that of advanced inorganic LICs (Table S1 in Supporting information), such as C6O6||AC LICs [29], BPDCA||AC LICs [28], MA@PVDF||AC LICs [27], TThPP||AC LICs [48], PDCT||PANI NICs [49], PI-2.5||AC NICs [50], K2TP||AC KICs [51], HA||AC KICs [52], N-NbOC||AC LICs [53], SnO2 QDs/Ti3C2Tx-50||NS-BPC LICs [54], Nb-12||NCM LICs [55], FeSe2/CoSe2@NGC||NHPAC LICs [56], Li3VO4||AC LICs [12] and LPC||SC LICs [57]. Additionally, the ADIPAM||AC LICs in the present study also showed excellent cycling stability relative to other reported LICs/NICs/KICs (Table S2 in Supporting information), with a capacity retention of 80.49% after 2000 cycles at 1 A/g. They attained a high CE of 98% (Fig. 4h). Therefore, ADIPAM compounds serve as universal anode materials for high-performance LIC devices.
In conclusion, we have reported a first comprehensive investigation into the electrochemical performance of novel non-conjugated ADIPAM anode materials for LICs having high energy/power density. Intriguingly, by using a dissolution- recrystallization process, a highly conductive ADIPAM nanocrystal—PVDF–Super P network architecture was successfully constructed, which significantly boosted the transport of Li+ ions and electrons and suppressed the dissolution of ADIPAM molecules. As expected, the ADIPAM electrodes showed a high capacity of up to 705.8 mAh/g at 0.1 A/g, with an impressively cycling retention of 91.2% (relative to the maximum capacity) after 2100 cycles at 5 A/g, and exceptional rate capability. The detailed mechanism of Li+ ion intercalation into the ADIPAM electrodes during the discharge process was explored by FTIR and XPS measurements, which revealed that the -C=O and -NH2 groups served as the respective redox sites for Li+ ion storage. Moreover, by coupling the ADIPAM anode with the AC cathode, a 4.5 V organic ADIPAM||AC LIC was successfully fabricated. As a result, the ADIPAM||AC LIC offered high energy and power densities (238.3 Wh/kg and 22,500 W/kg) that were competitive with those of the advanced LICs recently reported. More broadly, our work initiates an exploration into non-conjugated organic materials for the development of tunable and sustainable LICs.
Declaration of competing interest
The authors declare that they have no known competing financial interests or personal relationships that could have appeared to influence the work reported in this paper.
This work was supported by the National Natural Science Foundation of China (Nos. 22309022, 92372101), the Project of Natural Science Foundation of Chongqing, China (Nos. CSTB2023NSCQ-MSX0405, CSTB2023NSCQ-LZX0039), the Science and Technology Research Program of Chongqing Municipal Education Commission (No. KJQN202201104), the Key Project of Chongqing Technology Innovation and Application Development (No. CSTB2023TIAD-KPX0091), and the China Postdoctoral Science Foundation (No. 2023M742888).
Supplementary materials
Supplementary material associated with this article can be found, in the online version, at doi:10.1016/j.cclet.2024.110305.
[1]
H. Wang, C. Zhu, D. Chao, et al., Adv. Mater. 29 (2017) 1702093. doi: 10.1002/adma.201702093
[2]
A. Jagadale, X. Zhou, R. Xiong, et al., Energy Storage Mater. 19 (2019) 314–329. doi: 10.1016/j.ensm.2019.02.031
S. Tao, J. Cai, Z. Cao, et al., Adv. Energy Mater. 13 (2023) 2301653. doi: 10.1002/aenm.202301653
[57]
Q. Peng, K. Wang, Y. Gong, et al., Adv. Funct. Mater. 33 (2023) 2308284. doi: 10.1002/adfm.202308284
Figure 1
(a) Schematic diagram of the synthetic procedure of the ADIPAM nanocrystals-PVDF-Super P network architecture. (b) XRD patterns of ADIPAM powders and ADIPAM electrodes. (c) FTIR spectra of PVDF powders, ADIPAM powders, and ADIPAM electrodes. (d) High-resolution XPS spectra of C 1s for ADIPAM powders and ADIPAM electrodes. (e) SEM images and (f) TEM images of ADIPAM electrodes. (g) HRTEM images of ADIPAM electrodes. (h) EDS mapping images of ADIPAM electrodes (C, red; N, green; O, blue; F, cyan).
Figure 2
CV curves of (a) pure ADIPAM electrodes and (b) ADIPAM electrodes at 0.1 mV/s. Cycling performance of ADIPAM electrodes at (c) 0.1 A/g and (d) 5 A/g. (e) Rate performance of ADIPAM electrodes at various current densities from 0.1 A/g to 10.0 A/g. (f) CV profiles for the ADIPAM electrodes at different sweep rates. (g) Relationship between log(i) and log(v). (h) Capacity contribution at various scan rates.
Figure 3
(a) The galvanostatic discharge profile of ADIPAM electrodes at 5 mA/g during the initial discharge process. (b) Ex-situ FTIR spectra, (c) C 1s, (d) O 1s, and (e) N 1s XPS spectra of ADIPAM electrodes cycled to different discharge states. (f) Redox mechanism of ADIPAM electrodes.
Figure 4
(a) Schematic illustration of ADIPAM||AC LICs. (b) CV curves of ADIPAM||AC LICs for voltage windows of various sizes. (c) The energy density, CE, and voltage drop for the ADIPAM||AC LICs at different voltage windows. (d) GCD profiles of ADIPAM||AC LICs. (e) CV curves of ADIPAM||AC LICs at different scan rates. (f) Rate energy density of ADIPAM||AC LICs at various weight ratios for the AC cathode to ADIPAM anode. (g) Ragone plots of ADIPAM||AC LICs compared with recently reported LICs, NICs, and KICs. (h) Cycling performance of ADIPAM||AC LICs at 1 A/g.

 DownLoad:

 下载:
下载:


 下载:
下载:
