Figure 1.
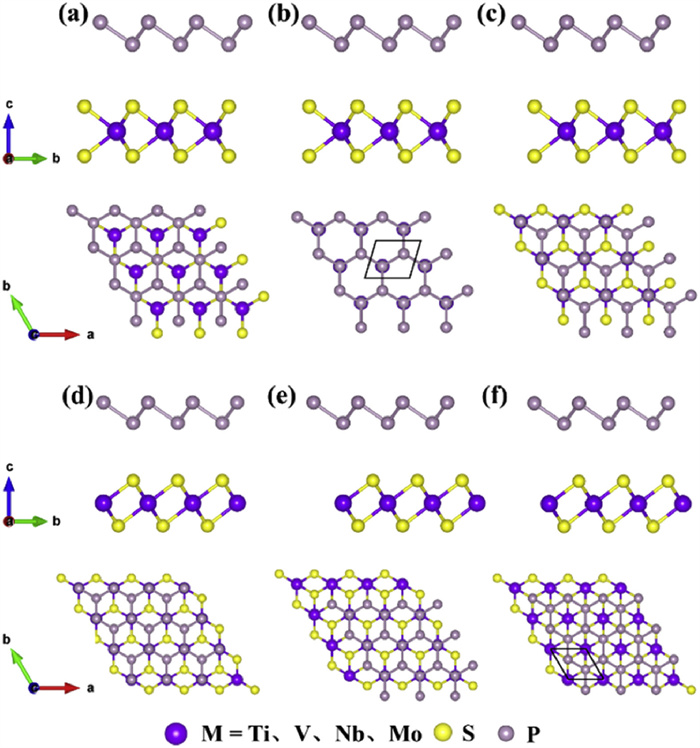
Side and top views of H(T)-MS2/BlueP (M = Ti, V, Nb and Mo) heterostructures with three stacking pattern: (a, d) mode i, (b, e) mode ii, and (c, f) mode iii.
First-principles study on the electrochemical properties of Na-ion-intercalatable heterostructures formed by transitional metal dichalcogenides and blue phosphorus
Qiangqiang Zhou , Lili Sun , Yu-Jie Guo , Bo Zhou , Chunfang Zhang , Sen Xin , Le Yu , Gaohong Zhai

Along with the commercialized lithium-ion batteries (LIBs) have been adopted as conventional energy storage devices for electric vehicles and residential power grid nowadays, the limited lithium metal reserves and safety concerns hampered its further and more widespread applications in next generation energy storage systems [1-6]. The sodium-ion batteries (SIBs) were considered as promising alternative due to lower cost, higher theoretical capacity, improved thermal stability, compatibility with existing battery manufacturing facility as well as abundance of sodium resources [7-10]. Despite the similarities in the working mechanisms between SIBs and LIBs, the larger radius of sodium ion and weaker Na binding stability present challenges in intercalate/deintercalate process within conventional anode materials for SIBs on requirement of expanded volume, which would result in reduced ion mobility, energy storage capacity and charging rate [11,12]. Therefore, developing high performance electrode materials for SIBs has been a topic of interest [13-18]. Inspired by the two-dimensional (2D) graphene [19-21], numerous 2D materials, e.g., T-BN [22], SiB [23], Mxenes [24-28], black phosphorus (Black-P) [29,30] and transition metal dichalcogenides (TMDs) [31-34], have been investigated as anodes of SIBs aiming at improve electrochemical performances.
The graphene-like 2D slabs of TMDs can be easily fabricated through mechanical or chemical exfoliation procedures from bulk materials [35-37]. These TMDs slabs possess inherent characteristics of substantial specific surface area and remarkable mechanical robustness, rendering them successfully applied in catalysis, energy storage and conversion, and field-effect electronics. Among 2D TMDs materials, the metallic VS2 and NbS2 have been found to demonstrate notable characteristics as anodes for LIBs, for example, the reported capacity of 1397.0 mAh/g (VS2) and 341.0 mAh/g (NbS2), along with commendable ion mobility [38,39]. However, when employed as anodes in SIBs, they exhibit moderate performances with capacities of 330.0 mAh/g (VS2) and 262.5 mAh/g (NbS2). Furthermore, the computed voltage of 1.46 V for the VS2 anode is unsuitable for SIBs, in contrast, the NbS2 anode exhibits a moderate theoretical voltage of 0.95 V. On the other hand, the theoretical capacities of MoS2 (258.3 mAh/g) and TiS2 (340.6 mAh/g) along with respective voltages of 0.49 V and 0.93 V, suggest their potential suitability as anode materials for SIBs. However, their inherent semiconducting properties are likely to impede their rate performance. Additionally, the MoS2 suffering from phase transformation during sodium intercalation, which significantly limits its cycle life performance in SIB applications. It is worth noting that the occurrence of undesirable restacking is an unavoidable problem during repetitive charge-discharge cycles, leading to structural degradation and capacity fading [40].
The 2D allotrope of phosphorene, commonly referred to as blue phosphorene (BlueP), has attracted considerable attention as potential anode material for metal ion batteries [41,42]. The zigzag puckered surface of BlueP give rise to remarkably thermal stability and offers ample space to storage substantial capacity of sodium ion. Computational investigations have revealed that BlueP exhibits impressive specific capacity of 865.0 mAh/g and relative low diffusion barrier of 0.11 eV, demonstrating good electrochemical performances as anode for SIBs [43,44]. However, the practical application of BlueP is hindered by several inherent drawbacks, including its low electrical conductivity resulting from a wide band-gap, low stiffness, and chemical susceptibility to oxidation condition. To enhance the electrochemical properties of BlueP, fabrication of heterostructures by integrating BlueP with suitable 2D materials through van der Waals (vdW) interactions emerges as a promising approach to preserve desired characteristics and overcome those restrictions.
Heterostructures comprising BlueP and various 2D slabs, such as graphene [45], h-BN [46], C3N [47,48], BC2N [49], black phosphorene (BLK-P) [50] and MS2 (M = V, Nb, Ta, Mo) [51-53], have been reported as promising candidates for anode materials in both LIBs and SIBs. These heterostructures featuring with strong binding affinity towards Li/Na cation, impressive specific capacity and exceptional low diffusion barriers, as well as enhanced thermodynamic stability, mechanical strength and chemical inertness. However, it should be noted that the large band-gaps of h-BN, C3N, BLK-P and MoS2 still persist when they form heterostructures with semiconducting BlueP, thereby limiting their suitability as suitable electrode materials for LIBs and SIBs. The metallic VS2, NbS2 and TaS2 serve as good substrates for BlueP based heterostructures due to small lattice mismatch ratio. Computational analyses have revealed that the hexagonal (H) and trigonal (T) phase VS2/BlueP heterostructures rendering specific capacity of up to 1211.3 mAh/g and diffusion barriers of 0.17 (0.16) eV when employed as anode for LIBs. Similarly, NbS2/BlueP and TaS2/BlueP heterostructures have been observed to sustain significant strains and render moderate theoretical capacity of 528.3 mAh/g for LIBs. Moreover, these MS2/BlueP heterostructures benefit from the excellent conductivity of metallic MS2, ensuring efficient electron transport and favorable rate performance [51,52].
In light of the absent of theoretical predictions regarding the performance of MS2/BlueP heterostructures as anodes for SIBs, this work aims to systematically investigate the electrochemical properties of H(T)-MS2/BlueP (M = Ti, V, Nb and Mo) heterostructures as potential anode materials for SIBs by means of first principle calculations. The computational analysis presented here reveals that all of these heterostructures exhibit enhanced structural stability and mechanical stiffness compared to their isolated counterparts. Additionally, stable Na adsorption with rapid mobility and substantial theoretical capacity is observed. Notably, the H(T)-NbS2/BlueP and T-NbS2/BlueP heterostructures show the best capacity performances, capable of accommodating up to four layers of Na and give rise to impressive theoretical capacities of 570.2 and 746.7 mAh/g, respectively.
The density functional theory (DFT) embedded in the Vienna ab initio simulation package (VASP) [54] was utilized to investigate the target systems. The electron-ion interaction was described using the projector augmented wave (PAW) method [55] and the Perdew-Burke-Ernzerhof (PBE) functional under the generalized gradient approximation (GGA) was employed to handle the exchange-correlation energy [56,57]. The Grimme DFT-D3 dispersion correction was incorporated to describe the van der Waals interactions between layers [58]. To avoid periodic interaction, a vacuum layer of 20 Å was added in the z direction of the heterostructure. Additionally, a plane wave cutoff energy of 500 eV was set. For the sampling of the Brillouin zone, the Monkhorst-Pack k-point grid centered at Gamma was used (4 × 4 × 1 for structure relaxation calculations and 11 × 11 × 1 for density of states calculations (DOS)). During the structure relaxation process, the energy and force convergence criterion were set to 1 × 10⁻⁵ eV and 0.01 eV/Å, respectively. Bader charge analysis was employed to quantify the charge transfer. The Na diffusion pathways and barriers were determined using the climbing image nudged elastic band (CI-NEB) method [59,60], with k-point grid of 4 × 4 × 1 and the energy and force convergence criteria set as 1 × 10⁻⁵ eV and 0.02 eV/Å, respectively. Thermodynamic stability of the heterostructures were examined by means of the ab initio molecular dynamics (AIMD) simulations up to 6 ps with a time step of 1 fs at room temperature using the Nosé-Hoover thermostat in the NVT ensemble [61].
In this work, the hexagonal and trigonal phase MS2 (M = Ti, V, Nb and Mo) monolayers and BlueP are utilized to build the MS2/BlueP heterostructures via six stacking patterns as shown in Fig. 1. Specifically, the lower-layer P atoms of blue phosphorene lie on top of upper layer S atom (Figs. 1a and d), the transition metal M atoms (Figs. 1b and e), and the interstitial site (Figs. 1c and f) of H- and T-MS2 polymorphs. The fully relaxed lattice constants for H(T)-TiS2, -VS2, -NbS2, -MoS2 and BlueP are 3.33(3.38) Å, 3.16(3.16) Å, 3.32(3.34) Å, 3.16(3.17) Å, and 3.27 Å, respectively, which are in good agreement with previous computational results [40,41]. Furthermore, the lattice mismatch ratios between the H(T)-MS2 1 × 1 primitive cells and BlueP 1 × 1 unit cell are 1.73(3.37)%, 3.50(3.60)%, 1.50(1.98)%, and 3.44(3.20)% respectively. Considering that the lattice mismatch ratios for all potential heterostructures are less than 4%, it is anticipated that the fabrication of high-quality MS2/BlueP heterostructures can be achieved [45,62]. The stacking stabilities of heterostructures displayed in Fig. 1 are evaluated by comparing the binding energy Eb defined by
|
|
(1) |
where
The thermal stability of the MS2/BlueP heterostructures are verified by carrying out ab initio molecular dynamics simulations in the NVT ensemble. Fig. S1 (Supporting information) depicts the time evolution of the potential energy and temperature of H(T)-MS2/BlueP structures for 6 ps with a time step of 1 fs. It is clear that both the energy and temperature exhibit periodical fluctuations within a narrow region and achieving stabilization after simulation. The top and side views of the end-step structures in each MD simulation are given as insert map in respective subgraph of Fig. S1 (Supporting information), and no distortion or fracture were observed to take place, which confirming the excellent thermal stabilities of all H(T)-MS2/BlueP heterostructures.
Additionally, to evaluating whether these MS2/BlueP heterostructures could retain satisfactory mechanical stability during Na+ adsorption processes, we have calculated the elastic constants (Cij) [69]. As listed in Table S2 (Supporting information), the elastic constants of BlueP are C11 = 79.46 N/m, C12 = 8.12 N/m, and C66 = 35.67 N/m, which agree with previous works very well [45,48,51]. However, after fabricating heterostructures with MS2, the Young's moduli evidently increased, implying improved mechanical stiffness in MS2/BlueP. In addition, the Poisson's ratio of BlueP is close to 0, which means that BlueP has high dimensional stability, high structural stability and optimized mechanical properties. When BlueP formed heterostructures with MS2, it was observed that the Poisson's ratio of the heterostructures decreased compared with original MS2, indicating that the structural stability and mechanical properties of the heterostructures were enhanced and the stress distribution was improved. This makes them better suited for more complex operating environments. Moreover, the elastic constants of all MS2/BlueP heterostructures fulfill the Born criteria (C11 > 0, C11 > |C12|) [70], also suggesting good mechanical stability. Therefore, when using as anodes, all the MS2/BlueP heterostructures could bearing the lattice deformation and volume expansion during sodium intercalation-deintercalation processes and showing good cyclic stability.
Fig. S2 (Supporting information) presents the projected band diagrams of monolayer blue phosphorene, MS2, and MS2/BlueP heterostructures. Blue phosphorene monolayer is an indirect bandgap semiconductor with a bandgap of 1.94 eV, consistent with previous reports [52,41,71]. In MS2, H-TiS2 and H-MoS2 are semiconductors with bandgaps of 0.73 and 1.74 eV, respectively, while the other six MS2 materials are conductive with metallic properties. Upon forming heterostructure with MS2, the conduction band minimum (CBM) and valence band maximum (VBM) of blue phosphorus shift downwards. In the H-TiS2/BlueP heterostructure, this downward trend in blue phosphorus is slight, with the conduction band reducing by 0.11 eV, while in T-NbS2/BlueP, which is most evident, with a reduction of 1.26 eV In contrast, the electronica character of MS2 in heterostructures show different trends, in H-VS2/BlueP and H—NbS2/BlueP, the CBM and VBM of H-VS2 and H—NbS2 show negligible shifts, whereas in T-VS2/BlueP and T-NbS2/BlueP, T-VS2 and T-NbS2 exhibit significant drops at symmetric M and K points. Furthermore, in the H-TiS2/BlueP and H-MoS2/BlueP heterostructures, their bandgap widths decrease by 0.34 and 0.78 eV, respectively. However, the CBM and VBM in T-TiS2/BlueP and T-MoS2/BlueP heterostructures do not show significant shifts. These observations indicate that the formation of heterostructures significantly reduces the semiconductor's bandgap width. Owing to the weak van der Waals interactions in the heterostructures, the electronic properties of individual monolayers remain largely unaltered within the heterojunction. In essence, the band diagram of the MS2/BlueP heterostructures can be regarded as a straightforward combination of the original monolayer MS2 and BlueP. These results suggest that VS2, NbS2, T-TiS2, and T-MoS2 serve as effective additives for significantly improving material conductivity, while the interaction between blue phosphorus and semiconducting H-TiS2, and H-MoS2 lead to reduction of the bandgap value. These phenomena indicate that the aforementioned materials have hold considerable promise as anode materials for batteries with enhanced conductivity.
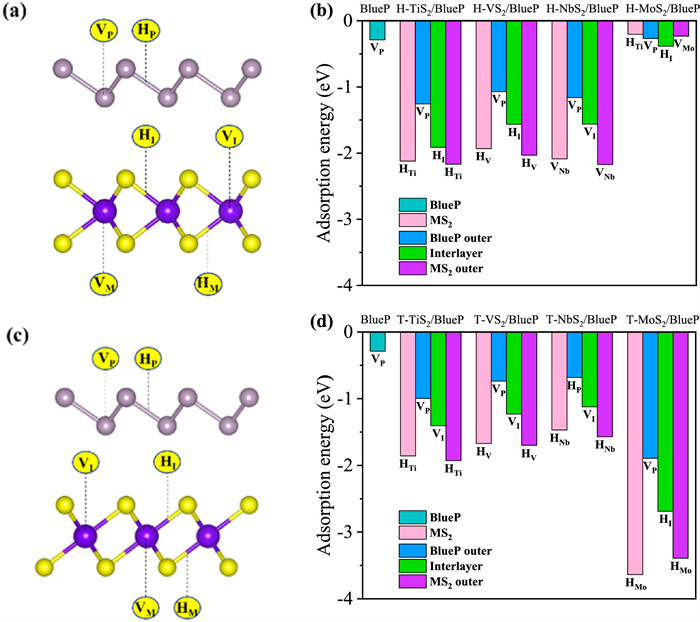
The adsorption stability and adsorption site selectivity of metal ions on the surface of anode materials are important for evaluating the battery performance. To find the preferred Na adsorption site on MS2/BlueP heterostructures, six typical adsorption sites (Figs. 2a and c) within three groups are taken into account: (1) Outer surface of BlueP (MS2/BlueP/Na), including on top of the BlueP valley (VP) and hexagon hole (HP) site; (2) Interlayer between the MS2 and BlueP (MS2/Na/BlueP), including on top of the transition metal M atom (VI) and hole site (HI) in MS2; (3) Outer surface of MS2 (Na/MS2/BlueP), including below the atom M (VM) and hole site (HM) in MS2. The favorable adsorption sites of MS2/BlueP are identified by comparing their single-atom Na adsorption energy (Eads) using the following equation [43,72]:
|
|
(2) |
where EHetero+Na and EHetero are the total energies of heterostructures with and without Na adsorbed, ENa is the energy of per Na atom in the bulk metal. The adsorption energies for six adsorption sites on investigated heterostructures are listed in Table S3 (Supporting information) and the values for favored sites on three adsorption surfaces are shown in Figs. 2b and d. It is clear that Na cation could effectively adsorbed on each surface of all investigated heterostructures as indicated by the negative Eads values. For TiS2/BlueP, VS2/BlueP and NbS2/BlueP, the H phase show better Na adsorbing ability on MS2 and BlueP outer surfaces and interlayer, comparing to their T phase counterpart. The most stable Na adsorption site for H—NbS2/BlueP is VNb with Eads of −2.18 eV, however, the hole site (HM) is preferred in T-NbS2/BlueP, H(T)-TiS2/BlueP and H(T)-VS2/BlueP, with adsorption energies of −1.57, −2.17 (−1.93) and −2.03 (−1.70) eV, respectively. Such a Na adsorption site selectivity is in agreement with the monolayer MS2, as listed in Table S4 (Supporting information). Moreover, the Na adsorption energies on BlueP outer surfaces are much larger than the original BlueP, nevertheless, every MS2 outer surface shows slightly lowered adsorption energies after formation of heterostructure and each interlayer occupies Na adsorption energy in between monolayer BlueP and corresponding MS2. On the other hand, T-MoS2/BlueP exhibits superior Na cation binding ability than H-MoS2/BlueP. For H-MoS2/BlueP heterostructure, the HI site exhibits the highest favorability with Eads of −0.39 eV. Additionally, it is observed that the Na adsorption ability on outer surfaces of T-MoS2/BlueP is weakened comparing with pristine monolayers. While for T-MoS2/BlueP, the adsorption energy at favored HMo site (−3.40 eV) are the lowest among the investigated heterostructures, although which is still slightly higher than monolayer T-MoS2. Except for H-MoS2/BlueP, the Na adsorption energies on other investigated MS2/BlueP heterostructures are much lower than the Na cohesion energy (−1.11 eV) [73], therefore, which are away of non-uniform sodium deposition and dendrites formation upon cycling and thus improving the efficiency, safety and lifetime of SIBs.
To get deeper insight on the Na adsorption process on MS2/BlueP, we calculated the charge density difference (Δρ) between Na embedded (ρHetero+Na) heterostructure and bare (ρHetero) system with isolated Na atom (ρNa) via equation:
|
|
(3) |
The isosurfaces for charge density difference of each heterostructure with Na adsorbed at the most stable site are shown in Fig. S3 (Supporting information). The electron-rich region (purple) appeared between Na and MS2 when Na adsorbed at MS2 outer surface, and simultaneously, the electron-deficient region (green) surrounded the Na atom. For H-MoS2/BlueP with Na intercalated at interlayer, electron accumulation takes place at both Na/MS2 and Na/BlueP interfaces. Obviously, a substantial amount of charge transferred from Na to adjacent MS2 or BlueP layer. The amount of transferred electrons is quantified by Bader charge analysis and presented in Table S3 (Supporting information). Na transferred approximately 0.76–0.85 e- to the adjacent interface of heterostructures and the maximum electron loss appears at each most stable binding site. Only in H-MoS2/BlueP and T-MoS2/BlueP systems, electron accumulation occurs at the BlueP surface with both BlueP outer (−0.57 and −0.36 e-) and interlayer (−0.34 and −0.03 e-) Na adsorption. However, for other heterostructures, BlueP could acquire a small amount of electron (−0.07 e- to −0.13 e-) only when Na binds at BlueP outer surface. The charge density difference and Bader charge analysis confirm the ionic character of Na and strong ion-ion interactions between Na and MS2/BlueP, and suggesting that Na ions are chemically adsorbed on the surface of the heterostructure [74].
Upon formation of MS2/BlueP heterostructures, the Fermi level shifts toward the conduction band as a fact of the weak charge transfer within sublayers. Subsequent Na intercalation result in increased density of states at the Fermi level, which would significantly improve the electronic conductivity of the combined system. Furthermore, as shown in Fig. S4g (Supporting information), even for the semiconductor H-MoS2/BlueP heterostructure, the Na intercalation could induce a semiconductor to metallic conversion. Additionally, the presence of numerous electronic states near the TDOS maximum peak indicates a high carrier density, which ensures high efficiency charge transport within these anode materials. The PDOS reveals that the electronic states near the Fermi level are primarily composed of the d orbitals of transition metal atoms and partially by p orbitals of sulfur atoms. In conclusion, the conductivity of MS2/BlueP heterostructures is significantly enhanced through Na intercalation process. Consequently, monolayer MS2 serves as an ideal substrate for heterostructures with potential as anode materials for high-performance SIBs.
The charging rate performance of sodium ion battery strongly dependent on the Na diffusion property on anodes. Starting from the most stable adsorption site of each MS2/BlueP heterostructure, the Na migration kinetics to the neighboring site was evaluated by the CI-NEB method. Three possible diffusion pathways were examined (Fig. 3a): (P1) Na migration on the outer surface of BlueP (MS2/BlueP/Na); (P2) Na migration through the interlayer of heterostructures (MS2/Na/BlueP); (P3) Na migration on the outer surface of MS2 (Na/MS2/BlueP). As illustrated in Figs. 3b and c, with Na initially adsorbs at valley or hole position, the migration pathways could be categorized as: (1) Valley (V1) to adjacent valley site (V2) across a hole site (H) saddle point (V1 → H → V2); (2) Hole (H1) to neighboring hole site (H2) via valley (V) intermediate (H1 → V → H2). The representative Na diffusion barrier profiles for H(T)-TiS2/BlueP heterostructures are shown in Fig. 3d (Fig. 3e), and the others were shown in Fig. S5 (Supporting information).
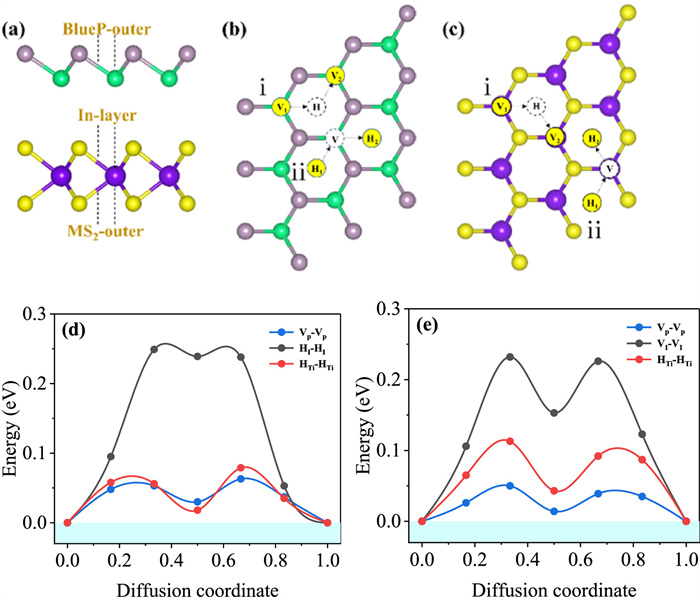
For all Na diffusion pathways on BlueP outer surface, double-peaked topology with a local minimum at intermediate site were observed. Their barrier heights span in the range of 0.04–0.08 eV, lower that of original blue phosphorene (0.11 eV) [43,44], and basically the same as other BlueP based heterostructures [46,49]. The highest diffusion barrier of each MS2/BlueP heterostructure appears at interlayer due to synergistic interaction with BlueP and MS2, and which also display double-peaked topology. The evidently increased barrier heights on interlayer would result in reduced Na migration speed. Nevertheless, except for T-MoS2/BlueP, the interlayer Na migration barriers still evidently lower than that of other blue phosphorus heterojunctions, such as C3N/Na/P (0.36 eV) [48], BLK-P/Li/BLE-P (0.87 eV) [50], BlueP/Li/G (0.30 eV) [45] and BP/Li/borophene (0.28 eV) [75] heterostructures. As shown in Fig. S5f, the Na diffusion path on outer surface of T-MoS2 is in single-peaked pattern and which is much higher than corresponding BlueP pathway. On the other hand, as listed in Table 1, the diffusion barriers on the rest MS2 outer surfaces (~0.10 eV) usually slightly larger than BlueP pathway, however, they are lower than those of the corresponding monolayer TiS2 (0.22 eV), VS2 (0.10 eV) and MoS2 (0.15 eV) [40,76]. It is worth noting that the calculated minimum diffusion energy barriers (BlueP outer surface) is much lower than that of most two-dimensional materials, such as C3N/Graphene (Li at 0.28 eV) [77], G/Bi (Na at 0.30 eV) [78], 1T-PS2 (Na at 0.16 eV) [79], and MgSiP2 (Na at 0.16 eV) [80]. Based on the low diffusion barriers for Na cation, the MS2/BlueP heterostructures were expected to exhibit excellent rate capability when used as anodes for sodium-ion batteries.
 DownLoad:
CSV
DownLoad:
CSV
| System | BlueP-outer (eV) | In-layer (eV) | MS2-outer (eV) |
| H-TiS2/BlueP | 0.06 | 0.25 | 0.08 |
| T-TiS2/BlueP | 0.05 | 0.23 | 0.11 |
| H-VS2/BlueP | 0.05 | 0.27 | 0.09 |
| T-VS2/BlueP | 0.04 | 0.17 | 0.09 |
| H-NbS2/BlueP | 0.06 | 0.26 | 0.09 |
| T—NbS2/BlueP | 0.08 | 0.25 | 0.10 |
| H-MoS2/BlueP | 0.05 | 0.18 | 0.09 |
| T-MoS2/BlueP | 0.06 | 0.45 | 0.38 |
Storage capacity and average working voltage are key parameters for evaluating the energy densities of SIBs with MS2/BlueP as anodes. The sodiation process upon battery charging was simulated by stepwise Na doping at most stable sites on surfaces of heterostructures via layer pattern and thus obtaining the maximal adsorption capacity of sodium ions. The layer dependent adsorption energy was given by [81]:
|
|
(4) |
where
During sequential doping of sodium atoms, we observe a switching of surface selectivity between MS2 outer surface and interlayer according to Eq. 4, except for H-MoS2/BlueP, which is similar with Li adsorption on blue phosphorene/NbS2(TaS2) heterostructures [52]. An example of 1, 2, 3, and 9 Na atoms adsorbing on the BlueP layer, T-TiS2 outer layer, and the intermediate layer of T-TiS2/BlueP heterostructure was conducted and the Eads values were listed in Table S5 (Supporting information). Upon adsorbing 3 sodium atoms, the adsorption energy of the T-TiS2 outer layer (−1.15 eV) surpassed that of the intermediate layer (−1.48 eV), meanwhile the BlueP outer layer always remained as least favored. In addition, as the number of adsorbed sodium ions increases, the interlayer spacing gradually expanded and eventually evolved to stable values. Therefore, the first packing layer of sodium atoms on MS2/BlueP heterostructures would be interlayer, in agreement with the Na intercalation to the BC2N/BlueP [49] and Li doping on VS2/BlueP [51]. Subsequently, sodium atoms would be adsorbed onto the VM (HM) site of the MS2 outer surface, followed by the formation of the third layer at the HM (VM) site of the MS2 outer layer. Next, the fourth or the fifth layer sodium atoms occupying the VP or HP sites of the BlueP outer surface. As presented in Table S6 (Supporting information), the calculated Na layer adsorption energies for each heterostructure decreased progressively with increasing sodium concentration. The maximum Na adsorption concentrations are H(T)-NbS2/BlueP@Na36 and T-TiS2/BlueP@Na36 with four layers, H-TiS2/BleuP@Na27 and H-MoS2/BlueP@Na27 for three layers and H(T)-VS2/BlueP@Na18 and T-MoS2/BlueP@Na18 for two layers. As shown in Table S7 (Supporting information), along with embedding the first sodium layer in between MS2 and BlueP, the interlayer spacing of the heterostructures re-optimized. The increased interlayer spacing enable accommodation more inserted sodium ions and reduces the repulsion between ions, thereby enhancing the overall adsorption stability. With more layers of sodium ions embedded on outer surface of MS2 and BlueP, the interlayer spacing remains essentially unchanged. The volume expansion rate of the studied heterostructures distributed in the range of 38%−62%, which are much smaller than MoP2 (118% for Na2MoP2, 176% for K1.81MoP2) [82]. Moreover, throughout the sodium-ion intercalation process, no structural rearrangements and phase transitions were observed for these heterostructures when adsorption energies were negative, implying their robust structural stability.
To obtain a deeper insight on binding characteristics between Na cations and substrates upon multi-layer Na adsorption, we performed electron localization function (ELF) analyzation for the T-TiS2/BlueP@Na36 and H(T)-NbS2/BlueP@Na36 in the (110) direction and displayed in Fig. S7 (Supporting information). Typically, ELF values distributed in 0.0–1.0 region, with 1.0 stands for localization and 0.5 represents delocalization limit cases of electrons, while 0.0 corresponding to very low charge density. As shown in Fig. S7, the valence electrons of Na atoms in the interlayer Na sheet are fully ionized and spread toward neighboring phosphorus and sulfur atoms to form negative electron clouds (NECs), which also suggesting the ionic bond nature of the Na-S and Na-P bonds [83-85]. Additionally, these NECs could shield the repulsion between Na cations and thus strongly stabilizing the interlayer Na sheet as the most favored. NECs also appear in between the top Na sheet and BlueP outer surface and implying that top Na layer were effectively absorbed. However, rather high density of localized electrons distributed on outer side of top Na sheet, which would prevent further Na doping for the second layer. For the two Na layers adsorbed on the bottom surface of MS2, the interstices were filled by diffused NECs, suggesting stable accumulation of the second Na layer. Furthermore, low density localized electron on outer side of second Na layer indicating the third layer Na doping would be unstable.
The reversible sodiation process of MS2/BlueP anode can be expressed as following half-battery reaction versus Na0/Na+:
|
|
(5) |
Based on the energy difference before and after reaction and ignore the volume change and entropy effects, the open-circuit voltage (OCV) of the battery can be calculated according to the following formula [86]:
|
|
(6) |
where
|
|
(7) |
where Xmax is the maximum concentration of intercalated Na ions, MHetero is the molar weight of the heterostructure, and F is the Faraday constant (26,801.5 mAh/g). According to the definition of OCV, when its value changes to negative along with increasing Na concentration, the Na adsorption becomes thermodynamically unfavored and formation of Na clusters and dendrites would take place [27].
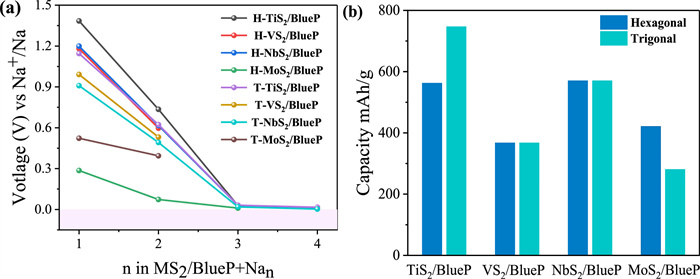
The evolution of OCV values during the stepwise sodiation process is shown in Fig. 4a and corresponding average OCV values listed in Table S6 (Supporting information) distributed in 0.12–0.89 V region. The average OCV values obtained for H—NbS2/BlueP, T-NbS2/BlueP, and T-TiS2/BlueP, with a maximum adsorption capacity of four Na layers, are 0.46, 0.36, and 0.45 V, respectively. These values fall within the optimal voltage range of 0.1–1.0 V for anode materials, which is advantageous for attaining high energy density in batteries. As depicted in Fig. 4b, H(T)-NbS2/BlueP and T-TiS2/BlueP heterostructures possess the highest Na accumulation concentrations of up to 36 Na ions, rendering theoretical capacities of 570.2 and 746.7 mAh/g, respectively. The H-TiS2/BlueP and H-MoS2/BlueP absorbing three layers of Na ions yield to theoretical capacities of 562.3 and 420.9 mAh/g, respectively and relative lower capacities is obtained for H(T)-VS2/BlueP (367.1 mAh/g) and T-MoS2/BlueP (280.6 mAh/g). The theoretical capacity of T-TiS2/BlueP is comparable to BC2N/BlueP (763.0 mAh/g), and better than those of G/Pn (580.0 mAh/g) [88], BN/BlueP (541.0 mAh/g) [89], Graphene/BlueP (403.7 mAh/g) [90], h-BN/Pn (445.0 mAh/g) [63], VSi2P4 (696.0 mAh/g) [91], TiCl2 (451.3 mAh/g) [92].
In summary, we have presented an extensive investigation on the electrochemical performance of MS2/BlueP (M = Ti, V, Nb, and Mo) heterostructures as potential anode materials for sodium-ion batteries by utilizing first-principles calculations. The computed results reveal that all the simulated heterostructures exhibit enhanced structural and thermodynamic stabilities as well as improved Na binding affinity compared to corresponding pristine MS2 and BlueP. Furthermore, stable Na adsorption with rapid mobility and substantial theoretical capacity is observed within these heterostructures. The T-TiS2/BlueP, T-MoS2/BlueP, H(T)-VS2/BlueP, and H(T)-NbS2/BlueP heterostructures exhibit metallic characteristics, while H-TiS2/BlueP and H-MoS2/BlueP undergo a semiconductor to metallic transition accompanied by Na intercalation, resulting in improved electrical conductivity. These improvements in mechanical stability and adsorption energy are of vital importance in inhibiting anode pulverization during the entire sodium intercalation-deintercalation process. Additionally, the relatively low Na diffusion barriers within these heterostructures imply high migration rates and rapid charge-discharge capabilities. Due to synergistic effects, these heterostructures demonstrate excellent Na storage capabilities, and NbS2/BlueP and T-TiS2/BlueP, which could absorb up to four layers of Na show best theoretical capacities of 570.2 and 746.7 mAh/g, respectively. Moreover, H(T)-NbS2/BlueP and T-TiS2/BlueP exhibit OCV values of 0.46(0.36) and 0.45 V, ensuring the safety of battery utilization. Based on above mentioned encouraging electrochemical properties, T-TiS2/BlueP and NbS2/BlueP heterostructures would be suitable anode materials for high-performance SIBs.
The authors declare that they have no known competing financial interests or personal relationships that could have appeared to influence the work reported in this paper.
Qiangqiang Zhou: Writing – original draft, Methodology, Investigation. Lili Sun: Formal analysis, Conceptualization. Yu-Jie Guo: Resources, Formal analysis. Bo Zhou: Resources, Formal analysis. Chunfang Zhang: Data curation. Sen Xin: Writing – review & editing, Visualization, Validation. Le Yu: Writing – review & editing, Validation, Resources, Funding acquisition, Conceptualization. Gaohong Zhai: Writing – review & editing, Supervision, Conceptualization.
This work is supported by the Fund of Education Department of Shaanxi Provincial Government (No. 23JP172) and the National Natural Science Foundation of China (No. 22309189). Sen Xin acknowledges the financial support from Xiaomi Young Talents Program.
Supplementary material associated with this article can be found, in the online version, at doi:
H.H. Ryu, H.W. Lim, S.G. Lee, Y.K. Sun, Nat. Energy 9 (2024) 47–56.
X.B. Jia, J. Wang, Y.F. Liu, et al., Adv. Mater. 36 (2024) e2307938.
Z. Zhao, H.N. Alshareef, Adv. Mater. 35 (2023) e2309223.
Y. Liu, C. Wang, S.G. Yoon, et al., Nat. Commun. 14 (2023) 3975.
J. Zhang, X. Wang, H. Li, et al., Adv. Funct. Mater. 33 (2023) 2301974.
X. Cheng, C. Tang, C. Yan, et al., Mater. Today Nano 22 (2023) 100321.
H.J. Liang, H.H. Liu, J.Z. Guo, et al., Energy Storage Mater. 66 (2024) 103230.
S. Gao, Z. Zhu, H. Fang, et al., Adv. Mater. 36 (2024) e2311523.
X. Zhou, Y. Huang, B. Wen, et al., Proc. Natl. Acad. Sci. U. S. A. 121 (2024) e2316914121.
Y. Su, B. Johannessen, S. Zhang, et al., Adv. Mater. 35 (2023) e2305149.
X. Yin, T. Liu, X. Yin, et al., Chin. Chem. Lett. 34 (2023) 107840.
Y. Tong, Y. Wu, Z. Liu, et al., Chin. Chem. Lett. 34 (2023) 107443.
Y. He, C. Liu, Z. Xie, et al., Adv. Compos. Mater. 6 (2023) 85.
T. Zheng, P. Hu, Z. Wang, T. Guo, Adv. Mater. 35 (2023) e2306577.
X. Yue, B. Qiao, J. Wang, et al., Renew. Sust. Energ. Rev. 185 (2023) 113592.
J. Rehman, S. Lin, M.K. Butt, et al., Chem. Eng. J. 461 (2023) 141924.
Z.Y. Gu, J.M. Cao, J.Z. Guo, et al., J. Am. Chem. Soc. 146 (2024) 4652–4664. doi: 10.1021/jacs.3c11739
T. Zhang, M. Ren, Y. Huang, et al., Angew. Chem. Int. Ed. 63 (2024) e202316949.
Y. Bahari, B. Mortazavi, A. Rajabpour, et al., Energy Storage Mater. 35 (2021) 203–282.
C. Zhang, H. Pan, L. Sun, et al., Energy Storage Mater. 38 (2021) 354–378.
D.G. Ladha, Mater. Today Chem. 11 (2019) 94–111.
F. Nazneen, P. Mondal, N. Ahnaf Shahed, et al., Comput. Theor. Chem. 1224 (2023) 114105.
M. Bahrami, F. Shayeganfar, K. Mirabbaszadeh, A. Ramazani, Acta Mater. 239 (2022) 118292.
X. Tang, X. Guo, W. Wu, G. Wang, Adv. Energy Mater. 8 (2018) 1801897.
O. Folorunso, N. Kumar, Y. Hamam, et al., FlatChem 29 (2021) 100281.
J. Tang, X. Peng, T. Lin, et al., eScience 1 (2021) 203–211.
E. Yang, H. Ji, J. Kim, et al., Phys. Chem. Chem. Phys. 17 (2015) 5000–5005.
C. Eames, M.S. Islam, J. Am. Chem. Soc. 136 (2014) 16270–16276. doi: 10.1021/ja508154e
Y. Tao, T. Huang, C. Ding, et al., Appl. Mater. Today 15 (2019) 18–33.
W. Yang, Y. Lu, C. Zhao, H. Liu, Electron. Mater. Lett. 16 (2020) 89–98. doi: 10.1007/s13391-019-00178-z
M. Ma, Y. Yao, Y. Wu, Y. Yu, Adv. Fiber Mater. 2 (2020) 314–337. doi: 10.1007/s42765-020-00052-w
F. Xue, F. Fan, Z. Zhu, et al., Nanoscale 15 (2023) 6822–6829. doi: 10.1039/d3nr00866e
S. Wang, C. Qu, J. Wen, et al., Mater. Chem. Front. 7 (2023) 2779–2808. doi: 10.1039/d2qm01200f
L. Zhang, H. Dong, C. Lv, et al., Inorg. Chem. Front. 10 (2023) 2607–2617. doi: 10.1039/d3qi00308f
Q. Ji, C. Li, J. Wang, et al., Nano Lett. 17 (2017) 4908–4916. doi: 10.1021/acs.nanolett.7b01914
X. Ou, X. Xiong, F. Zheng, et al., J. Power Sources 325 (2016) 410–416.
W. Ye, F. Wu, N. Shi, et al., Small 16 (2020) 1906607.
D. Wang, Y. Liu, X. Meng, et al., J. Mater. Chem. A 5 (2017) 21370–21377.
A.S. de Rezende Neto, L. Seixas, Int. J. Quantum Chem. 121 (2021) e26603.
E. Yang, H. Ji, Y. Jung, J. Phys. Chem. C 119 (2015) 26374–26380. doi: 10.1021/acs.jpcc.5b09935
Z. Zhu, D. Tomanek, Phys. Rev. Lett. 112 (2014) 176802. doi: 10.1103/PhysRevLett.112.176802
J.L. Zhang, S. Zhao, C. Han, et al., Nano Lett. 16 (2016) 4903–4908. doi: 10.1021/acs.nanolett.6b01459
S. Mukherjee, L. Kavalsky, C.V. Singh, ACS Appl. Mater. Interfaces 10 (2018) 8630–8639. doi: 10.1021/acsami.7b18595
G. Barik, S. Pal, J. Phys. Chem. C 123 (2019) 2808–2819. doi: 10.1021/acs.jpcc.8b11512
Y. Li, W. Wu, F. Ma, J. Mater. Chem. A 7 (2019) 611–620. doi: 10.1039/c8ta09423c
J. Bao, L. Zhu, H. Wang, et al., J. Phys. Chem. C 122 (2018) 23329–23335. doi: 10.1021/acs.jpcc.8b07062
H. Lin, R. Jin, S. Zhu, Y. Huang, Appl. Surf. Sci. 505 (2020) 144518.
J. Bao, H. Li, Q. Duan, et al., Solid State Ionics 345 (2020) 115160.
Z. Mansouri, A. Al-Shami, A. Sibari, et al., Phys. Chem. Chem. Phys. 25 (2023) 3160–3174. doi: 10.1039/d2cp04104a
N. Muhammad, M.U. Muzaffar, Z.J. Ding, Phys. Chem. Chem. Phys. 23 (2021) 17392–17401. doi: 10.1039/d1cp01509e
H. Lin, X. Jin, N. Lou, et al., Appl. Surf. Sci. 533 (2020) 147478.
Q. Peng, Z. Wang, B. Sa, et al., ACS Appl. Mater. Interfaces 8 (2016) 13449–13457. doi: 10.1021/acsami.6b03368
F. Yang, J. Han, L. Zhang, et al., Nanotechnology 31 (2020) 375706. doi: 10.1088/1361-6528/ab978b
G. Kresse, J. Furthmuller, Phys. Rev. B 54 (1996) 11169–11186.
G. Kresse, D. Joubert, Phys. Rev. B 59 (1999) 1758–1775.
J.P. Perdew, K. Burke, M. Ernzerhof, Phys. Rev. Lett. 77 (1996) 3865–3868.
J. Paier, R. Hirschl, M. Marsman, G. Kresse, J. Chem. Phys. 122 (2005) 234102.
S. Grimme, J. Antony, S. Ehrlich, H. Krieg, J. Chem. Phys. 132 (2010) 154104.
G. Henkelman, B.P. Uberuaga, H. Jónsson, J. Chem. Phys. 113 (2000) 9901–9904.
G. Henkelman, H. Jónsson, J. Chem. Phys. 113 (2000) 9978–9985.
G.J. Martyna, M.L. Klein, M. Tuckerman, J. Chem. Phys. 97 (1992) 2635–2643.
J. Su, W. Li, T. Duan, et al., Carbon 153 (2019) 767–775.
C. Chowdhury, S. Karmakar, A. Datta, ACS Energy Lett. 1 (2016) 253–259. doi: 10.1021/acsenergylett.6b00164
H. Wang, Z. Qiu, W. Xia, et al., J. Phys. Chem. Lett. 10 (2019) 6996–7001. doi: 10.1021/acs.jpclett.9b02710
Y.Y. Cui, W. Fan, X. Liu, et al., Comput. Mater. Sci. 200 (2021) 110767.
J.A. Wilson, A.D. Yoffe, Adv. Phys. 18 (1969) 193–335. doi: 10.1080/00018736900101307
J. Xiao, J. Wang, Z. Xue, et al., Int. J. Energy Res. 45 (2021) 13748–13759. doi: 10.1002/er.6703
R. Zhao, C. Wan, P. Qian, X. Ju, Surf. Interfaces 38 (2023) 102851.
V. Wang, N. Xu, J. -C. Liu, et al., Comput. Phys. Commun. 267 (2021) 108033.
M. Born, K. Huang, M. Lax, Am. J. Phys. 23 (1955) 474 -474. doi: 10.1119/1.1934059
B. Ghosh, S. Nahas, S. Bhowmick, A. Agarwal, Phys. Rev. B 91 (2015) 115433. doi: 10.1103/PhysRevB.91.115433
C. Tang, M. Zhang, K. Zhang, J. Gong, Appl. Surf. Sci. 564 (2021) 150468.
R.T. Poole, Am. J. Phys. 48 (1980) 536–538. doi: 10.1119/1.12056
X.M. Zhang, L. Jin, X.F. Dai, et al., Appl. Surf. Sci. 527 (2020) 146849.
Q. Li, J. Yang, L. Zhang, J. Phys. Chem. C 122 (2018) 18294–18303. doi: 10.1021/acs.jpcc.8b05076
M. Salavati, T. Rabczuk, Comput. Mater. Sci. 160 (2019) 360–367.
Y.R. Wang, Z.Y. Jiao, S.H. Ma, Y.L. Guo, J. Power Sources 413 (2019) 117–124. doi: 10.2112/si98-029.1
M. Ai, J.P. Sun, Z. Li, et al., J. Phys. Chem. C 125 (2021) 11391–11401. doi: 10.1021/acs.jpcc.1c02373
D. Zhou, C. Li, F. Yin, et al., Chin. Chem. Lett. 31 (2020) 2325–2329.
C. Pu, J. Yu, L. Fu, et al., Chin. Chem. Lett. 32 (2021) 1081–1085.
J. Liu, C.S. Liu, X.J. Ye, X.H. Yan, J. Mater. Chem. A 6 (2018) 3634–3641. doi: 10.1039/c7ta10248h
J. Jin, U. Schwingenschlögl, npj 2D Mater. Appl. 8 (2024) 31. doi: 10.1038/s41699-024-00453-0
T. Yu, Z. Zhao, L. Liu, et al., J. Am. Chem. Soc. 140 (2018) 5962–5968.
Y.M. Ma, M. Eremets, A.R. Oganov, et al., Nature 458 (2009) 182–185. doi: 10.1038/nature07786
M.S. Miao, R. Hoffmann, J. Am. Chem. Soc. 137 (2015) 3631–3637. doi: 10.1021/jacs.5b00242
C. Chen, S. Guo, S. Gao, et al., Colloids Surf. A: Physicochem. Eng. Asp. 662 (2023) 131037.
D. Chodvadiya, U. Jha, P. Spiewak, et al., Appl. Surf. Sci. 593 (2022) 153424.
V.V. Kulish, O.I. Malyi, C. Persson, P. Wu, Phys. Chem. Chem. Phys. 17 (2015) 13921–13928.
J.N. Bao, L.S.W. Zhu, H.C. Wang, et al., J. Phys. Chem. C 122 (2018) 23329–23335. doi: 10.1021/acs.jpcc.8b07062
K.M. Fan, T. Tang, S.Y. Wu, Z.Y. Zhang, Int. J. Mod. Phys. B 32 (2018) 1850010.
Y. Liu, Y. Ji, Y.M. Ding, et al., 2D Mater. 10 (2023) 025020. doi: 10.1088/2053-1583/acc341
H.Y. Zhu, X.J. Ye, L. Meng, et al., Phys. Chem. Chem. Phys. 25 (2023) 11513–11521. doi: 10.1039/d3cp00172e

Figure 1 Side and top views of H(T)-MS2/BlueP (M = Ti, V, Nb and Mo) heterostructures with three stacking pattern: (a, d) mode i, (b, e) mode ii, and (c, f) mode iii.

Figure 2 Adsorption properties of sodium on MS2/BlueP. Side views of adsorption sites in the (a) H-MS2/BlueP and (c) T-MS2/BlueP heterostructures. The adsorption energy of Na in the (b) BlueP, H-MS2, H-MS2/BlueP heterostructures and (d) BlueP, T-MS2, T-MS2/BlueP heterostructures.

Figure 3 (a) Different stable adsorption sites of Na in the MS2/BlueP heterostructures. Distinct migration pathways of Na on the (b) BlueP outer surface and (c) interlayer and MS2 outer surface. The energy profiles along Na diffusion pathways on (d) H-TiS2/BlueP and (e) T-TiS2/BlueP. The blue, black and red curves represent diffusion toward BlueP outer surface, interlayer of MS2/BlueP, and MS2 outer surface, respectively.

Figure 4 (a) Open-circuit voltage evolution and (b) maximum theoretical capacity upon sodium intercalation process in MS2/BlueP (M = Ti, V, Nb and Mo) heterostructures.
Table 1. Migration barriers of three diffusion paths for the most stable sodium adsorption site of MS2/BlueP heterostructures.
| System | BlueP-outer (eV) | In-layer (eV) | MS2-outer (eV) |
| H-TiS2/BlueP | 0.06 | 0.25 | 0.08 |
| T-TiS2/BlueP | 0.05 | 0.23 | 0.11 |
| H-VS2/BlueP | 0.05 | 0.27 | 0.09 |
| T-VS2/BlueP | 0.04 | 0.17 | 0.09 |
| H-NbS2/BlueP | 0.06 | 0.26 | 0.09 |
| T—NbS2/BlueP | 0.08 | 0.25 | 0.10 |
| H-MoS2/BlueP | 0.05 | 0.18 | 0.09 |
| T-MoS2/BlueP | 0.06 | 0.45 | 0.38 |
 下载: 导出CSV

 扫一扫看文章

扫一扫关注我们
 下载:
下载: