Figure 1.
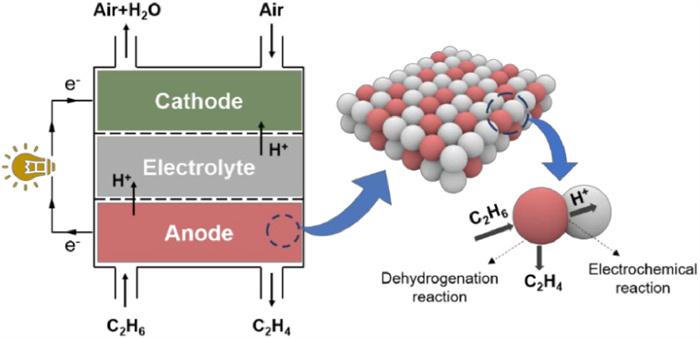
The Schematic diagram of P-SOFC for co-generation of power and ethylene.
A proton-conducting solid oxide fuel cell for co-production of ethylene and power via ethane conversion
Jun Luo , Yanya Liu , Jianghuaxiong Zhu , Chengxiong Wang , Yunkun Zhao , Dong Yan , Jian Li , Lichao Jia

Solid oxide fuel cell (SOFC) is a high-efficiency and low-emission energy conversion device with many applications [1-4], such as generating electricity electrochemically using all kinds of fuels like hydrogen, hydrocarbons [5,6], liquid oils [7,8], syngas [9], solid carbon [10,11], and ammonia [12], etc. It also can be regarded as a reactor producing alkene (CnHm-2) from alkane (CnHm) by catalytic dehydrogenation according to the reaction of
|
|
(1) |
when the SOFC uses a proton-conducting electrolyte, i.e., proton-conducting solid oxide fuel cell (P-SOFC), for power generation with the produced hydrogen (H2), as schematically depicted in Fig. 1.
Ethane (C2H6) is a chemical abundantly present in natural and liquefied petroleum gases with limited economic value; however, differing by two hydrogen atoms, ethylene (C2H4) is a core raw material for the petrochemical industry, accounting for approximately 75% of the global output. Therefore, it is of economic and environmental significance to use C2H6 as the fuel and P-SOFC as the reactor to generate electricity and produce C2H4 simultaneously (co-production of C2H4 and power). As shown in Fig. 1, C2H6 dehydrogenates catalytically on the anode, forming C2H4 and H2. The high-value C2H4 goes to the anode exit for collection, and the H2 is selectively oxidized electrochemically, yielding protons (H+) transporting across the proton-conducting electrolyte to the cathode for H2O formation and electrons (e−) passing through the external circuit to the cathode to reduce oxygen (O2). Compared to the traditional C2H6 steam cracking process for C2H4 production [13], the co-production approach offers the following benefits: (1) There are no formed carbon dioxide (CO2) and other byproducts, resulting in high selectivity of C2H4; (2) The produced H2 generates electricity via a P-SOFC, achieving high energy conversion efficiency; (3) H2 consumption promotes Eq. 1 in the forward direction, increasing the rate of C2H6 conversion to C2H4.
The concept of co-production has been realized previously with unsatisfied performance due to the use of thick electrolyte and conventional Ni-cermet anode in the electrolyte-supported P-SOFCs [14-20]. The thick electrolyte contributes a significant portion of the ohmic resistance of the cell; the large-sized Ni particles in the Ni-cermets directly crack C2H6 [21-25], leading to low C2H4 selectivity with carbon deposition in the anode. Therefore, in the present study, an anode-supported cell structure with a thin electrolyte was adopted to reduce the ohmic resistance of the cell. As to the anode materials other than the Ni-cermets, some kinds of oxide catalysts with a mild capability of breaking C–C bonds can be the choices, such as those with fluorite [26], perovskite [27,28], pyrochlore [29], and tungsten bronze [30] structures.
Perovskite oxides have attracted extensive attention in the catalysis field, as they possess mixing ion and electron conductivity (MIEC), and their catalytic performance can be enhanced by composition modifications. Some have demonstrated alkane dehydrogenation properties [31-36], and some have been employed as SOFC anodes [37-44]. For the co-production P-SOFCs, the anode materials require dual-functionality: (1) Catalyzing C2H6 dehydrogenation to produce C2H4 and H2; (2) Selectively and electrochemically oxidizing H2 for power generation. (PrBa)0.95Fe1.8Mo0.2O6-δ (PBFM) has been reported to be an excellent ceramic anode material of SOFCs with stable structure, satisfied electrical conductivity and electrochemical activity, strong resistance to carbon deposition, and high tolerance to sulfur poisoning in SOFC environments [42,43]. Therefore, it is modified in this study by Ni doping ((PrBa)0.95(Fe1-xNix)1.8Mo0.2O6-δ, PBFNMx, x = 0, 0.1, 0.2, 0.3)) with the expectation that Fe-Ni alloy nanoparticles may exsolve from PBFNMx in the reducing anode atmosphere and the resulted heterogeneous anode demonstrates the required dual-functionality [45,46]. Such fine nanoparticles are more favorable for dehydrogenation reaction, rather than large-sized particles that are more inclined to undergo cracking reactions. Furthermore, the anode was constructed in the form of a BZCY scaffold impregnated with PBFNMx to increase the triple-phase boundary of the anode with enhanced proton conductivity and avoid the high-temperature reaction between PBFNMx and the electrolyte to be used (BaZr0.1Ce0.7Y0.2O3, BZCY) during cell preparation [47,48].
Fig. 2 shows the physical characterizations, catalytic activity, and electrochemical performance of prepared PBFNMx. They consisted of a primary phase in perovskite structure (PDF#04–006–4328) and a minor phase of BaMoO4 (PDF#01–071–4908); an additional phase of NiO (PDF#01–071–1179) appeared in PBFNM0.3 (Fig. 2a). The presence of BaMoO4 is because Mo prefers to maintain a high oxidation state of +6 under oxidizing atmosphere [43], making it difficult to incorporate into the perovskite lattice, similar to the SrMoO4 impurity phase in Sr2Fe1.5Mo0.5O6-δ [40,49]. The peak intensity of BaMoO4 decreased when Ni partially replaced Fe, as a result of that Ni2+ substitution for Fe3+ promotes Mo6+ incorporation into perovskite lattice for charge compensation, as confirmed by Mo 3d XPS spectra of prepared PBFNMx (Fig. S1 in Supporting information). The gradual peak shift to the left suggests that the ratio for Mo5+ (~231.6 eV)/Mo6+ (~232.2 eV) increases continuously with increasing Ni content. The appearance of the NiO phase indicates that the concentration of Ni of PBFNM0.3 exceeds the solubility of Ni in PBFNMx. After a reduction in H2 at 800 ℃ for 2 h (Fig. 2b), the primary phase remained in perovskite structure, and the amount of FeNi3 metallic phase (PDF#99–000–0225) became more with the increase in Ni content; in the meantime, BaMoO4 dissolved gradually into the primary phase. Secondary phases of BaFeO3 (PDF#00–020–0129) and BaNiO3 (PDF#01–073–6360) emerged in the reduced PBFNM0.3, indicating that excessive formation of FeNi3 caused partial dissociation of the primary phase. It is noted that only PBFNM0.2 contained two phases of the perovskite matrix and FeNi3 precipitates, possibly due to that FeNi3 formation created cation vacancies that facilitate the reduction of Mo6+ to Mo5+ or Mo4+, as demonstrated by the Mo3d XPS profile (Fig. S2 in Supporting information) showing that the amounts of Mo5+ and Mo4+ increased in reduced PBFNM0.2. The conductivity of all PBFNMx in H2 increased with increasing temperature from 400 ℃ to 750 ℃ (Fig. 2c), presenting a semiconductor nature of conduction, and with the increase in Ni content possibly due to the formation of electron holes such as FeFe· or MoMo· promoted by Ni substitution for Fe. This charge balance mechanism can also be recognized from the following Eq. 2:
|
|
(2) |
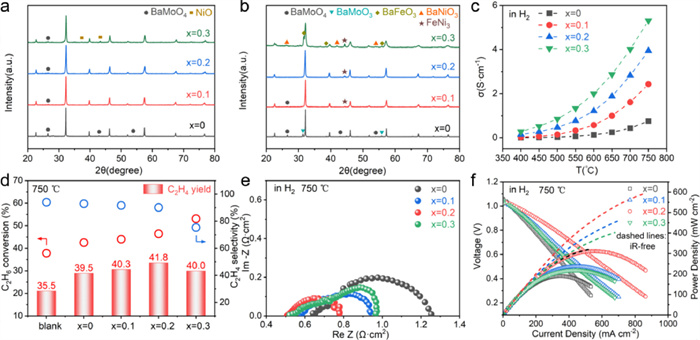
Compared to the blank test (Fig. 2d), PBFNM0 exhibited a 4% increase in C2H4 yield, which may be attributed to the presence of the redox pairs of Fe3+/Fe2+ and Mo6+/Mo5+ (Fig. S3 in Supporting information) [50-54] increasing Ni content in PBFNMx monotonously increased C2H6 conversion due to the formation of more FeNi3 nanoparticles that catalyze C2H6 dehydrogenation in a similar way to Pt [55-60], as illustrated in Fig. S4 (Supporting information). However, the transition metal alloy particles are also active in breaking C–C bonds, resulting in a decrease in C2H4 selectivity and a maximum C2H4 yield of 41.8% at x = 0.2. Another possibility for the decrease of C2H4 selectivity with PBFNM0.3 is its partial decomposition in the reduced form (Fig. 2b), exposing more and larger FeNi3 particle surfaces out of the embedment into the matrix to C2H6 for C–C bond breaking rather than dehydrogenation [60-62].
The electrolyte-supported cells with 60 wt% PBFNMx-40 wt% BZCY anodes and the same 60 wt% LSCF-40 wt% BZCY cathode (Fig. S5 in Supporting information) demonstrated that with H2 fuel, the ohmic and polarization resistances reached a minimum of 0.51 and 0.27 Ω cm2, respectively (Fig. 2e). According to the measured conductivity shown in Fig. 2c, the ohmic resistance of the cell decreased with increasing the Ni content in PBFNMx; the ohmic resistance of the cell with PBFNM0.3 no longer decreases probably because the conductivity of the electrodes is already high enough to not have an effect on the total ohmic impedance. The tendency of the change of the polarization resistance is as expected, decreasing with Ni contents from 0 to 0.2 and increasing for 0.3 because of partial decomposition of the matrix in the reduced PBFNM0.3. The distribution of relaxation times (DRT) method is applied to analysis the impedance spectra, which decomposes the complicated impedance spectra into separate electrochemical processes (Fig. S6 in Supporting information). The DRT plots can be divided into low-frequency (LF), intermediate-frequency (IF), and high-frequency (HF) segments, corresponding to the adsorption and dissociation of hydrogen or oxygen on the electrode surface, charge transfer processes from the adsorbed state to the ionic state, and the transfer of H+ or O2− from the three-phase interface to the electrolyte, respectively. The impedance of the LF segment for the PBFNM0.2 electrode greatly decreased, indicating that the PBFNM0.2 anode material demonstrated the greatest adsorption and dissociation abilities. As a result, the cell with PBFNM0.2 in the anode showed the highest performance with maximum power density of 318 mW/cm2 at 750 ℃ (Fig. 2f). Without considering the cell's ohmic resistance, the iR-free power curves (dashed lines in Fig. 2f) indicate unambiguously that the cell with PBFNM0.2 in the anode possessed the highest electrochemical performance.
Based on the above physical/chemical characterizations and electrochemical performance evaluations, PBFNM0.2 was considered to have the optimal Ni content in PBFNMx and selected for the following in-depth characterizations and performance evaluations in an anode-supported cell (Fig. 3). The primary phase in the reduced PBFNM0.2 was in a double perovskite structure (94.6 wt%) belonging to a space group of P4/mmm with lattice parameters of a, b, and c equaling 3.927, 3.927, and 7.853 Å, respectively; and the FeNi3 metallic phase (5.4 wt%) belonging to a space group of Pm-3 m with lattice parameters of a = b = c = 3.562 Å, as confirmed by the Rietveld refinement (Fig. 3a). Nanoparticles around 20 nm on average were formed and uniformly dispersed on the double perovskite substrate (Fig. 3b). They were partially embedded in the substrate and contained Ni and Fe, showing a lattice spacing of 0.197 nm corresponding to the (111) plane of the FeNi3 intermetallic compound (Fig. 3c), in agreement with the XRD findings (Fig. 2b).
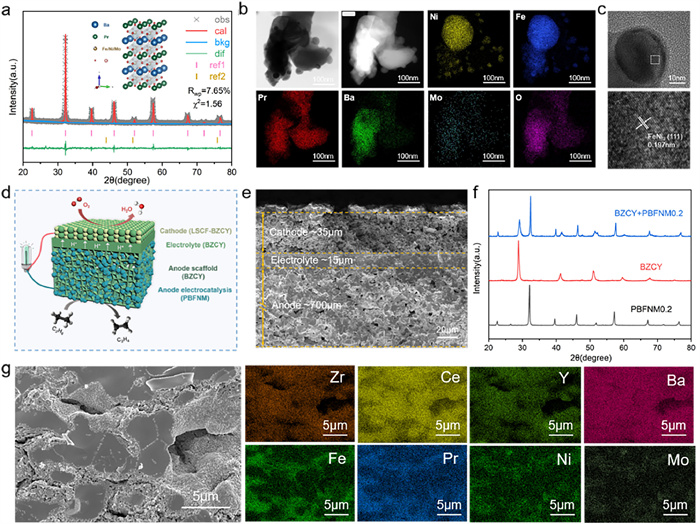
To reduce the ohmic resistance of the cell, an anode-supported cell structure (Fig. 3d) was adopted for the first time to evaluate the performance of PBFNM0.2 for C2H6 dehydrogenation and power generation. The dense BZCY electrolyte (~15 µm) and porous LSCF cathode (~35 µm) of the cell were built serially on the PBFNM0.2-impregnated BZCY anode (~700 µm) with well-bounded interfaces (Fig. 3e). PBFNM0.2 was chemically compatible with BZCY during cell preparation at 1100 ℃ in air for 2 h (Fig. 3f), and distinguishable distributions of individual elements in the EDS maps suggests that PBFNM0.2 uniformly dispersed on the surfaces of the BZCY scaffold (Fig. 3g). The cells with 10–40 wt% of impregnated PBFNM0.2 in the anode were evaluated first with H2 fuel, as shown in Fig. 4, to determine the ideal impregnation amount of PBFNM0.2. It is noted that the ohmic and polarization resistances of the cell decreased to the lowest of 0.35 and 0.18 Ω cm2 at 750 ℃, respectively, with 30 wt% PBFNM0.2 (Fig. 4a). That is because the connection between impregnated PBFNM0.2 particles was improved and the triple phase boundary increased with increasing the amount of PBFNM0.2 to 30 wt%; however, when the anode was overloaded with 40 wt% of PBFNM0.2 particles, the porosity of the anode was not sufficient (Fig. S7 in Supporting information), reducing the triple phase boundaries and possibly the amount of exsolved FeNi3 particles and the concentration of oxygen vacancy in the PBFNM0.2 matrix. As a result, the cell with 30 wt% PBFNM0.2 impregnated anode demonstrated the highest performance with a maximum power density of 508 mW/cm2 at 750 ℃ (Fig. 4b), which decreased to 335 mW/cm2 at 700 ℃ and 231 mW/cm2 at 650 ℃ (Fig. S8 in Supporting information).
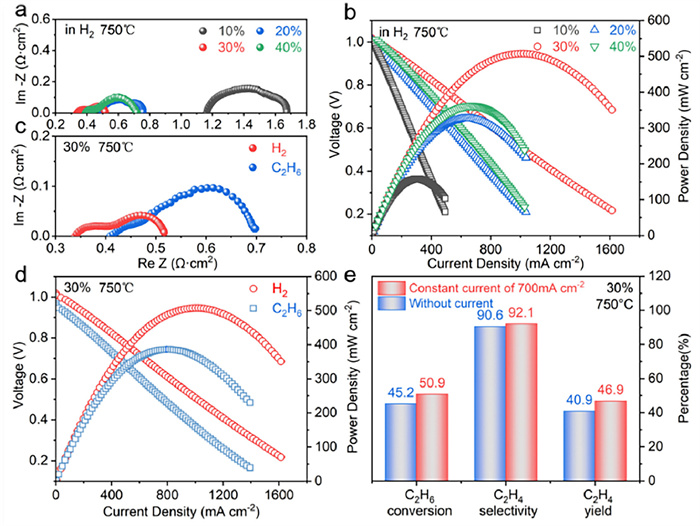
Being evaluated with H2, the cell with 30 wt% PBFNM0.2-impregnated anode was continuously operated with C2H6 at 750 ℃, as also shown in Fig. 4. Both ohmic and polarization resistances of the cell with C2H6 increased compared to that with H2 (Fig. 4c), which is attributed to the decreased H2 partial pressure in the anode, reducing the conductivity of BZCY [63-65] and slowing the kinetics of anode reactions. The lowered H2 partial pressure was indicated by the decreased open circuit voltage of the cell at 750 ℃, giving a maximum power density of 386 mW/cm2 (Fig. 4d), which outperforms all previously published electrolyte-supported cells [14-20]. At a constant current density of 700 mA/cm2 corresponding to the maximum power density, the C2H6 conversion, C2H4 selectivity, and C2H4 yield were 50.9%, 92.1%, and 46.9%, respectively, which increased accordingly from 45.2%, 90.6%, and 40.9% without applied current (Fig. 4e). According to the dehydrogenation reaction (Eq. 3), such an increase in conversion is ascribed to the transport of H2 in the form of protons from the anode to the cathode, crossing the BZCY electrolyte to generate power.
|
|
(3) |
|
|
(4) |
The increase in C2H4 selectivity may be because of the suppression of the side reaction of hydrogenation (Eq. 4) also due to H2 consumption for power generation. Therefore, the anode-supported cell with 30 wt% PBFNM0.2 impregnated anode successfully demonstrated the possibility of high-performance cogeneration of power and C2H4.
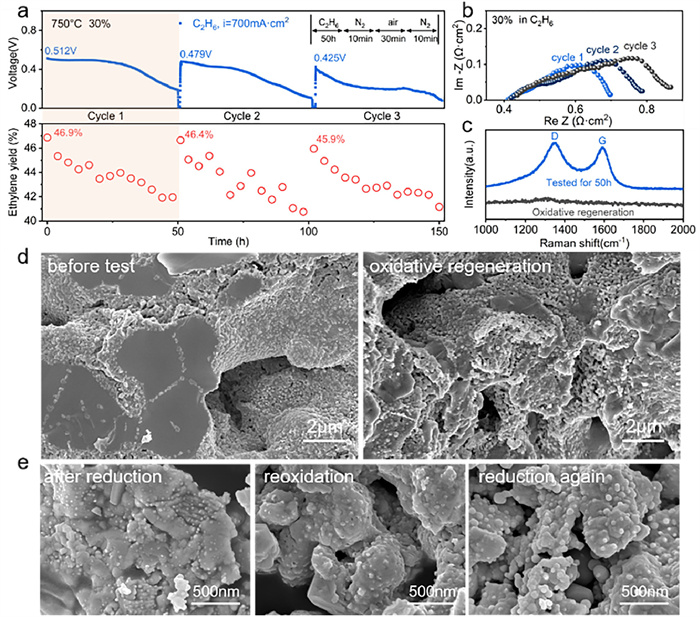
Following the initial performance evaluation, the cell with 30 wt% PBFNM0.2-impregnated anode was operated at 700 mA/cm2 and 750 ℃ with C2H6 to estimate performance durability and oxidative regeneration (Fig. 5). The cell voltage declined from 0.512 V to 0.215 V accompanied by a decrease of C2H4 yield from 46.9% to 42% within the first 50 h of testing; after oxidative regeneration in air for 30 min, the cell voltage and C2H4 yield recovered to 0.479 V and 46.4%, corresponding recovery of 93.6% and 98.9%, respectively; and corresponding recovery of 83% and 97.9% for the second oxidative regeneration (Fig. 5a). In the meantime, the cell polarization resistance increased from 0.3 Ω cm2 to 0.5 Ω cm2 after three cycles (Fig. 5b). The reasons for the performance declination are associated with carbon deposition and microstructure coarsening of the anode. It has been reported that the polymerization and cracking of C2H4 unavoidably occur as no O2− ions are transported from the cathode in P-SOFCs, deteriorating cell performance and C2H6 dehydrogenation [66,67]. A blank quartz tube was covered with deposited carbon after flowing C2H6 for 24 h at 750 ℃ (Fig. S9 in Supporting information). Deposited carbon was detected by Raman spectroscopy in the anode tested for 50 h with C2H6, and it was removed by the following oxidative regeneration, as evidenced by the appearance and disappearance of the carbon peaks D and G in the Raman profiles (Fig. 5c) and observation and characterizations of the tested cell (Fig. S10 in Supporting information). In fact, in the commercial process of light alkane dehydrogenation for olefin synthesis, the catalysts also need to undergo cycles of dehydrogenation and regeneration to prevent catalytic deactivation caused by carbon deposition [68-70]. It is noted above that the cell performance was not fully recovered by the oxidative regeneration process, which is ascribed to the agglomeration and coarsening of the impregnated PBFNM0.2 particles (Fig. 5d), which reduced the triple phase boundary of the anode. In addition, during the redox cycle of dehydrogenation-oxidative regeneration, the exsolved FeNi3 alloy particles were not re-dissolved back into the parent matrix after oxidation, and no phase structure change occurred after re-reduction, but the sharper peak shape implied larger particle size (Fig. S11 in Supporting information). The decrease in the number of exsolved particles and the increase in size from an average of 20 nm to 60 nm can be clearly seen in Fig. 5e, which lead to a decrease in the active site and also contributed to the performance degradation [71,72].
In conclusion, double perovskite catalysts (PrBa)0.95(Fe1-xNix)1.8Mo0.2O6-δ (PBFNMx, x from 0 to 0.3) were developed and studied for co-generation of electricity and C2H4 by C2H6 dehydrogenation in PBFNMx-impregnated BaZr0.1Ce0.7Y0.2O3 (BZCY) anodes of proton-conducting solid oxide fuel cells. Based on the experimental results, the following conclusions are drawn: (1) FeNi3 nanoparticles exsolve from PBFNMx in H2 and uniformly distribute on the double perovskite substrate, promoting C2H6 dehydrogenation and enhancing the electrochemical performance of the anode; (2) PBFNMx with a Ni content of 0.2 (PBFNM0.2) exhibits the highest C2H6 dehydrogenation activity and electrochemical performance; (3) The ideal impregnation amount of PBFNM0.2 in the anode is 30 wt%, resulting in the lowest impedance and highest power density of an anode-supported cell with increased C2H4 yield; (4) The cell performance degrades due to carbon deposition and FeNi3 particles coarsening and recovers significantly after oxidative regeneration.
The authors declare that they have no known competing financial interests or personal relationships that could have appeared to influence the work reported in this paper.
Jun Luo: Investigation, Methodology, Visualization, Writing – original draft. Yanya Liu: Formal analysis, Methodology, Validation. Jianghuaxiong Zhu: Data curation, Resources, Software. Chengxiong Wang: Formal analysis, Methodology. Yunkun Zhao: Project administration, Resources, Supervision. Dong Yan: Data curation, Funding acquisition, Methodology. Jian Li: Project administration, Supervision, Writing – review & editing. Lichao Jia: Conceptualization, Funding acquisition, Project administration, Supervision, Writing – review & editing.
This research was financially supported by the National Natural Science Foundation of China (Nos. 52072134, 52272205), Hubei Province (Nos. 2021BCA149, 2021CFA072, 2022BAA087), and the special fund for Science and Technology Innovation Teams of Shanxi Province (No. 202304051001007). The authors would like to thank Analytical and Testing Center of Huazhong University of Science and Technology for the XRD, Raman, and SEM/EDS characterizations, and SCI-GO (www.sci-go.com) for the XPS analysis and TEM characterizations.
Supplementary material associated with this article can be found, in the online version, at doi:
Y. Yin, H. Dai, S. Yu, et al., SusMat 2 (2022) 607–616. doi: 10.1002/sus2.79
Y. Chen, B. deGlee, Y. Tang, et al., Nat. Energy 3 (2018) 1042–1050.
P. Qiu, C. Li, B. Liu, et al., J. Adv. Ceram. 12 (2023) 1463–1510. doi: 10.26599/jac.2023.9220767
Y. Yin, D. Xiao, S. Wu, et al., SusMat 3 (2023) 697–708. doi: 10.1002/sus2.156
T. Hibino, A. Hashimoto, T. Inoue, et al., Science 288 (2000) 2031–2033.
Z. Zhan, S.A. Barnett, Science 308 (2005) 844–847. doi: 10.1126/science.1109213
M. Cimenti, J. Hill, Energies 2 (2009) 377–410. doi: 10.3390/en20200377
J. Luo, K. Zhao, J. Zhao, et al., J. Adv. Ceram. 12 (2023) 474–486. doi: 10.26599/jac.2023.9220697
R.J. Kee, H. Zhu, A.M. Sukeshini, et al., Combust. Sci. Technol. 180 (2008) 1207–1244. doi: 10.1080/00102200801963458
Y. Bai, Y. Liu, Y. Tang, et al., Int. J. Hydrogen Energy 36 (2011) 9189–9194.
D. Gu, G. Zhang, J. Zou, Chin. Chem. Lett. 32 (2021) 3548–3552.
F. He, M. Hou, Z. Du, et al., Adv. Mater. 35 (2023) e2304957.
T. Ren, M. Patel, K. Blok, Energy 31 (2006) 425–451.
X.Z. Fu, X.X. Luo, J.L. Luo, et al., J. Power Sources 196 (2011) 1036–1041.
J.Y. Lin, L. Shao, F.Z. Si, et al., J. Phys. Chem. C 122 (2018) 4165–4171. doi: 10.1021/acs.jpcc.7b11680
S. Liu, K.T. Chuang, J.L. Luo, ACS Catal. 6 (2015) 760–768.
J.H. Li, X.Z. Fu, G.H. Zhou, et al., Adv. Phys. Chem. 2011 (2011) 1–6.
S. Liu, Y. Behnamian, K.T. Chuang, et al., J. Power Sources 298 (2015) 23–29.
L. Shao, F. Si, X.Z. Fu, et al., Int. J. Hydrogen Energy 43 (2018) 7511–7514.
L. Wang, Y. Fan, J. Li, et al., Ceram. Int. 47 (2021) 24106–24114.
C. Wu, L. Wang, Z. Xiao, et al., Phys. Chem. Chem. Phys. 22 (2020) 724–733. doi: 10.1039/c9cp05022a
K. Wei, X. Wang, R.A. Budiman, et al., J. Mater. Sci. 53 (2018) 8747–8765. doi: 10.1007/s10853-018-2205-8
L. Shu, J. Sunarso, S.S. Hashim, et al., Int. J. Hydrogen Energy 44 (2019) 31275–31304.
J.M. López Nieto, B. Solsona, R.K. Grasselli, et al., Top. Catal. 57 (2014) 1248–1255. doi: 10.1007/s11244-014-0288-2
J. Li, S. Wang, J. Chang, et al., Adv. Powder Mater. 1 (2022) 100030.
M. Kahlaoui, A. Inoubli, S. Chefi, et al., Int. J. Hydrogen Energy 41 (2016) 4751–4764.
J. Sun, R. Ren, H. Yue, et al., Chin. Chem. Lett. 34 (2023) 107776.
J. Hwang, R.R. Rao, L. Giordano, et al., Science 358 (2017) 751–756. doi: 10.1126/science.aam7092
A.P. Anantharaman, H.P. Dasari, Ceram. Int. 47 (2021) 4367–4388.
A. Kaiser, J.L. Bradley, P.R. Slater, et al., Solid State Ionics 135 (2000) 519–524.
E.W. McFarland, H. Metiu, Chem. Rev. 113 (2013) 4391–4427. doi: 10.1021/cr300418s
H.X. Dai, C.F. Ng, C.T. Au, J. Catal. 189 (2000) 52–62.
X. Yang, T. Wei, B. Chi, et al., J. Catal. 377 (2019) 629–637.
R. Watanabe, Y. Hondo, K. Mukawa, et al., J. Mol. Catal. A: Chem. 377 (2013) 74–84.
V. Cortés Corberán, Top. Catal. 52 (2009) 962–969. doi: 10.1007/s11244-009-9246-9
Y. Gao, F. Haeri, F. He, et al., ACS Catal. 8 (2018) 1757–1766. doi: 10.1021/acscatal.7b03928
S. Tao, J.T. Irvine, Nat. Mater. 2 (2003) 320–323.
X. Zhang, Y. Tong, T. Liu, et al., SusMat 2 (2022) 487–501.
X. Yang, W. Sun, M. Ma, et al., Ind. Eng. Chem. Res. 60 (2021) 7826–7834. doi: 10.1021/acs.iecr.1c00806
Q. Liu, X. Dong, G. Xiao, et al., Adv. Mater. 22 (2010) 5478–5482. doi: 10.1002/adma.201001044
S. Sengodan, S. Choi, A. Jun, et al., Nat. Mater. 14 (2015) 205–209. doi: 10.1038/nmat4166
H. Ding, S. Fang, Y. Yang, et al., J. Power Sources 401 (2018) 322–328.
H. Ding, Z. Tao, S. Liu, et al., Sci. Rep. 5 (2015) 18129.
Y. Ling, T. Guo, Y. Guo, et al., J. Adv. Ceram. 10 (2021) 1052–1060. doi: 10.1007/s40145-021-0488-8
D. Zhang, Y. Wang, Y. Peng, et al., Adv. Powder Mater. 2 (2023) 100129.
C. Li, Y. Deng, L. Yang, et al., Adv. Powder Mater. 2 (2023) 100133.
Y. Niu, W. Huo, Y. Yu, et al., Chin. Chem. Lett. 33 (2022) 674–682.
Z. Liu, B. Liu, D. Ding, et al., J. Power Sources 237 (2013) 243–259.
Y.H. Huang, R.I. Dass, J.C. Denyszyn, et al., J. Electrochem. Soc. 153 (2006) A1266. doi: 10.1149/1.2195882
M. Yang, L. Huang, X. Lv, et al., Catal. Commun. 174 (2023) 106575.
V. Fung, F. Tao, D.E. Jiang, Catal. Sci. Technol. 6 (2016) 6861–6869.
M. Tasioula, E. de Clermont Gallerande, S.A. Theofanidis, et al., ACS Catal. 13 (2023) 2176–2189. doi: 10.1021/acscatal.2c05338
S. Najari, S. Saeidi, P. Concepcion, et al., Chem. Soc. Rev. 50 (2021) 4564–4605. doi: 10.1039/d0cs01518k
S. Yang, Z. Qi, Y. Wen, et al., Chem. Eng. J. 452 (2023) 139657.
M.L. Yang, Y.A. Zhu, C. Fan, et al., Phys. Chem. Chem. Phys. 13 (2011) 3257–3267. doi: 10.1039/c0cp00341g
J.J. Sattler, J. Ruiz-Martinez, E. Santillan-Jimenez, et al., Chem. Rev. 114 (2014) 10613–10653. doi: 10.1021/cr5002436
J. Liu, W. Luo, Y. Yin, et al., J. Catal. 396 (2021) 333–341.
J. Zhu, M.L. Yang, Y. Yu, et al., ACS Catal. 5 (2015) 6310–6319. doi: 10.1021/acscatal.5b01423
M.H. Hansen, J.K. Nørskov, T. Bligaard, J. Catal. 374 (2019) 161–170.
V. Galvita, G. Siddiqi, P. Sun, et al., J. Catal. 271 (2010) 209–219.
R.M. Rioux, H. Song, J.D. Hoefelmeyer, et al., J. Phys. Chem. B 109 (2005) 2192–2202. doi: 10.1021/jp048867x
A. Iglesias-Juez, A.M. Beale, K. Maaijen, et al., J. Catal. 276 (2010) 268–279.
Y. Hisai, K. Murakami, Y. Kamite, et al., Chem. Commun. 56 (2020) 2699–2702. doi: 10.1039/c9cc08757e
I.H. Kim, D.K. Lim, Y. Namgung, et al., Acta Mater 249 (2023) 118800.
Y. Lin, W. Zhou, J. Sunarso, et al., Int. J. Hydrogen Energy 37 (2012) 484–497.
H. Zimmermann, R. Walzl, Ullmann's Encyclopedia of Industrial Chemistry, Wiley, Weinheim, 2009.
J. Luo, L. Jia, D. Yan, et al., Acta Chim. Sin. 80 (2022) 317–326. doi: 10.6023/a21100451
O.O. James, S. Mandal, N. Alele, et al., Fuel Process. Technol. 149 (2016) 239–255.
M.M. Bhasin, J.H. McCain, B.V. Vora, et al., Appl. Catal. A 221 (2001) 397–419.
C.A. Gärtner, A.C. van Veen, J.A. Lercher, ChemCatChem 5 (2013) 3196–3217. doi: 10.1002/cctc.201200966
A.J. Carrillo, J.M. Serra, Catalysts 11 (2021) 741. doi: 10.3390/catal11060741
D. Neagu, J.T.S. Irvine, J. Wang, et al., J. Phys. Energy 5 (2023) 031501. doi: 10.1088/2515-7655/acd146

Figure 2 Physical characterizations, catalytic activity, and electrochemical performance of prepared PBFNMx: (a) XRD patterns of as-prepared PBFNMx; (b) XRD patterns of reduced PBFNMx; (c) Conductivity of PBFNMx in H2; (d) Dehydrogenation activity of reduced PBFNMx at 750 ℃ with blank test as comparison; (e) Impedance profiles and (f) I-V-P curves of BZCY electrolyte-supported cells with 60 wt% PBFNMx-40 wt% BZCY anode and 60 wt% LSCF-40 wt% BZCY cathode fueled by H2 at 750 ℃.

Figure 3 Characterizations of reduced PBFNM0.2 and structure of anode-supported cell: (a) Rietveld refinement; (b) TEM-EDS examination of reduced PBFNM0.2; (c) HRTEM examination of the exsolved nanoparticles; (d) Design and (e) SEM observation of anode-supported cell; (f) XRD patterns showing compatibility between PBFNM0.2 and BZCY at 1100 ℃ for 2 h; (g) SEM-EDS examination of 30 wt% PBFNM0.2-impregnated BZCY anode.

Figure 4 Performances of PBFNM0.2-BZCY anode-supported cells: (a) Impedance profiles and (b) I-V-P curves of cells with various amounts of PBFNM0.2 in anodes (H2 fuel, 750 ℃); (c) Impedance profiles and (d) I-V-P curves of cell with 30 wt% PBFNM0.2 in anode (H2 and C2H6 fuels, 750 ℃); (e) Composition of anode products of cell with 30 wt% PBFNM0.2 in anode with and without an applied current of 700 mA/cm2.

Figure 5 Performance (C2H6 fuel) and oxidative regeneration of cell with a 30 wt% PBFNM0.2-impregnated anode and PBFNM0.2 morphology change: (a) Time dependence of cell voltage at 0.7 A/cm2 and C2H4 yield; (b) Cell's impedance profiles at beginning of each cycle; (c) Raman spectra before and after first oxidative regeneration; (d) Cross-sectional microstructures of anode before first 50-h test and after first oxidative regeneration; (e) Morphologies of reduced (in H2 for 2 h and 0.5 h again after in air for 0.5 h) and oxidized (in air for 0.5 h) PBFNM0.2 at 800 ℃.

 扫一扫看文章

扫一扫关注我们
 DownLoad:

 下载:
下载:
 下载:
下载: