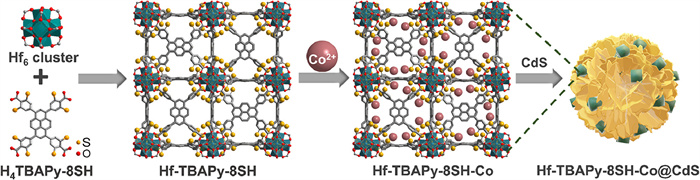
Figure 1.
Preparation scheme for Hf-TBAPy-8SH–Co@CdS composites (color: Hf, green; C, grey; O, red; S, yellow).
Building metal-thiolate sites and forming heterojunction in Hf- and Zr-based thiol-dense frameworks towards stable integrated photocatalyst for hydrogen evolution
Xin-Lou Yang , Jieying Hu , Hao Zhong , Qia-Chun Lin , Zhiqing Lin , Lai-Hon Chung , Jun He

Photocatalytic hydrogen production through water splitting has gained increasing attention as a solution to replace non-renewable fossil fuel and alleviate the derived pollution. Efficient and stable photocatalysts are crucial for achieving large-scale water splitting. In the past decades, development of artificial photocatalytic systems to promote H2 generation from water continues unabated [1,2]. Metal-organic frameworks (MOFs), as a class of porous crystalline materials assembled from metal ions/clusters and multifunctional organic ligands, have captured intensive at-tention in various applications, including gas separation [3,4], heterogeneous catalysis [5-7], chemical sensing [8,9], etc. MOFs are emerging porous materials for photocatalysis because of the following unique features: being heterogeneous enables easy recovery of catalysts; open channels in framework facilitate diffusion/mass transfer of substrates/products during photocatalysis; rich coordination between metal/metal cluster and organic linkers in MOFs mitigates broad modulation of semiconducting properties. Yet, several challenges such as poor aqueous stability [10], structurally unclear active sites and reliance on precious as co-catalyst remain to be addressed.
Pinpointing these issues, MOFs based on zirconium (Zr)-oxo clusters are regarded as ideal photocatalytic platforms owing to the following reasons: (1) Strong coordination bonds between high-valent Zr centers and hard carboxylate confer these frameworks chemical and mechanical stability to survive the harsh reaction conditions and long-term operation; (2) Rich functionalities of carboxylate-based linkers allow facile incorporation of functional groups into framework for anchoring transition metal ions as struc-turally well-defined catalytic sites, beneficial to elucidation of catalytic mechanism. As a result, Zr-based MOFs have been intensively studied and applied to various application scenarios [11]. Surprisingly, having stronger M–O bond (dissociation enthalpy: Hf–O = 802 kJ/mol; Zr–O = 776 kJ/mol) and being more reducing, Hafnium (Hf)-based MOFs receive far less attention. Jiang et al. reported the first example of Hf-substituted star MOF, UiO-66, and discovered far stronger piezoelectric response in UiO-66(Hf) than UiO-66(Zr), leading to enhanced photocatalytic activity [12]. The effect of Zr-to-Hf substitution was also reflected in reduction of nitroaromatics to anilines by Elkin and co-workers [13]. These findings suggest that Hf-based MOF may give better performance than Zr-based analogues in terms of reduction reaction and propose Zr-to-Hf substitution as a general strategy for enhancing activity of catalysts specialized for reduction.
Regarding functionalities of organic linkers, it has been demonstrated that versatile reactivity of thiols confers MOFs functions in various areas including metal adsorption [14], catalysis [15], and electrical conductivity [16]. For example, Xu et al. developed thiol-dense framework and anchored Co(Ⅱ) ions to generate Co(Ⅱ)-thiolate sites via post-synthetic modification (PSM) for efficient and selective photocatalytic CO2 reduction. On the other hand, researchers have been exploring new photocatalysts by combining MOFs with semiconductors [17]. These semiconductors either as photosensitizers or catalytic centers merged with MOFs show enhanced photocatalytic hydrogen evolution reaction (HER) per-formance outperforming their respective single-component systems [18-20]. Specifically, cadmium sulfide (CdS), as an outstanding semiconductor, has attracted particular attention due to its excellent light harvesting capability and suitable conduction band (CB) position [21]. There are some recent successful examples of MOF@CdS composites showing enhanced photocatalytic HER performance by suppression of recombination of photogenerated charge carriers [22,23].
Aiming to construct integrated systems for photocatalytic HER in stepwise and controllable manner, it is favorable to hetero-junction stable MOF bearing rich functionalities and photosensi-tizing semiconductor. Herein, we present the assembly of sulfur-rich, chemically stable Hf-based and Zr-based MOF (Hf-, Zr-TBAPy-8SH) and the facile anchoring of Co2+ ions by thiol (–SH) groups to yield Hf-, Zr-TBAPy-8SH–Co bearing metal-thiolate, [S––Co] moieties, as catalytic units. Hf-TBAPy-8SH–Co exhibited the best HER activity of around 5.28 mmol g–1 h–1 in the presence of ruthenium-polypyridyl photosensitizer. Finally, to build an integrated system, Hf-TBAPy-8SH–Co was allowed to form heterojunction with CdS to give Hf-TBAPy-8SH–Co@CdS (Fig. 1) showing the highest photocatalytic HER rate of 8.15 mmol g–1 h–1, outweighing pristine Hf-TBAPy-8SH–Co and CdS. Notably, the photocatalytic HER rate of Hf-TBAPy-8SH–Co@CdS is higher than that of Zr-TBAPy-8SH–Co@CdS, which highlights modulation of node e– density as a way to regulate photocatalytic activity. This study represents the first example of utilizing Hf-based thiol-rich MOF as platform to anchor transition metal ions for well-defined metal-thiolate active sites and form heterojunction to generate integrated photocatalyst.
HfCl4 and H4TBAPy-8SH were subjected to solvothermal reaction in N,N-dimethylformamide (DMF) and H2O (N2 as a protective atmosphere to prevent oxidation of H4TBAPy-8SH), with benzoic acid and ethane-1,2-dithiol serving as regulator and stabilizer, respectively to produce yellow crystalline Hf-TBAPy-8SH. Zr-TBAPy-8SH, as comparative model, was prepared analogously using ZrCl4 in place of HfCl4. As shown by scanning electron microscopy (SEM) (Fig. S2 in Supporting information), Hf-TBAPy-8SH adopted a tetra-hedral morphology with dimensions of approximately 200 nm. Unlike the hexagonal network of NU-1000 (constructed using unsubstituted 1,3,6,8-tetrakis(p-benzoic acid)pyrene, H4TBAPy as the linker), Hf-TBAPy-8SH crystallizes into a cubic network, similar to NU-1100 (constructed by a linker similar to H4TBAPy yet with 4 alkynyl bridges linking pyrene and 4 apex carboxylic acids) [24]. This probably arises from the steric hindrance of peripheral –SH groups in H4TBAPy-8SH. The powder X-ray diffraction (PXRD) pattern of Hf-TBAPy-8SH (Fig. 2a) matches that of the model structure (Fig. S1 in Supporting information), with a space group of Im3Å (No. 204) and a cubic lattice of ftw (4,12-connected net) topology (a = 37.3687 A)˚. Importantly, consistent PXRD patterns of Hf-TBAPy-8SH and Zr-TBAPy-8SH (Fig. S3 in Supporting information) highlight their isomorphic nature. S–H stretching centered at 2576 cm–1 in Fourier-transform infrared (FT-IR) spectra of both as-made and activated samples (Fig. 2b) and X-ray photoelectron spec- troscopy (XPS) signals of S 2p1/2 and 2p3/2 at 163.34 and 164.53 eV jointly support the presence of –SH groups in Hf-TBAPy-8SH (Fig. 2g).
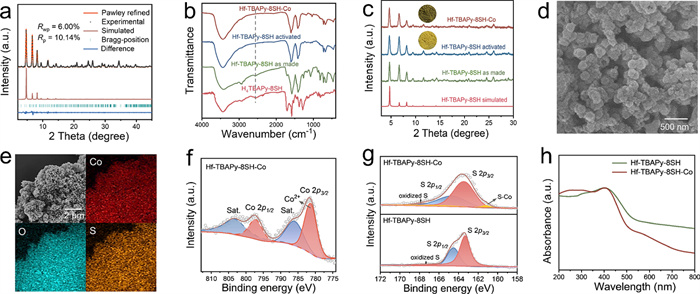
Even though both Zr-TBAPy-8SH and Hf-TBAPy-8SH are thioldense and stable in various solution media (Fig. S5 in Support-ing information), with ZrCl4 cheaper than HfCl4, Zr-TBAPy-8SH was taken as a platform to screen the best transition metal (TM) ions and an optimal density of catalytic sites for construction of well-defined HER active sites (note: insufficient sites lead to reduced conversion rates, while site aggregation leads to less exposure of catalytic sites). Zr-TBAPy-8SH-TM-x (x = 5, 10 or 20 mg represents the mass of TMCl2 used; TM = Co, Ni, Cu) were prepared to study how the loading amounts and transition metal ions species influence the photocatalytic activity (Table S3 in Support-ing information). It was found that Zr-TBAPy-8SH–Co-10 (abbre-viated as Zr-TBAPy-8SH–Co) showed the best HER performance, and Hf-TBAPy-8SH–Co was prepared similarly to study the influence from Zr-oxo cluster to Hf-oxo cluster. Consistent PXRD patterns (Fig. 2c), retained morphology and particle size (Fig. 2d) between Hf-TBAPy-8SH–Co and Hf-TBAPy-8SH revealed framework integrity of Hf-TBAPy-8SH after anchoring TM ions. Energy dispersive spectroscopy (EDS) results of Hf-TBAPy-8SH–Co revealed a uniform distribution of C, S, Co, and Hf elements ensuring dispersal of [S––Co] active sites over the framework (Fig. 2e). Cobalt content in the prepared Hf-TBAPy-8SH–Co was determined using inductively coupled plasma optical emission spectroscopy (ICP-OES) (Table S1 in Supporting information). The loaded metal content for Hf-TBAPy-8SH–Co was found to be 8.56 wt% with molar ratio (TBAPy-8SH4–: Co2+) to be 1:2.61.
To investigate the chemical environment of anchored transition metal ions and thiols in Hf-TBAPy-8SH–Co, FT-IR and XPS techniques were adopted. From the FT-IR spectra, vanishing characteristic S–H stretching (2576 cm–1) from Hf-TBAPy-8SH to Hf-TBAPy-8SH–Co suggests consumption of S–H bond through formation of Co–S bond (Fig. 2b). On the other hand, the XPS S 2p spectrum of Hf-TBAPy-8SH showed two main peaks at 163.32 and 164.48 eV, indicating the presence of unbound thiol (–SH), while a small peak at 167.86 eV, suggesting the presence of trace amounts of oxidized sulfur centers (Fig. 2g). Considering Hf-TBAPy-8SH–Co, XPS Co 2p3/2 and 2p1/2 signals of 781.34 and 797.19 eV corresponding to Co2+ were observed (Fig. 2f), divergent from the scenario of metal-thiocatecholate where one of the thiolates turns to be thiyl radical [25]. Looking at S 2p spectra of Hf-TBAPy-8SH–Co, all still showed two peaks of free thiols (2p3/2: 163.43 eV; 2p1/2: 164.59 eV) but with weaker intensities. Notably, a new signal of lower binding energy (161.17 eV) rose in Hf-TBAPy-8SH–Co and corresponds to S––Co (Fig. 2g) [26], consolidating the formation of cobalt-thiolate bond. These findings suggest retention of thiols, incomplete metalation as well as formation of robust metal-thiolate motifs within the framework of Hf-TBAPy-8SH upon anchoring TM ions.
To study the photocatalytic power of Hf-TBAPy-8SH–Co, they were utilized as a visible-light (λex ≥ 420 nm) photocatalyst for HER in a solvent mixture of DMF/H2O (1:1, v/v), with tri-ethanolamine (TEOA) as scavenger and [Ru(bpy)3]Cl2 as photosen-sitizer. As expected, the HER rate of Hf-TBAPy-8SH alone was low (0.58 mmol g–1 h–1), likely due to the absence of Co-centered active sites. Upon incorporation of TM ions, the photocatalytic HER activity of the framework enhanced, with Hf-TBAPy-8SH–Co exhibiting a high rate (5.54 mmol g–1 h–1) (Fig. 3a). It is worth noting that both scavenger and photosensitizer are necessary for photocatalysis, as demonstrated by negligible H2 evolution without these components (Table S3). To evaluate the photostability of Hf-TBAPy-8SH–Co, the HER rates were monitored hourly and found to grow linearly within 4 h (Fig. 3b), signifying Hf-TBAPy-8SH–Co to be photostable throughout the photocatalysis. More importantly, the constant catalytic activity and unchanged PXRD pattern of Hf-TBAPy-8SH–Co (Fig. S19 in Supporting information) after three photocatalytic cycles highlight the integrity of the framework and stability of the active site in Hf-TBAPy-8SH–Co (Fig. 3c). These collectively indicate that the formation of structurally robust well-defined [S––Co] moieties is decisive to build permanent active sites in framework for photocatalytic HER.
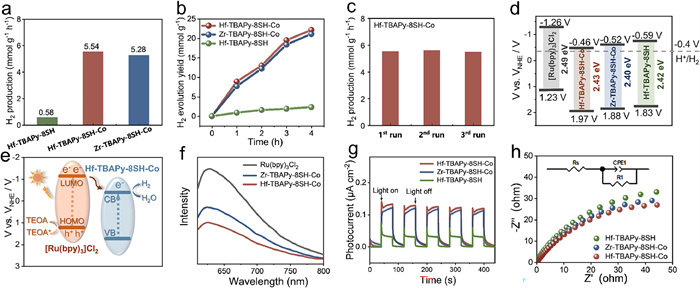
Zr-TBAPy-8SH–Co was prepared similarly to study the influence from Zr-oxo cluster to Hf-oxo cluster. By ICP-OES, the loaded Co2+ content in Zr-TBAPy-8SH–Co was found to be 9.28 wt% with molar ratio (TBAPy-8SH4–: Co2+) to be 1:2.49 (Table S1). Besides, Co 2p3/2 and 2p1/2 signals at 781.49 and 797.73 eV of Zr-TBAPy-8SH supported divalent state of Co centers, but with higher binding energy than those in Hf-TBAPy-8SH–Co (Fig. S14 in Supporting information). These findings suggest richer e– density of [S––Co] sites in Hf-TBAPy-8SH–Co than Zr-TBAPy-8SH–Co. Under the same photocatalytic conditions, HER rate of Hf-TBAPy-8SH–Co (5.54 mmol g–1 h–1) was found higher than Zr-TBAPy-8SH–Co (5.28 mmol g–1 h–1), probably accounted by overall richer e– density of [S––Co] sites in Hf-TBAPy-8SH–Co.
To elucidate the rationale behind the enhancement of photocat-alytic HER from Hf-, Zr-TBAPy-8SH to Hf-, Zr-TBAPy-8SH–Co, the electronic structures of these MOFs were investigated using UV–vis diffuse reflectance spectroscopy (UV–vis DRS) and Mott-Schottky (M-S) measurements (Fig. 2h). The CB edges relative to the reversible hydrogen electrode (NHE, at pH 7) were determined to be –0.59 V for Hf-TBAPy-8SH, –0.52 V for Zr-TBAPy-8SH–Co, –0.48 V for Hf-TBAPy-8SH–Co, based on M-S measurements (Fig. S21 in Supporting information) [14]. The optical band gaps of Hf-TBAPy-8SH, Zr-TBAPy-8SH–Co and Hf-TBAPy-8SH–Co were determined to be 2.43, 2.40 and 2.43 eV, respectively, using the Tauc plots from UV–vis DRS (Fig. S20 in Supporting information). The valence band (VB) edges relative to NHE, at pH 7 were calculated to be 1.84 V for Hf-TBAPy-8SH, 1.88 V for Zr-TBAPy-8SH–Co and 1.95 V for Hf-TBAPy-8SH–Co (Fig. 3d).
Given that the lowest unoccupied molecular orbital (LUMO) energy level of [Ru(bpy)3]Cl2 is at –1.26 V vs. NHE, pH 7, higher lying than CB edge of Hf-TBAPy-8SH–Co and the photogenerated e– move from the LUMO of [Ru(bpy)3]2+ to the CB of Hf-TBAPy-8SH–Co, for reduction of H+ to H2 (Fig. 3e). Typically, a more negative CB edge of the catalyst than the H+ /H2 redox potential (–0.41 V vs. NHE, pH 7) means photocatalytic HER to be thermo-dynamically feasible. However, despite holding a CB edge higher lying than the H+ /H2 redox potential, Hf-TBAPy-8SH is incapable of catalyzing HER, highlighting the crucial role of [S––Co] motif as the active site.
To further understand the photocatalytic process of Hf-TBAPy-8SH–Co, photoluminescence (PL) spectroscopy, electrochemical impedance spectroscopy (EIS), and transient photocurrent re-sponse measurements were employed. Generally, upon illumination, the photosensitizing [Ru(bpy)3]2+ is excited to its excited state [RuⅢ(bpy)2(bpy•–)]2+∗. Importantly, PL of [Ru(bpy)3]2+ in the DMF/H2O mixture was quantitatively quenched by Hf-, Zr-TBAPy-8SH–Co in the order of Hf-TBAPy-8SH–Co > Zr-TBAPy-8SH–Co, indicating oxidative quenching mechanism and the more effective e– transfer from [RuⅢ(bpy)2(bpy•–)]2+∗ to Hf-TBAPy-8SH–Co (Fig. 3f). Besides, transient photocurrent response showed the trend of Hf-TBAPy-8SH–Co > Zr-TBAPy-8SH–Co (Fig. 3g) indicating stronger visible-light driven charge transport in Hf-TBAPy-8SH–Co. EIS spectra revealed that the charge transfer resistance follows the order of Hf-TBAPy-8SH–Co < Zr-TBAPy-8SH–Co (Fig. 3h) and signifies faster charge transfer of Hf-TBAPy-8SH–Co than Zr-TBAPy-8SH–Co. Most significant PL quenching of [Ru(bpy)3]2+, largest transient photocurrent response and smallest charge transfer resistance of Hf-TBAPy-8SH–Co collectively account for its bet-ter HER performance than Zr-TBAPy-8SH–Co analogues and high-light the supremacy of Hf-oxo cluster than Zr-oxo as connecting node to modulate HER performance in TBAPy-8SH4–-based frame-works.
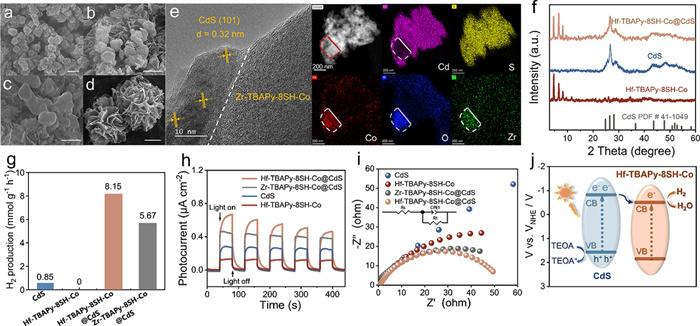
To enhance photocatalytic performance while abandoning noble-metal based photosensitizer, inexpensive visible-light photosensitizing semiconductor CdS was allowed to heterojunction with the best performing Hf-, Zr-TBAPy-8SH–Co to construct in-tegrated composites for photocatalytic HER (Figs. 4a-c). Flower-like CdS nanoflakes (Fig. 4d) were prepared according to reported procedures [27] and successfully heterojunctioned with Zr-TBAPy-8SH–Co as shown by high-resolution transmission electron micro-scope (HRTEM). The lattice fringe spacing of 0.32 nm can be in-dexed to the 101 planes of CdS and the clear interface between CdS and Zr-TBAPy-8SH–Co suggests good separation of photogen-erated carriers. Co-existence of Zr, C, O, S, Co, and Cd shown in scanning transmission electronic microscopy-EDS (STEM-EDS) supports the formation of Zr-TBAPy-8SH–Co@CdS composite (Fig. 4e). Moreover, with a CB edge at –0.83 V vs. NHE, pH 7, CdS is high-lying enough to transfer the photoexcited e– to Hf-TBAPy-8SH–Co. After confirming the optimal merging ratio with Zr-TBAPy-8SH–Co (say balance between optical absorption and catalytic activity: too concentrated active sites overshadowing the light-harvesting CdS while too diluted active sites leading to insufficient HER centers) (Fig. S18 in Supporting information), 50 mg CdS nanoflakes and 10 mg Hf-, Zr-TBAPy-8SH–Co were stirred in ethanol at 60 ℃ for 4 h, resulting in Hf-TBAPy-8SH–Co@CdS composites. To note, the PXRD patterns of Hf-TBAPy-8SH–Co@CdS 1:1 (Fig. 4f, mass ratio between Hf-TBAPy-8SH–Co and CdS = 1:1) exhibited characteristic peaks of both CdS and Hf-TBAPy-8SH–Co, indicating successful heterojunction between CdS and Hf-TBAPy-8SH–Co.
As shown in the absorption spectra (Fig. S26 in Supporting information), Hf-TBAPy-8SH–Co absorbs in the visible spectral region but the band mismatch and inefficient charge carrier separation/migration probably explain their inactive photocatalytic HER without photosensitizer. On the other hand, CdS may mitigate this situation with suitable band structure. For example, the hetero-junction structure of Hf-TBAPy-8SH–Co@CdS retained the absorption characteristics of CdS, allowing the generation of photocatalytically active e–-h+ pairs.
Photocatalytic HER trials were conducted using Hf-, Zr-TBAPy-8SH–Co@CdS heterojunctions (1.0 mg loaded Hf-, Zr-TBAPy-8SH–Co@CdS) under the optimized experimental conditions but without [Ru(bpy)3]Cl2. As shown in Fig. 4g, CdS alone exhibited some activity (0.85 mmol g–1 h–1), while Hf-TBAPy-8SH–Co alone showed no activity. Merging the two, the Hf-TBAPy-8SH–Co@CdS heterojunctions achieved higher activity, with Hf-TBAPy-8SH–Co@CdS reaching the highest rate of 8.15 mmol g–1 h–1, 9.5 times higher than that of CdS alone and outperforms many MOF@CdS photocatalytic systems (Table S5 in Supporting information). However, Zr-TBAPy-8SH–Co@CdS exhibited a lower HER rate (5.75 mmol g–1 h–1) than Hf-TBAPy-8SH–Co@CdS. Importantly, Hf-TBAPy-8SH–Co@CdS demonstrated operational stability upon 3 cycles of photocatalysis (Fig. S27 in Supporting information). It is worth noting that photocurrent response of Hf-TBAPy-8SH–Co@CdS is higher than those of Zr-TBAPy-8SH–Co@CdS and then pristine CdS (Fig. 4h). Also, elec-trochemical impedance spectroscopy (EIS) plots illustrate that the signal radii increase in an order of Hf-TBAPy-8SH–Co@CdS < Zr-TBAPy-8SH–Co@CdS < CdS (Fig. 4i). These findings jointly support the trend in photocatalytic HER performance (Hf-TBAPy-8SH–Co@CdS > Zr-TBAPy-8SH–Co@CdS > CdS).
Based on the electronic structures of the composites, a plau-sible photocatalytic mechanism was proposed here using the best catalyst, Hf-TBAPy-8SH–Co@CdS, as the model: since the composite possesses staggered band gaps with band edges of CdS higher lying than those of Hf-TBAPy-8SH–Co, it is classified as type-Ⅱ heterojunction [28]. Upon visible-light excitation, e–-h+ pairs are generated within the composite. Specifically, photogenerated e– migrates from CB edge of CdS to that of Hf-TBAPy-8SH–Co for reduction of H2O to H2 while photogenerated h+ shift from VB edge of Hf-TBAPy-8SH–Co to that of CdS for oxidation of scavenger (Fig. 4j).
In short, thiol-dense Hf- and Zr-based frameworks (Hf-, Zr-TBAPy-8SH) were prepared as stable platforms for fixing Co2+ ions by thiol pendants to build [S––Co] active sites. To move forward, heterojunctioning between the best performing Hf-, Zr-TBAPy-8SH–Co and CdS was employed to give Hf-, Zr-TBAPy-8SH–Co@CdS which showed even higher HER rate upon photoex-citation than the scenarios with external photosensitizers. Importantly, Hf-composite (8.15 mmol g–1 h–1) performed even better than Zr-composite (5.67 mmol g–1 h–1) probably owing to higher overall e– density of Hf-composite than Zr-composite upon formation of heterojunction with CdS. This work represents the first example to demonstrate thiol-dense Hf-based MOF as stable platform to anchor TM ions for well-fined [S––TM] sites and heterojunction with CdS towards integrated HER photocatalyst with e–-rich metal node and robust structure.
Xin-Lou Yang: Writing – original draft, Investigation, Formal analysis, Data curation. Jieying Hu: Visualization, Project administration, Formal analysis. Hao Zhong: Methodology, Formal analysis. Qia-Chun Lin: Validation, Software. Zhiqing Lin: Software, Formal analysis. Lai-Hon Chung: Writing – review & editing, Writing – original draft, Supervision, Funding acquisition, Formal analysis, Conceptualization. Jun He: Writing – review & editing, Supervision, Resources, Funding acquisition, Conceptualization.
This work was supported by the National Natural Science Foundation of China (Nos. 22371054, 22301045), the Foundation of Basic and Applied Basic Research of Guangdong Province (Nos. 2020B1515120024, 2024A1515012801), Science and Technology Planning Project of Guangdong Province (Nos. 2021A0505030066, 2023A0505050164). We thank Instrumental Analysis Centre of Guangdong University of Technology for collection of XPS, PL data, SEM and HRTEM images.
Supplementary material associated with this article can be found, in the online version, at doi:
M.Z. Rahman, M.G. Kibria, C.B. Mullins, Chem. Soc. Rev. 49 (2020) 1887–1931. doi: 10.1039/c9cs00313d
Z. Yan, K. Yin, M. Xu, et al., Chem. Eng. J. 472 (2023) 145066.
Y. Su, D. Li, M. Shan, et al., Angew. Chem. Int. Ed. 63 (2024) e202316093.
M. Zheng, W. Xue, T. Yan, et al., Angew. Chem. Int. Ed. 63 (2024) e202401770.
S. Fu, S. Yao, S. Guo, et al., J. Am. Chem. Soc. 143 (2021) 20792–20801. doi: 10.1021/jacs.1c08908
X.C. Lin, Y.M. Wang, X. Chen, et al., Angew. Chem. Int. Ed. 62 (2023) e202306497.
M. Fang, L. Xu, H. Zhang, et al., J. Am. Chem. Soc. 144 (2022) 15143–15154. doi: 10.1021/jacs.2c05059
L. Luo, L. Hou, X. Cui, et al., Nat. Commun. 15 (2024) 3618.
K. Jin, D. Moon, Y.P. Chen, et al., Adv. Mater. 36 (2024) 2309570.
S. Yuan, L. Feng, K. Wang, et al., Adv. Mater. 30 (2018) 1704303.
S. Yuan, J.S. Qin, C.T. Lollar, et al., ACS Cent. Sci. 4 (2018) 440–450. doi: 10.1021/acscentsci.8b00073
C. Zhang, D. Lei, C. Xie, et al., Adv. Mater. 33 (2021) 2106308.
T. Elkin, C.T. Saouma, Inorg. Chim. Acta 497 (2019) 119076.
G.Q. Lai, Z. Jiang, H. Zhong, et al., Chin. J. Struct. Chem. 42 (2023) 100090.
B. Guo, X. Cheng, Y. Tang, et al., Angew. Chem. Int. Ed. 61 (2022) e202117244.
X. Huang, P. Sheng, Z. Tu, et al., Nat. Commun. 6 (2015) 7408.
D.C. Liu, T. Ouyang, R. Xiao, et al., ChemSusChem 12 (2019) 2166–2170.
L. Zhai, Y. Qian, Y. Wang, et al., ACS Appl. Mater. Inter. 10 (2018) 36933–36940. doi: 10.1021/acsami.8b11920
N. Li, H. Huang, R. Bibi, et al., Appl. Surf. Sci. 476 (2019) 378–386.
X. Fu, H. Huang, G. Tang, et al., Chin. J. Struct. Chem. 43 (2024) 100214.
K. Huang, B. Feng, X. Wen, et al., Chin. J. Struct. Chem. 42 (2023) 100204.
A. Ghosh, S. Karmakar, F.A. Rahimi, et al., ACS Appl. Mater. Inter. 14 (2022) 25220–25231. doi: 10.1021/acsami.1c23458
H.Q. Xu, S. Yang, X. Ma, et al., ACS Catal. 8 (2018) 11615–11621. doi: 10.1021/acscatal.8b03233
O.V. Gutov, W. Bury, D.A. Gomez-Gualdron, et al., Chem. Eur. J. 20 (2014) 12389–12393. doi: 10.1002/chem.201402895
H. Zhong, S. Chen, Z. Jiang, et al., Small 19 (2023) 2207266.
B. Zhang, J. Liu, J. Wang, et al., Nano Energy 37 (2017) 74–80. doi: 10.3901/JME.2017.02.074
Z. Pan, J. Li, K. Zhou, Nanotechnology 29 (2018) 215402. doi: 10.1088/1361-6528/aab4d5
J. Low, J. Yu, M. Jaroniec, et al., Adv. Mater. 29 (2017) 1601694.

Figure 1 Preparation scheme for Hf-TBAPy-8SH–Co@CdS composites (color: Hf, green; C, grey; O, red; S, yellow).

Figure 2 (a) Experimental, Pawley-refined, and simulated PXRD patterns of Hf-TBAPy-8SH. (b) FT-IR spectra of H4 TBAPy-8SH, as made Hf-TBAPy-8SH, activated Hf-TBAPy-8SH and Hf-TBAPy-8SH–Co. (c) PXRD patterns (Cu Kα, λ = 1.5418 A)˚ of crystal structure model of Hf-TBAPy-8SH, as made Hf-TBAPy-8SH, activated Hf-TBAPy-8SH and Hf-TBAPy-8SH–Co. (d) SEM image of Hf-TBAPy-8SH–Co. (e) SEM images and EDS elemental mapping (O, blue; S, orange; Co, red) of Hf-TBAPy-8SH–Co. (f) XPS Co 2p spectra of Hf-TBAPy-8SH–Co. (g) XPS S 2p spectra of Hf-TBAPy-8SH and Hf-TBAPy-8SH–Co. (h) UV–vis absorption spectra of Hf-TBAPy-8SH and Hf-TBAPy-8SH–Co.

Figure 3 (a) Rate of photocatalytic H2 evolution of Hf-TBAPy-8SH and Hf-, Zr-TBAPy-8SH–Co catalysts bearing different transition metal upon visible LED irradiation. (b) H2 production of Hf-TBAPy-8SH and Hf-, Zr-TBAPy-8SH–Co over 4 h. (c) Three cycles of photocatalytic H2 evolution experiments of Hf-TBAPy-8SH–Co. (d) Band structures of [Ru(bpy)3]Cl2, Hf-TBAPy-8SH and Hf-, Zr-TBAPy-8SH–Co. (e) Schematic energy-level diagram showing electron transfer from [Ru(bpy)3]Cl2 to Hf-TBAPy-8SH–Co upon photoexcitation. (f) Steady-state photoluminescence spectra (λex = 550 nm) of [Ru(bpy)3]Cl2 upon addition of Hf-, Zr-TBAPy-8SH–Co. (g) Photocurrent responses of EIS of Hf-TBAPy-8SH and Hf-, Zr-TBAPy-8SH–Co. (h) Nyquist plots of EIS of Hf-TBAPy-8SH and Hf-, Zr-TBAPy-8SH–Co.

Figure 4 SEM images of (a) Hf-TBAPy-8SH–Co, (b) Zr-TBAPy-8SH–Co@CdS, (c) Hf-TBAPy-8SH–Co@CdS, and (d) CdS. Scale bar: 500 nm in (a, d) and 200 nm in (b, c). (j) HRTEM images and STEM-EDS elemental mapping (Cd, purple; S, yellow; Co, red; O, blue; Zr, green) of Zr-TBAPy-8SH–Co@CdS. (f) PXRD patterns of CdS, Hf-TBAPy-8SH–Co and Hf-TBAPy-8SH–Co@CdS 1:1. (g) H2 production of Hf-TBAPy-8SH–Co, CdS and Hf-, Zr-TBAPy-8SH–Co@CdS over 4 h. (h) Photocurrent responses of Hf-TBAPy-8SH–Co, CdS and Hf-, Zr-TBAPy-8SH–Co@CdS. (i) Nyquist plots of EIS of Hf-TBAPy-8SH–Co, CdS, Hf-, Zr-TBAPy-8SH–Co@CdS. (j) Illustration showing the excitons dissociation and transfer in the Hf-TBAPy-8SH–Co@CdS heterostructure under visible-light irradiation.

 扫一扫看文章

扫一扫关注我们
 DownLoad:
 下载:
下载:
 下载:
下载: