Citation:
Shengyu Zhao, Xuan Yu, Yufeng Zhao. A water-stable high-voltage P3-type cathode for sodium-ion batteries[J]. Chinese Chemical Letters,
2024, 35(9): 109933.
doi:
10.1016/j.cclet.2024.109933
A water-stable high-voltage P3-type cathode for sodium-ion batteries
English
A water-stable high-voltage P3-type cathode for sodium-ion batteries
Received Date:
17 March 2024 Accepted Date:
28 April 2024 Available Online:
15 September 2024
Abstract:
The Na-deficient P3-type layered oxide cathode material usually experience complex in-plane Na+/vacancy ordering rearrangement and undesirable P3-O3 phase transitions in the high-voltage region, leading to inferior cycling performance. Additionally, they exhibit unsatisfactory stability when exposed to water for extended periods. To address these challenges, we propose a Cu/Ti co-doped P3-type cathode material (Na0.67Ni0.3Cu0.03Mn0.6Ti0.07O2), which effectively mitigates Na+/vacancy ordering and suppresses P3-O3 phase transitions at high voltages. As a result, the as-prepared sample exhibited outstanding cyclic performance, with 81.9% retention after 500 cycles within 2.5–4.15 V, and 75.7% retention after 300 cycles within 2.5–4.25 V. Meanwhile, it demonstrates enhanced Na+ transport kinetics during desodiation/sodiation and reduced growth of charge transfer impedance (Rct) after various cycles. Furthermore, the sample showed superb stability against water, exhibiting no discernible degradation in structure, morphology, or electrochemical performance. This co-doping strategy provides new insights for innovative and prospective cathode materials.
Sodium-ion batteries (SIBs) have shown great potential as a secondary battery technology for stationary energy storage systems because of the abundance, low cost, and wide distribution of Na [1–4]. Layered transition metal oxides are deemed as promising cathode material because of their simple synthesis conditions, adjustable composition, and high operating voltage [5–7]. Among them, Na-deficient P3-type materials with oxygen stacking sequences of 'ABBCCA' and a unique trigonal prismatic coordination environment for sodium exhibit an open framework for sodium ion transport and low migration energy barriers, resulting in excellent rate performance and long cycle life [8,9]. Additionally, P3-type materials are prepared at lower sintering temperature (about 700 ℃) compared to other layered cathode materials, providing a cost advantage [10]. However, P3-type materials, such as Na0.67Ni0.33Mn0.67O2, typically suffer from complex in-plane Na+/vacancy ordering rearrangement during the desodiation/sodiation, evidenced by obvious voltage plateau, leading to sluggish sodium ion transport and unsatisfactory electrochemical performance [11,12]. Furthermore, they undergo undesired P3-O3 phase transitions in the deep desodiation state, leading to structural collapse and performance deterioration [13,14]. Moreover, the materials exhibit inferior stability against air and water, as evidenced by shifts in diffraction peaks, the formation of hydrated phase and capacity loss [15,16].
Cation doping offers an effective approach to address the aforementioned shortcomings. The incorporation of Ti4+ can mitigate Na+/vacancy ordering and broaden the solid-solution zone, resulting in a smoother charge-discharge curve. Moreover, it can effectively suppress adverse phase transitions at high voltage, thereby improving the electrochemical performance [17,18]. However, the high cost of Ti necessitates a balanced approach that takes into account both performance and cost. Furthermore, Cu2+ doping can enhance the stability against air or water due to its high electrochemical redox potential, hindering the extraction of bulk Na+ and thereby reducing Na+/H3O+ exchange [19–21]. Simultaneously, Cu2+ doping can also elevate the average operating voltage and energy density of the material [22]. Additionally, the price of Cu is half that of Ni, thus providing a cost advantage by replacing nickel [23]. Consequently, the simultaneous doping of Cu/Ti holds promising prospects as a material with exceptional stability against water and superior electrochemical performance.
In this study, we synthesized a Cu/Ti co-doped P3-type cathode material (NCMT) and conducted a comprehensive investigation of the material's electrochemical performance, structural evolution, and the stability against water. In comparison to NM materials, the as-prepared NCMT exhibited mitigation of Na+/vacancy ordering and suppressed P3-O3 phase transitions in the deep desodiation state, as evidenced by smooth charge-discharge curves and ex-situ XRD characterization. Consequently, the material demonstrated exceptional cycling stability, retaining 81.9% of its capacity after 500 cycles within 2.5–4.15 V, and maintaining 75.7% retention at 1 C within 2.5–4.25 V. Additionally, immersing the sample in water for 4 days did not result in any discernible changes in its structure and morphology, while the material continued to exhibit excellent electrochemical performance. Finally, when NCMT was assembled with hard carbon into a full cell, it maintained an 81.0% of initial capacity after 150 cycles. This Cu/Ti co-doping strategy offers new insight for design of cathode materials.
All samples were prepared by simple high-temperature solid-state method, and the specific process is detailed in the Electronic Supplementary Material. The samples included the reference sample Na0.67Ni0.33Mn0.67O2 (NM), Cu-doped samples: Na0.67Ni0.3Cu0.03Mn0.67O2 (NC3M) and Na0.67Ni0.28Cu0.05Mn0.67O2 (NC5M), Ti-doped samples: Na0.67Ni0.33Mn0.6Ti0.07O2 (NMT7) and Na0.67Ni0.33Mn0.57Ti0.1O2 (NMT10), and Cu-Ti co-doped sample Na0.67Ni0.3Cu0.03Mn0.6Ti0.07O2 (NCMT). The actual composition of the samples, as determined by ICP results (Table S1 in Supporting information), was found to be in agreement with the theoretical composition. Figs. 1a and b, Fig. S1 (Supporting information) present the X-ray diffraction (XRD) patterns and the corresponding refined results, where all diffraction peaks can be assigned to a pure P3 phase (space group: R3m), indicating the absence of impurities and successful incorporation of Cu and Ti into the crystal structure [24,25]. Based on the refined crystallographic data in Tables S2-S7 (Supporting information), it is observed that the lattice parameters a and c of the doped sample increases in comparison to the reference sample (NM), attributed to the larger ionic radius of Cu2+ (0.73 Å) than Ni2+ (0.69 Å), and the larger ionic radius of Ti4+ (0.605 Å) than Mn4+ (0.53 Å). Fig. 1c shows the schematic diagram of the P3-type structure, which forms through the alternating stacking of transition metal layer and Na layer with oxygen stacking sequences of 'ABBCCA'. Specifically, Na occupies a triangular prismatic site, ensuring straightforward migration pathways and a low migration energy barrier, resulting in excellent kinetic properties [26]. Subsequently, the samples are observed by SEM, revealing a nanoplate-like morphology, with sizes ranging from 100 nm to 400 nm (Fig. 1d and Fig. S2 in Supporting information). Additionally, Fig. 1e presents a typical TEM image of the NCMT sample, further confirming the nanoplate-like morphology. Meanwhile, the high-resolution transmission electron microscopy (HRTEM) image (Fig. 1f) reveals that the sample is highly crystalline with interplanar spacing of 2.81 Å, corresponding to (006) plane of XRD pattern. Similarly, the TEM and HRTEM images of the NM sample also exhibit similar results (Fig. S3 in Supporting information). Fig. 1g and Fig. S4 (Supporting information) show the energy dispersive spectroscopy (EDS) mapping of NCMT and NM sample, verifying the uniform distribution of all elements. Furthermore, the oxidation states of the elements were also confirmed through XPS. As depicted in Fig. 1h, the Ni 2p spectrum has two characteristic peaks at 872.1 eV and 854.6 eV, indicating that Ni is in the +2 for MCMT and NM samples [27]. The Mn 2p spectrum has two main characteristic peaks located at 642.1 and 653.7 eV, which is corresponding to the 2p3/2 and 2p1/2 of Mn4+ (Fig. 1i) [28]. The Cu 2p and Ti 2p spectrum confirm the valences to be +2 and +4 (Figs. 1j and k), respectively, indicating the successful incorporation of the elements into the structure [20,29].
Figure 1
Figure 1.
XRD patterns and Rietveld refinement plots of (a) NM and (b) NCMT samples. (c) Crystal structure schematic of NCMT sample. (d) SEM image of NCMT sample. The typical (e) TEM image and (f) HRTEM image of NCMT sample. (g) Energy dispersive spectroscopy (EDS) mapping of NCMT sample. XPS spectra of (h) Ni, (i) Mn, (j) Cu and (k) Ti elements for the NM and NCMT samples.
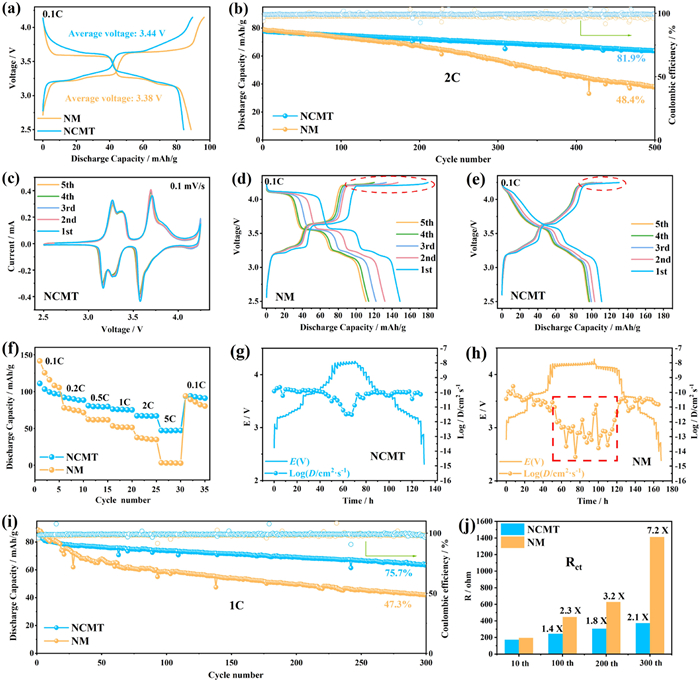
The electrochemical performance was evaluated using a half-cell with sodium as the negative electrode. Fig. 2a and Fig. S5 (Supporting information) show the first charge-discharge curves of the samples within 2.5–4.15 V at 0.1 C (1 C = 90 mA/g). The NM electrode delivers a discharge capacity of 88.7 mAh/g with initial coulombic efficiency (ICE) of 91.9% and exhibits two obvious voltage plateaus at approximately 3.3 V and 3.7 V in the charge curve, which can be attributed to Na+/vacancy ordering arrangements between adjacent TMO2 layer [11]. After substitution, NC3M and NC5M electrodes demonstrate lower capacity due to fewer redox couples [13,30]. The charge-discharge curves of NMT7 and NMT10 electrodes become smoother compared to NM, indicating the mitigation of Na+/vacancy ordering [31]. In the case of NCMT, it displays a smoother curve, higher average voltage (3.44 V), and higher ICE (94.0%). Subsequently, the cycling stability is compared at 2 C (Fig. 2b and Fig. S6 in Supporting information). The NM electrode displayed rapid capacity decay, retaining only 48.4% of its capacity after 500 cycles. In contrast, the doped samples demonstrate improved cycling performance, especially the NCMT (Cu/Ti co-doping sample), which maintained 81.9% of the initial capacity. Based on these results, further detailed analysis will be conducted on NCMT and NM in the subsequent section. Fig. S7 (Supporting information) illustrates the rate performance and respective curves of NCMT and NM electrodes at various rates. The NCMT electrode exhibits higher rate capacities from 0.2 C to 10 C compared to the NM electrode, along with reduced polarization and smoother charge-discharge curves across various rates, attributed to the mitigation of Na+/vacancy ordering through Cu/Ti co-doping. Additionally, the improved Na+ transport kinetics were also evaluated by the cyclic voltammetry (CV) and the galvanostatic intermittent titration technique (GITT) tests. As shown in Fig. S8 (Supporting information), Both NCMT and NM electrodes display three pairs of redox peaks in CV curves at a scan rate of 0.1 mV/s, and the peak current density increased with the scan rate. According to Randles−Sevcik equation (Eq. S1 in Supporting information), the NCMT delivers a higher apparent Na+ diffusion coefficient in both oxidation and reduction peaks compared to the NM electrode. Likewise, the comparison of Na+ diffusion coefficients derived from GITT curves and Eq. S2 (Supporting information), presented in Fig. S9 (Supporting information), illustrates that the NCMT electrode shows a higher and relatively stable DNa+ (1.03 × 10⁻¹⁰ cm2/s) in contrast to NM electrode (5.21 × 10⁻¹¹ cm2/s). It is worth stating that the diffusion coefficient of NM electrode has large fluctuations, which may be ascribed to the Na+/vacancy ordering arrangements. Thus, aforementioned results demonstrate that co-doping can mitigate of Na+/vacancy ordering and effectively enhances the cyclic stability and kinetic properties of the materials.
Figure 2
Figure 2.
(a) The first charge-discharge curves within 2.5–4.15 V at 0.1 C for NM and NCMT electrodes. (b) Cycling performance of NM and NCMT electrodes at 2 C within 2.5–4.15 V. (c) CV profiles at a scan rate of 0.1 mV/s within 2.5–4.25 V of NCMT electrode. (d, e) The charge-discharge curves from the first to the fifth cycles in the voltage range of 2.5–4.25 V of NM and NCMT. (f) Rate performance of NM and NCMT electrodes from 0.1 C to 5 C in the voltage range of 2.5–4.25 V. GITT profiles for (g) NCMT and (h) NM electrodes. (i) Comparison of cycle performance at 1 C within 2.5–4.25 V. (j) The fitted Rct of NCMT and NM electrodes.
Furthermore, the electrodes are tested at higher upper cut-off voltage of 4.25 V. Fig. 2c displays the initial five CV profiles of NCMT at a scan rate of 0.1 mV/s within 2.5–4.25 V. The profiles exhibit a good overlap, indicating excellent reversibility during Na+ insertion/extraction [20,32]. In contrast, the CV curves of NM (Fig. S10 in Supporting information) exhibit increasing polarization and decreasing peak current over cycles, indicating inferior reversibility and sluggish kinetics, may be potentially linked to the irreversible structural transformation of P3-O3 at about 4.25 V [11,14]. As shown in Fig. 2d, the NM electrode shows an initial capacity of 148.8 mAh/g with ICE of 82.7%. However, significant capacity decay occurs, and the long voltage plateau around 4.25 V markedly shortens with cycling, likely due to irreversible P3-O3 phase transition. In contrast, NCMT electrode delivers a discharge capacity of 111.1 mAh/g with ICE of 85.1%. The voltage plateau around 4.25 V becomes more sloping and is better preserved with cycling, suggesting the restrained undesired phase transition as observed in other layered oxide cathode (Fig. 2e) [33]. Meanwhile, the voltage plateau below 4 V becomes smoother, suggesting mitigation of Na+/vacancy ordering. The rate performance also shows a significant improvement, achieving a discharge capacity of 47.3 mAh/g at 5 C, while NM only reaches 3.4 mAh/g (Fig. 2f). The charge-discharge curves at different rates (Fig. S11 in Supporting information) exhibit minimal polarization, further confirming the superiority of the NCMT electrode. The GITT test was conducted to analyze the Na+ transport kinetics in the voltage range of 2.5–4.25 V. As shown in Figs. 2g and h, it is evident that DNa of NCMT slightly decreases to 10−12 cm2/s above 4.2 V, whereas that of NM has already dropped to 10−15 cm2/s. This suggests that the Cu/Ti co-doping effectively enhances Na+ diffusion in the high-voltage region by suppressing undesired phase transition, which will be discussed in the subsequent section. Additionally, the cycling performance in the voltage range of 2.5–4.25 V is compared. As anticipated, the NCMT exhibits outstanding cycling performance, retaining 75.7% of its capacity after 300 cycles at 1 C, a significant enhancement over the NM (47.3%) (Fig. 2i and Fig. S12 in Supporting information). Notably, the coulombic efficiency of NM during cycling is consistently lower than that of NCMT, indicating severe interfacial side-reactions and structural degradation. In contrast, the coulombic efficiency of NCMT is generally over 99%, indicating superb electrochemical reversibility. The electrochemical impedance spectroscopy (EIS) for NCMT and NM electrodes after different cycles, along with their corresponding fitting values (Fig. 2j, Figs. S13 and S14, Table S8 in Supporting information). The EIS analysis reveals that the NCMT electrode exhibits a lesser growth in surface film impedance (Rsf) and charge transfer impedance (Rct) after various cycles, compared to the NM electrode. This suggests that NCMT undergoes less structural damage and side reactions [34,35], which is also evidenced by XRD and SEM characterization of the cycled electrodes (Figs. S15 and S16 in Supporting information). Based on the above analysis, it is clear that Cu/Ti co-doping significantly enhances the cyclic stability and kinetic performance of the material, thus positioning the NCMT cathode as a highly promising candidate for SIB.
In order to comprehend the impact of Cu/Ti co-doping on the structural evolution, ex situ XRD was conducted at different discharge and charge states. For the NCMT sample (Figs. 3a and b), as Na+ is extracted, the (003) and (006) peaks shifted to lower angles, whereas (101), (012) and (015) peaks shifted to higher angles due to increased electrostatic repulsion between adjacent oxygen layers and a decrease in the radius of the transition metal ions [17]. Of note, the diffraction peaks of P3 phase remained predominant until the electrode was charged to 4.25 V, indicating no obvious structural transformation. During subsequent discharge process, all diffraction peaks returned to initial positions, demonstrating the excellent structural reversibility. Regarding the NM sample (Fig. S17 in Supporting information), the diffraction peak displayed a similar shift until the electrode is charged to 4.15 V. Upon charging to 4.25 V, the (003), (006) and (015) peaks of P3 phase disappeared, while two diffraction peaks around 17° and 43° degrees emerged, possibly corresponding to the O3 phase [13,30]. During the discharge process, disappeared peaks of P3 phase were not observed until 3.6 V, suggesting sluggish phase transition processes. Therefore, the NM sample undergoes a P3-O3 phase transition around 4.25 V, leading to large volume change and structural stress, ultimately deteriorating the electrochemical properties. In contrast, the Cu-Ti co-doping effectively suppresses the undesired phase transitions, as shown in the structural evolution schematic in Fig. 3c, contributing to outstanding cycling performance and rate capacities.
Figure 3
Figure 3.
(a) Ex situ XRD patterns of NCMT electrode at various discharge and charge states and corresponding magnified region of 15°–16.5° on the left. (b) The corresponding states of the ex situ XRD patterns in the charge and discharge profiles. (c) The structural evolution schematic for NCMT sample.
The stability of the cathode materials against water is crucial for both fundamental research and future industrialization. Therefore, an accelerated ageing experiment was conducted, during which the samples were soaked in water for 4, 9 and 14 days and subsequently dried at 80 ℃ overnight. As shown in Fig. 4a and Fig. S18 (Supporting information), the XRD patterns of water-soaked NCMT sample have remained virtually unchanged, indicating the superior structural stability against water. It may be ascribed to the high electrochemical redox potential of Cu2+, which makes it difficult to extract bulk Na+ [19,36]. This is corroborated by the XRD patterns of the samples doped with Cu (NC3M) and Ti (NMT7) separately (Fig. S19 in Supporting information). In contrast, a hydration peak appeared in the XRD pattern of water-soaked NM for 4 d, originating from Na+/H3O+ exchange process [21], consistent with recent report [15]. When the NM sample was soaked in water for 14 d, the XRD pattern shows a decrease in the relative intensity and broadening of the (003)P3 peak, indicating more severe structural degradation. Additionally, SEM images of the water-soaked samples confirmed that both samples maintained their initial nanoplate-like morphology (Fig. 4b and Fig. S20 in Supporting information).
Figure 4
Figure 4.
(a) The magnifying XRD patterns of water-soaked NM and NCMT samples for 4 d. (b) The SEM image of water-soaked NCMT sample for 4 d. (c, d) The first charge-discharge curves of water-soaked NCMT and NM for 4 d in the voltage range of 2.5–4.15 V. (e) The comparison of rate performance between water-soaked NCMT for 4 d and pristine NCMT electrodes from 0.1 C to 10 C. (f) Cycle performance of water-soaked samples for 4 d within 2.5–4.15 V at 2 C. (g) Cycle performance of water-soaked samples for 4 d within 2.5–4.25 V at 1 C.
Furthermore, electrochemical properties tests were performed on the water-soaked materials. Figs. 4c and d depict the charge-discharge curves before and after water soaking for 4 d The water-soaked NCMT showed almost no capacity loss, whereas NM show a capacity loss of 3.4 mAh/g after water soaking, possibly due to the extraction of bulk Na+ and limited Na+ transport resulting from hydrate phase [37]. The rate performance was also compared, with water-soaked NCMT delivering a similar capacity delivery to the pristine sample at different rates, while the rate performance of NM decreased significantly (Fig. 4e and Fig. S21 in Supporting information). Meanwhile, water-soaked NCMT displayed excellent cycling stability either in the voltage range of 2.5–4.15 V or 2.5–4.25 V, while the NM sample experienced severe decay (Figs. 4f and g). Furthermore, to further illustrate the stability against water, galvanostatic charge/discharge (GCD) tests of water-soaked NM and NCMT for 14 d were performed. The NM electrode only shows a specific capacity of 89.6 mAh/g in the voltage range of 2.5–4.25 V, while that of NCMT is 104.4 mAh/g. Compared to pristine samples, the NM electrode demonstrated a noteworthy capacity loss (59.2 mAh/g), whereas the NCMT only reduced the capacity by about 6.7 mAh/g. These results demonstrate that NCMT exhibits outstanding stability against water, with minimal structural and electrochemical changes.
A full cell was constructed to evaluate the potential applications of the material, utilizing hard carbon as the negative electrode. A schematic illustration of the full cell is presented in Fig. 5a. The reversible capacity of the hard carbon was evaluated in the half-cells (Fig. S23 in Supporting information), and a presodiated strategy was performed prior to assembling the full cell [38]. The first charge/discharge profile of the NCMT//hard carbon full cell is depicted in Fig. 5b, showing a reversible capacity of 76.6 mAh/g and an ICE of 92.4%. Furthermore, as illustrated in Fig. 5c, it exhibits exceptional rate performance, with capacities of 75.3, 73.1, 71.5 and 68.9 mAh/g at 0.2, 0.5, 1 and 2 C, respectively. Even when reverted to 0.1 C, it still demonstrates a reversible capacity of 74.2 mAh/g. Additionally, it exhibits a capacity delivery of over 90% from 0.1 C to 2 C compared to the capacity at 0.1 C (Fig. 5d). When cycled at 0.5 C for 150 cycles, a capacity retention of 81% was achieved (Fig. 5e). These outstanding electrochemical properties highlight the material's promise for practical applications.
Figure 5
Figure 5.
(a) Schematic illustration of the Na-ion full cell. (b) The first charge and discharge curves of full cell in the voltage range of 2.5–4.05 V. (c) The rate performance from 0.1 C to 2 C. (d) Capacity retention at different current densities. (e) The cycling performance when cycled at 0.5 C.
In conclusion, the P3-type cathode material (Na0.67Ni0.33Mn0.67O2) was successfully modified through Cu/Ti co-doping and comprehensively investigated regarding its structure, electrochemical properties, and the stability against water. The Cu/Ti co-doped material demonstrated excellent cycling performance, maintaining 81.9% capacity retention at 2.5–4.15 V at 2 C after 500 cycles and 75.7% of the initial capacity at 1 C after 300 cycles, even at high upper cut-off voltages of 4.25 V. It can be attributed to the mitigation of Na+/vacancy ordering and the suppression of undesired P3-O3 phase transition around 4.25 V. Additionally, the material demonstrated minimal growth of charge transfer impedance, maintaining a similar crystal structure and morphology as the pristine sample after cycles. Surprisingly, XRD characterization revealed that the Cu/Ti co-doping material is stable in water with no production of hydrated phases, and the water-soaked material exhibited superior electrochemical properties. Finally, full cells employing hard carbon as an anode displayed good rate and cycling performance, indicating that Cu/Ti co-doping is a feasible and effective strategy to improve the cathode materials for SIBs.
Declaration of competing interest
The authors declare that they have no known competing financial interests or personal relationships that could have appeared to influence the work reported in this paper.
CRediT authorship contribution statement
Shengyu Zhao: Writing – original draft, Writing – review & editing. Xuan Yu: Writing – original draft, Writing – review & editing. Yufeng Zhao: Writing – review & editing.
Acknowledgments
This work is supported by the National Natural Science Foundation of China (Nos. 22179077, 51774251, 21908142), Shanghai Science and Technology Commission's "2020 Science and Technology In-novation Action Plan" (No. 20511104003), Natural Science Foundation in Shanghai (No. 21ZR1424200).
Supplementary materials
Supplementary material associated with this article can be found, in the online version, at doi:10.1016/j.cclet.2024.109933.
[1]
N. Yabuuchi, K. Kubota, M. Dahbi, et al., Chem. Rev. 114 (2014) 11636–11682. doi: 10.1021/cr500192f
[2]
R. Chen, D.S. Butenko, S. Li, et al., Chin. Chem. Lett. 6 (2023) 108358.
T. Cai, M. Cai, J. Mu, et al., Nanomicro Lett. 16 (2023) 10.
[37]
L. Mu, Q. Hou, Z. Yang, et al., J. Electrochem. Soc. 166 (2019) A251–A257. doi: 10.1149/2.0881902jes
[38]
Y. Xiao, H.R. Wang, H.Y. Hu, et al., Adv. Mater. 34 (2022) 2202695. doi: 10.1002/adma.202202695
Figure 1
XRD patterns and Rietveld refinement plots of (a) NM and (b) NCMT samples. (c) Crystal structure schematic of NCMT sample. (d) SEM image of NCMT sample. The typical (e) TEM image and (f) HRTEM image of NCMT sample. (g) Energy dispersive spectroscopy (EDS) mapping of NCMT sample. XPS spectra of (h) Ni, (i) Mn, (j) Cu and (k) Ti elements for the NM and NCMT samples.
Figure 2
(a) The first charge-discharge curves within 2.5–4.15 V at 0.1 C for NM and NCMT electrodes. (b) Cycling performance of NM and NCMT electrodes at 2 C within 2.5–4.15 V. (c) CV profiles at a scan rate of 0.1 mV/s within 2.5–4.25 V of NCMT electrode. (d, e) The charge-discharge curves from the first to the fifth cycles in the voltage range of 2.5–4.25 V of NM and NCMT. (f) Rate performance of NM and NCMT electrodes from 0.1 C to 5 C in the voltage range of 2.5–4.25 V. GITT profiles for (g) NCMT and (h) NM electrodes. (i) Comparison of cycle performance at 1 C within 2.5–4.25 V. (j) The fitted Rct of NCMT and NM electrodes.
Figure 3
(a) Ex situ XRD patterns of NCMT electrode at various discharge and charge states and corresponding magnified region of 15°–16.5° on the left. (b) The corresponding states of the ex situ XRD patterns in the charge and discharge profiles. (c) The structural evolution schematic for NCMT sample.
Figure 4
(a) The magnifying XRD patterns of water-soaked NM and NCMT samples for 4 d. (b) The SEM image of water-soaked NCMT sample for 4 d. (c, d) The first charge-discharge curves of water-soaked NCMT and NM for 4 d in the voltage range of 2.5–4.15 V. (e) The comparison of rate performance between water-soaked NCMT for 4 d and pristine NCMT electrodes from 0.1 C to 10 C. (f) Cycle performance of water-soaked samples for 4 d within 2.5–4.15 V at 2 C. (g) Cycle performance of water-soaked samples for 4 d within 2.5–4.25 V at 1 C.
Figure 5
(a) Schematic illustration of the Na-ion full cell. (b) The first charge and discharge curves of full cell in the voltage range of 2.5–4.05 V. (c) The rate performance from 0.1 C to 2 C. (d) Capacity retention at different current densities. (e) The cycling performance when cycled at 0.5 C.


 DownLoad:


 下载:
下载:


