Guangxi Key Laboratory of Low Carbon Energy Materials, Guangxi New Energy Ship Battery Engineering Technology Research Center, Guangxi Scientific and Technological Achievements Transformation Pilot Research Base of Electrochemical Energy Materials and Devices, School of Chemistry and Pharmaceutical Sciences, Guangxi Normal University, Guilin 541004, China
b.
College of Materials and Chemical Engineering, Guangxi Key Laboratory of Calcium Carbonate Resources Comprehensive Utilization, Hezhou University, Hezhou 542899, China
c.
School of Civil Engineering and Architecture, Center for the Structure of Advanced Matter, School of Electronic Engineering, Guangxi University of Science and Technology, Institute of New Building Materials and Engineering Applications, Liuzhou 545006, China
* Corresponding authors. E-mail addresses: fylai112@163.com (F. Lai)
zxhui016@163.com (X. Zhang). 1 These authors contributed equally to this work.
Received Date:
17 November 2023 Accepted Date:
29 February 2024 Revised Date:
17 December 2023 Available Online:
15 September 2024
Abstract:
The O3-Na0.85Ni0.2Fe0.4Mn0.4O2 layered oxide cathode material possesses the advantages of high specific capacity, low cost, and simple synthesis. However, sluggish kinetics and complicated phase transition caused by the large size difference between Na+ and tetrahedral gaps lead to poor rate and cycling performance. Therefore, a scalable and feasible strategy was proposed to modulate local chemical environment by introducing Mg2+ and B3+ into O3-Na0.85Ni0.2Fe0.4Mn0.4O2, which can distinctly improve kinetic transport rate as well as electrochemical performance. The capacity retention of O3-(Na0.82Mg0.04)(Ni0.2Fe0.4Mn0.4)B0.02O2 (NFMB) increases from 43.3% and 12.4% to 89.5% and 89.0% at 1 C and 3 C after 200 cycles, respectively. Moreover, the electrode still delivers high rate capacity of 93.9 mAh/g when current density increases to 10 C. Mg2+ ions riveted on Na layer act as a "pillar" to stabilize crystal structure and inhibit structural change during the desodiumization process. B3+ ions entering tetrahedral interstice of the TM layer strengthen the TM-O bond, lower Na+ diffusion energy barrier and inhibits the slip of TM layer. Furthermore, the assembled full batteries with the modified cathode material deliver a high energy density of 278.2 Wh/kg with commercial hard carbon as anode. This work provides a strategy for the modification of high-performance SIB layered oxide materials to develop the next-generation cost-effective energy storage grid systems.
Lithium-ion batteries (LIBs) have been widely used in consumer electronics, electric vehicles and energy storage due to long cycling life and high energy density [1–4]. However, the shortage of lithium resources makes a dimmed application market prospect of LIBs [5–7]. Currently, sodium ion batteries with abundant resources, high reserves, and environmentally friendly have been considered an extremely competitive energy storage devices [8–10]. The cathode material is the core component of battery and determines energy and power density [11–13]. Among cathode materials, sodium-based layered transition metal oxides (NaxTMO2) have received widespread attention due to many advantages, such as high theoretical capacity, simple synthesis process, and similar crystal structure [14–16]. In the layered oxide family, the O3-type layered oxide possesses sufficient Na+ (x > 0.8) in the unit cell and is more suitable for full cell applications.
Among O3-type layered oxides, Na0.85Ni0.2Fe0.4Mn0.4O2 (NFM) is an attractive cathode material due to its high reversible capacity (120 mAh/g) and cost-effectiveness. However, one of the challenges of the NFM is the slow migration of Na+, resulting in sluggish kinetics [17–19]. In the layered framework of NFM, tetrahedral sites and octahedral sites are connected to each other by sharing anionic triangular faces [20–22]. The migration path of Na+ ions is tetrahedral site → triangular face → octahedral site. NFM exhibits a higher migration barrier (800 and 200 meV for dumbbell and tetrahedral hops, respectively) due to size differences in Na+ radius and tetrahedral interstitial positions [18,23]. The general routes to improve the Na+ diffusion coefficient include adjusting the coordination environment of the embedding site, expanding the structural gap, and optimizing the diffusion path [18,24,25]. Another tricky issue is that NFM usually suffers from complicated phase transitions during the charge and discharge process. Many reports have revealed that NFM undergoes a series of phase transitions (O3hex.-P3hex.-O3hex) due to the slip of M layer [15,26–29]. Phase transitions cause huge volume change and high local stress, resulting in many microcracks in electrode [30,31]. Moreover, the continuous consumption of electrolyte and interfacial side reactions further expand these microcracks, which results in more serious degradation of electrode performances regarding cycling stability and rate capability [32,33].
Doping modification has been the main method to solve the above issues. Doping with active/inactive metal ions can enhance the diffusion dynamic of Na+ ion and structural stability of bulk [34–36]. Many literatures reported that Mg2+ with a relatively low charge number locally forms polyhedral groups [M2+O6] with high negative charge number. The groups can produce strong electrostatic attraction for the adjacent Na+ in Na layers and the remaining Na+ stabilize structure [37–39]. The doped B3+ is able to occupy tetrahedral interstitial of the packed oxygen in TM layer due to its smaller ionic radius, which expands cell volume. The high B-O bond energy can strengthen the TM-O bond and stabilize the crystal structure [40–43]. Although individual Mg2+ and B3+ doping has made some progress in previous reports, the codoping Mg2+/B3+ to modulate the local chemical environment on crystal structure and electrochemical performance is stagnant.
In this work, the codoping with Mg2+ and B3+ ions was proposed to regulate the local chemical environment to the modified O3-(Na0.82Mg0.04)(Ni0.2Fe0.4Mn0.4)B0.02O2 (NFMB) cathode material with improved diffusion kinetics, structural stability. Density functional theory (DFT) calculations was used to explore the regulation of the local chemical environment by Mg2+/B3+ doping. The introduced Mg2+/B3+ into the NFM bulk structure helps to strengthen TM-O bond, reduce migration barrier for Na+ ions and suppress the complicated phase transition. The electrochemical test results show that the co-doping modification improve the cycling retention and rate capability. Moreover, the capacity retention of the NFMB cathode material in assembled sodium-ion full batteries were tested using commercial hard carbon as anode material.
DFT calculation was used to theoretically study the possible effect of Mg2+/B3+ doping on local chemical regulation and a 2 × 2 × 1 (Na12-xMgxNi2Fe5Mn5BzO24) supercell with/without Mg2+/B3+ substitution was constructed (Figs. 1A and B). In the supercell, one Mg2+ was used to replace Na+ and one B3+ was used to occupy tetrahedral interstitial of the packed O in TM layer. The possible effect of doping on the structure and local chemical environment were studied. According to the crystal structure, the slab distance between the TM layer and Na layer in NFM and NFMB was calculated. Obviously, both the TM layer and the Na layer shrink after Mg2+/B3+ doping, indicating that Mg2+/B3+ doping changes the local chemical environment. Charge density difference and Bader charge analysis were further used to reveal the reason for the shrinkage of TM layer. As shown in Figs. 1C and D, there is an obvious electron transfer phenomenon between Ni/Fe/Mn/B and the surrounding O atoms. In addition, Bader charge analysis (Figs. S2 and S3 in Supporting information) analysis further shows that B atoms transfer more electrons than Ni/Fe/Mn atoms, indicating that the B-O bond is stronger than the Ni/Fe/Mn-O bond. The interaction between TM and O was further analyzed using crystal orbital Hamilton populations (COHP). Figs. 1F and G show the B-O bond with the largest integrated COHP (ICOHP), indicating that the chemical bond is the strongest and can better improve structural stability. In addition, Mg2+ with a smaller ionic radius than Na+ (0.72 Å for Mg2+ and 1.02 Å for Na+) and stronger electronegativity (1.31 for Mg and 0.93 for Na) exbibits greater effect on the nearby O layer [44]. The electrostatic attraction causes slight shrink of the Na layer spacing. During high-rate cycling, Mg2+ in the Na+ layer serves as a "pillar" to inhibit the collapse of the structure in c direction. Benefiting from the Mg2+/B3+ co-doping, the TM layer of the NFMB is significantly shortened (Fig. 1E), which reduces the interlayer spacing between TM layers and Na layers. In summary, DFT calculation results show that the Mg2+/B3+ doping is beneficial to structural stability and diffusion kinetics of ions.
Figure 1
Figure 1.
DFT calculation to disclose the possible effect on local chemistry after Mg2+/B3+ doping: The obtained ground state structures of (A) NFM and (B) NFMB with lowest DFT total energy considering. Charge density difference analyses of (C) NFM and (D) NFMB. (E) The obtained TM and Na layer spacing according to the ground state structure. COHP analyses of TM-O bonds in (F) NFM and (G) NFMB.
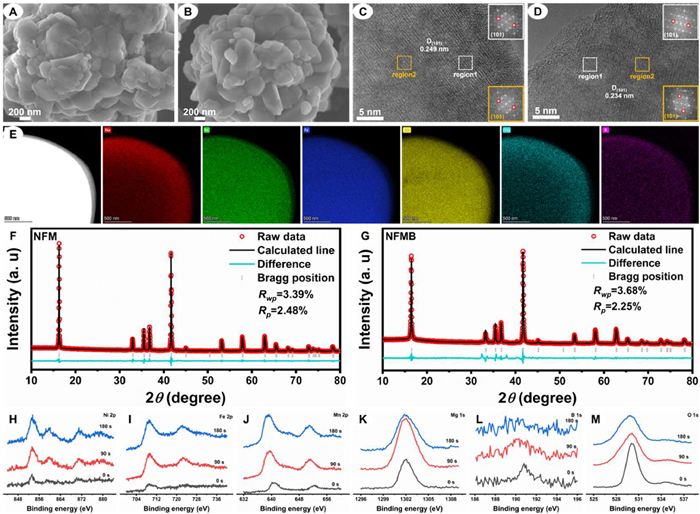
The NFM and NFMB were prepared using sol-gel method and high-temperature solid phase method using Mg(NO3)2 and NaBH4 as doping agents. The chemical composition of the NFMB was analyzed by inductively coupled plasma-atomic emission spectrometry (ICP-AES), which is basically consistent with the theoretical content (Table S1 in Supporting information). The micromorphology of the samples was observed by field emission scanning electron microscopy (FESEM). All samples were ellipsoid-like and composed of irregular nanoparticle agglomerations (Figs. 2A and B). The crystal structure was studied by X-ray diffraction (XRD) tests. All samples have a typical O3-type layered structure and the space group is R3m. The Rietveld refinement method was used to fit the XRD patterns (Figs. 2F and G). A lower Rwp indicates that the fitting results have higher credibility and detailed structural information is shown in Tables S2 and S3 (Supporting information). Mg2+ occupies the octahedral 3a Wyckoff site in Na layer, while B3+ occupies the tetrahedral interstitial site in TM layer. The corresponding structure of the NFMB is shown in Fig. 1B. Interestingly, all the lattice parameters of a, c and v decrease after Mg2+/B3+ doping. The replacement of partial Na+ by Mg2+ will cause shrinking of Na layers, and the entry of B3+ into the tetrahedral interstitial of TM layer significantly shrink the TM layers. The higher c/a and smaller v are beneficial to Na+ ion diffusion and framework stability [18,24]. As shown in Fig. 1E, the calculated lay distance of the TM and Na of the NFMB is 1.975 and 3.109 Å. While the distances of the NFM is 2.075 and 3.115 Å, respectively. The shrinkage of the TM layer contributes to structural stability due to the enhancement of TM-O bonds, which originates from the suppression of the deformation and slip of the TM layer during Na+ intercalation/deintercalation. Therefore, the Mg2+/B3+ doping improves the framework stability and the mobility of Na+ions, further enhancing the overall electrochemical performances of electrode. High-resolution transmission electron microscopy (HR-TEM) was further used to study the microstructure of the NFM and NFMB (Figs. 2C and D). The main structure of the NFM shows a good layered structure and the lattice stripes with a layer spacing of 0.249 nm belong to (101) crystal plane. In contrast, the interlayer spacingof the NFMB is reduced to 0.234 nm. Mg2+/B3+ doping into the crystal structure can reasonably explain the change in interlayer spacing, which is consistent with theoretical calculation and Rietveld refinement result. In addition, the energy dispersive spectroscopy (EDS) shows the uniform distribution of Na/Ni/Fe/Mn/Mg/B/O elements in the NFMB (Fig. 2E). In order to further study the distribution of Mg/B elements in the NFMB microspheres, X-ray photoelectron spectroscopy (XPS) was used for in-depth analysis. The characteristic diffraction peaks of Mg-O and B-O bonds are still detected as the etching time is 180s (Figs. 2H–M). In summary, DFT calculation and experimental characterization indicate that the local chemical environment changes of the NFM after Mg2+/B3+ doping.
Figure 2
Figure 2.
SEM images of (A) NFM and (B) NFMB. HR-TEM images of (C) NFM and (D) NFMB. (E) EDS-mapping images of the NFMB. Rietveld refinement of the XRD patterns for (F) NFM and (G) NFMB. XPS spectra of (H) Ni 2p, (I) Fe 2p, (J) Mn 2p, (K) Mg 1s, (L) B 1s and (M) O 1s of the NFMB in different etching depths.
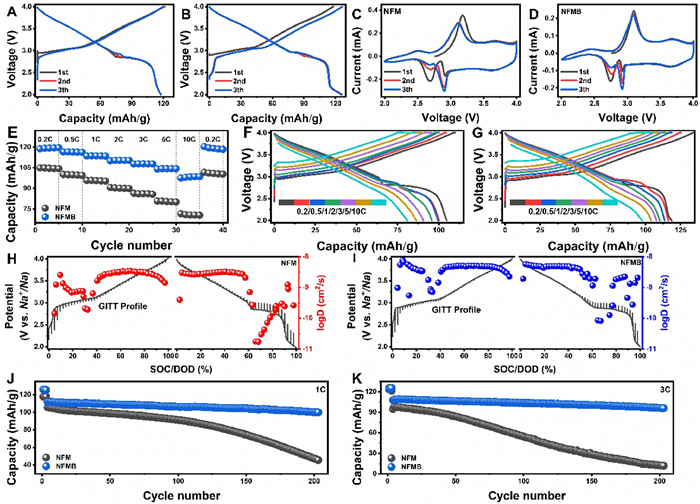
The regulation effect of local chemical environment on the electrochemical performances was studied half-cells with metallic Na as counter electrode. The charge and discharge curves of the NFM is shown in Fig. 3A. An obvious platform can be observed and the first discharge capacity is only 117.2 mAh/g with an initial coulombic efficiency of 96.6%. After regulating the local chemical environment induced by Mg2+/B3+ co-doping, the charge and discharge curves of the NFMB appear significant change. The slope end of the initial charge and discharge curve is gentler, contributing more capacity (Figs. 3B). Moreover, the co-doping increases the first coulombic efficiency of the electrode from 96.6% to 106.7%. The cyclic voltammetry curves (CV) at 0.1 mV/s are shown in Figs. 3C and D. The first redox peak of the NFM electrode is located at 3.18/2.91 V and the first redox peak of NFMB is located at 3.10/2.93 V. The gap between the redox peaks of the NFMB is 0.17 V which is smaller than that of the NFM of 0.27 V. In addition, the CV curves of the NFMB nearly overlap, indicating lower electrode polarization and better stable structure.
Figure 3
Figure 3.
Galvanostatic charge/discharge curves of (A) NFM and (B) NFMB in the first three cycles. CV curves of (C) NFM and (D) NFMB at 0.1 mV/s. (E) Rate capability of NFM and NFMB at 0.2, 0.5, 1, 2, 3, 5, 10 C. Charge/discharge profiles at various rates for (F) NFM and (G) NFMB. GITT curves and Na+ diffusion coefficients of (H) NFM and (I) NFMB. Cycling performance of NFM and NFMB at (J) 1 C and (K) 5 C.
Rate capacity was tested in the current density range of 0.2–10 C, as shown in Figs. 3E–G. The rate capacity of NFMB is much high that of NFM. Even when current density increases to 10 C, the rate capacity of NFMB (98.45 mAh/g) is higher than that of NFM (70.86 mAh/g). As the current density comes back to 0.2 C, the capacity of NFMB still maintains 119.30 mAh/g, which illustrating excellent reverssibility of NFMB electrode. Galvanostatic intermittent titration technique (GITT) was used to analyze the diffusion behavior of Na+ ions in the NFM and NFMB electrodes. The NFMB has smaller ΔEτ and IR. The detailed single-step GITT curve is shown in Fig. S6 (Supporting information). The GITT and corresponding Na+ diffusion coefficient (DNa+) curves of the second cycle the electrodes are shown in Figs. 3H and I, respectively. The voltage change during the relaxation process on the curve represents overpotential during the electrochemical reaction. The NFMB shows a smaller overpotential throughout the electrode process, indicating better kinetic property. The calculated average DNa+ of the NFMB by GITT is 5.68 × 10⁻⁹ cm2/s which is higher than that of the NFM (2.62 × 10⁻⁹ cm2/s), indicating that Mg2+/B3+ co-doping facilitates rapid ion diffusion. The CV curves of the electrodes at various scan rates of 0.1–1.0 mV/s are shown in Figs. S7A and C (Supporting information). As the scan rate increases, the redox peak shifts slightly due to electrode polarization. As shown in Figs. S7B and D (Supporting information), the peak current shows a good linear relationship with the square root of scan rate. The larger the slope demonstrates the faster migration Na+ ions. The NFMB has a higher slope than the NFM during charging and discharging processes. Fig. S8 (Supporting information) shows Nyquist plots of impedance spectra. The fitted values of Rs and Rct were listed in Table S4 (Supporting information). The fitting results illustrate that the Rct value of the NFMB only increases by 18.72 Ω after 100 cycles, much smaller than that of the NFM (4297.29 Ω). The results suggest the NFMB with lower migration barrier and faster Na+ transfer, which is beneficial to enhancing the reaction kinetics during cycling.
The effect of local chemical regulation on cycling stability was further studied (Figs. 3J and K). The capacity retention of the NFM and NFMB electrodes is 82.6% and 86.2% at 1 C and 3 C after 200 cycles, respectively, much higher than that of the NFM with 42.2% and 40.9% at 1 C and 3 C. In addition, the changing trend of the average output voltage/potential and energy density with the number of cycles at 1 C are shown in Fig. S9 (Supporting information). The average output voltage of NFMB is more stable and the energy density is higher than that of NFM. In addition, the dQ/dV in Fig. S10 (Supporting information) shows the curves of the NFMB almost overlap and do not shift, while the redox peak of the NFM attenuates and shifts significantly, indicating the NFMB has excellent structural reversibility after local chemical regulation. Because B3+ occupies the tetrahedral interstitial site in TM layer to stabilize the layered structure, while Mg2+ maintains more Na+ around, which is also conducive to structural stability during deep desodiumization [44].
In order to gain a deep understanding of the impact of the Mg2+/B3+ doping on structural stability, ex-situ XRD measurement was performed during the first charge and discharge process in Figs. 4A and B. At the initial stage, the diffraction peak belongs to O3 phase is well indexed. Upon Na+ desertion, the (003) diffraction peak splits into two peaks, and the intensity of (104) peak decreases gradually, indicating that the phase transition of O3→P3. Then O3 phase is completely transformed into P3 phase. Until charged to 4.0 V, the (003)P3 diffraction peak shifts to higher angle and the peak intensity decreases, reflecting the formation of OP2 phase. This phase will cause a sudden drop in the interlayer spacing (c). The sudden change is detrimental to the cycling performance. During sodiation, the NFM goes from OP2 to P3 phase and finally to O3 phase through a bi-phasic region of O3 and P3. As shown in Figs. 4C and D, the NFMB will undergo the same phase change process as to the NFM before 3.7 V. But when charged to 4.0 V, the NFMB does not undergo a P3→OP2 phase transition, remaining P3 phase. During the discharge process, the NFMB goes from P3 phase and finally to O3 phase through a bi-phasic region of O3 and P3. There are no changes in c-axis of the NFMB, which exhibits better structural stability. As shown in Fig. S11 (Supporting information), XRD test was performed on the NFM and NFMB after 100 cycles. The layered structure of NFM is almost completely collapsed, while the NFMB shows a typical O3-type layered structure with a space group of R3m. The microstructure information from HR-TEM and FFT analysis in Figs. S12A and B (Supporting information) shows the surface of the NFM particles has a salt-rock structure, while the NFMB particles still show layered structure. It also indicates that the NFMB electrode possesses a good O3-type layered structure after cycling.
Figure 4
Figure 4.
Charge/discharge profiles of (A) NFM and (C) NFMB electrodes. The corresponding ex-situ XRD patterns of (B) NFM and (D) NFMB electrodes at various charge/discharge states.
To further evaluate the performance of the NFMB cathode in practical application, a full cell was assembled using hard carbon (HC) as anode. The selected HC anode provides a reversible specific capacity of approximately 330 mAh/g with an initial coulombic efficiency of 78.0% and almost no capacity fading after 20 cycles (Fig. S13 in Supporting information). In the voltage range of 2.0–4.0 V, the charge-discharge profile of the full cell is smooth, which is similar to the profile of the NFMB//Na half-cell, indicating that the NFMB//HC full cell also maintains good kinetics characteristic and suppresses phase transition (Fig. 5A). As shown in Fig. 5B, the rate performance was tested at different current densities of 0.1–10 C, and the capacity was calculated based on the total loading mass of the cathode active material. The full cell obtains an average discharge capacity of 108.4 mAh/g at 0.2 C. The full cell still delivers a capacity of 89.8 mAh/g and 82.3 mAh/g at 5 C and 10 C. The cycle performance of the NFMB//HC full battery has also been verified. As shown in Figs. 5C and D, the capacity retention is 86.7% and 90.6% after 200 cycles at 1 C and 3 C, respectively.
Figure 5
Figure 5.
(A) Initial galvanostatic charge/discharge curve, (B) rate capability, and (C, D) cycling performance of NFMB/HC full cell.
In summary, the Mg2+/B3+ co-doped O3-(Na0.82Mg0.04)(Ni0.2Fe0.4Mn0.4)B0.02O2 (NFMB) was prepared and electrochemical performance can be significantly improved by regulating the local chemical environment. The results show that the capacity retentions of NFMB//Na half-cell are 82.6% and 86.2% at 1 C and 3 C after 200 cycles, which are much higher than that of NFM (42.2% and 40.9% at 1 C and 3 C). Mg2+/B3+ doping reduces the migration barrier and improve its dynamic characteristics. Mg2+ acts as a "pillar" to prevent the layered structure from collapsing in c direction during high-rate cycling. Moreover, B3+ doping strengthens the TM-O bond to inhibit interlayer slip and reduce lattice strain, improving structural stability of electrode. The NFMB//HC full cell delivers a high energy density of 278.2 Wh/kg. The strategy of doping-induced regulation of the local chemical environment provides a good idea for promoting the practical application of O3-type layered oxides.
Declaration of competing interest
The authors declare that they have no known competing financial interests or personal relationships that could have appeared to influence the work reported in this paper.
Acknowledgments
This research was supported by National Natural Science Foundation (Nos. 52364035, 52364036 and U23A20577), Guangxi Natural Science Foundation (Nos. 2022GXNSFAA035610 and 2022GXNSFAA035471), Guangxi Science and Technology Base and Talent Project (No. GUIKE AD23026038).
Supplementary materials
Supplementary material associated with this article can be found, in the online version, at doi:10.1016/j.cclet.2024.109722.
[1]
W. Zhao, K. Wang, X. Fan, et al., Angew. Chem. Int. Ed. 62 (2023) e202305281. doi: 10.1002/anie.202305281
Figure 1
DFT calculation to disclose the possible effect on local chemistry after Mg2+/B3+ doping: The obtained ground state structures of (A) NFM and (B) NFMB with lowest DFT total energy considering. Charge density difference analyses of (C) NFM and (D) NFMB. (E) The obtained TM and Na layer spacing according to the ground state structure. COHP analyses of TM-O bonds in (F) NFM and (G) NFMB.
Figure 2
SEM images of (A) NFM and (B) NFMB. HR-TEM images of (C) NFM and (D) NFMB. (E) EDS-mapping images of the NFMB. Rietveld refinement of the XRD patterns for (F) NFM and (G) NFMB. XPS spectra of (H) Ni 2p, (I) Fe 2p, (J) Mn 2p, (K) Mg 1s, (L) B 1s and (M) O 1s of the NFMB in different etching depths.
Figure 3
Galvanostatic charge/discharge curves of (A) NFM and (B) NFMB in the first three cycles. CV curves of (C) NFM and (D) NFMB at 0.1 mV/s. (E) Rate capability of NFM and NFMB at 0.2, 0.5, 1, 2, 3, 5, 10 C. Charge/discharge profiles at various rates for (F) NFM and (G) NFMB. GITT curves and Na+ diffusion coefficients of (H) NFM and (I) NFMB. Cycling performance of NFM and NFMB at (J) 1 C and (K) 5 C.
Figure 4
Charge/discharge profiles of (A) NFM and (C) NFMB electrodes. The corresponding ex-situ XRD patterns of (B) NFM and (D) NFMB electrodes at various charge/discharge states.


 DownLoad:


 下载:
下载:


 下载:
下载:
