Figure 1.
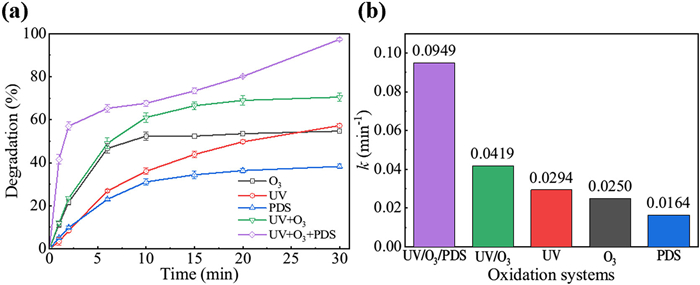
The degradation rates (a) and pseudo-first-order rate constants (b) of TC in different oxidation systems. Experimental conditions: [PDS0] = 5 mmol/L, [TC0] = 20 mg/L, [O3] = 8.4 mg/L, pH0 5.6.
Synergistic effects of peroxydisulfate on UV/O3 process for tetracycline degradation: Mechanism and pathways
Fengrui Yang , Debing Wang , Xinying Zhang , Jie Zhang , Zhichao Wu , Qiaoying Wang

Tetracycline (TC), one of the most widely used antibiotics, has been applied in clinics, livestock industry and agriculture. Previous studies reported that TC cannot be removed completely in most wastewater treatment plants [1], and the residual activated sludge contents high concentration of TC due to its tendency to adsorb onto soil and mineral particles by cation bridging and cation exchange [2]. Therefore, it is of extensive necessity to explore an efficient and economic treatment process of TC in wastewater. Over the past decade, several methods have been investigated for removing antibiotics from wastewater, including biological processes, adsorption, membrane processes, electrochemical reduction methods, and advanced oxidation processes (AOPs) [3–7]. Among these, AOPs, which involve the use of hydroxyl radicals (•OH) [8] and other oxidizing species like sulfate radical (SO4•−) [9], have shown promise for degrading micropollutants. Ozone, as a strong oxidant, has received considerable attention in wastewater treatment [10,11]. However, the ozone oxidation process has limitations such as low utilization rate, high cost, and incomplete mineralization of micro-pollutants [12]. To improve utilisation efficiency of ozone, combined ozone advanced oxidation technologies have been proposed, including O3/H2O2, O3/H2O2/UV and O3/UV [13].
The UV/O3 process has been applied for the degradation of organic compounds due to its mild conditions and high oxidation ability [14]. However, it has certain limitations, including the additional energy required for ozone generation and the dependence on operating parameters [15]. Recent research has shown that the coexistence of •OH and sulfate radicals (SO4•−) in the UV/O3/persulfate (PDS) process can enhance pollutant degradation [16]. This combination activates ozone and PDS simultaneously, leading to a synergistic effect and increased mineralization of recalcitrant pollutants [17]. However, the coexistence of antibiotics and high salinity in pharmaceutical and poultry wastewater has been commonly observed according to previous investigations [18]. Ions in high salinity wastewater, most as common free radical scavengers [19], potentially affect the performance of AOPs, while their impact on the UV/O3/PDS process remains unclear. Furthermore, it is now well established that the initial pH is a critical parameter when treating wastewater containing TC by AOPs. Under different pH, the properties of TC molecules vary and amounts of generated free radicals change [5,20]. Despite the promising application of the UV/O3/PDS process for the removal of TC, its degradation performance and mechanisms under different operation conditions have not been systematically studied yet.
Therefore, this study aims to assess the degradation performance and mechanisms of TC in wastewater by UV/O3/PDS process under various operating parameters. In particular, the synergistic effects of PDS on UV/O3 processes are discussed in detail. The specific objectives are to: (1) Investigate the performance of UV/O3/PDS process for the removal of TC; (2) Determine the impact of different operating parameters, i.e., the dosage of PDS, presence of different ions and initial pH; (3) Identify the dominant reactive oxidation species (ROS) during the UV/O3/PDS process; (4) Explore the plausible degradation pathway of TC in UV/O3/PDS process and quantify the toxicity of intermediates.
All information of the chemicals and reagents, analysis methods are provided in Texts S1 and S2 (Supporting information). All experiments were conducted in a 3 L quartz cylindrical reactor (Fig. S1 in Supporting information) at 25 ℃ without buffer to avoid interference of phosphate ions. Ozone was provided by a laboratory O3 generator (CH-ZTW, Guangzhou Chuanghuan Ozone Technology Co., Ltd., China) at a constant flowrate of 2 L/min (8.4 mg/L), and diffused into the bulk solution via a micro-porous diffuser placed at the mid-bottom of reactor. The exhausted gas was diverted and absorbed by saturated KI solution. A low-pressure mercury monochromatic UV lamp (254 nm) enfolded in a hollow quartz tube was placed in the centre of reactor, which was turned on 20 min before each experiment to ensure a stable light intensity. The UV lamp was calibrated at 2.5 mW/cm2 by a portable UV light meter (LS125, Shenzhen Linshang Technology Co., Ltd.). To initiate each batch experiment, a predetermined weight of PDS crystals were dissolved in 3 L deionized water, and TC at a desirable concentration was spiked into the solution. At pre-set intervals, 4.0 mL of the sample was collected in a vial and analysed immediately to avoid further degradation. All experiments were performed at least in triplicate.
The performances of different oxidation processes (O3, UV, PDS, UV/O3, and UV/O3/PDS) in degrading TC were compared to assess their synergistic enhancement (Fig. 1a). UV irradiation and PDS alone resulted in incomplete degradation, removing only 10.94 mg/L and 7.66 mg/L of TC, respectively within 30 min, indicating the presence of potentially toxic intermediates. In the UV/O3/PDS process, TC degradation exhibited a two-phase behaviour. Initially, 57.0% of TC was rapidly removed within 2 min, followed by a slower reaction rate. After 10 min, TC degradation resumed, and the residual TC was gradually decomposed over the next 20 min. This suggested the presence of refractory transformation products during TC degradation, with their further reaction acting as a rate-limiting step [21]. Calculations of pseudo-first-order rate constants (kobs) revealed that the UV/O3/PDS process exhibited significantly enhanced degradation performance, with a kobs of 0.0949 min−1, which was 2.3 times higher than UV/O3 and 3.2 times higher than UV alone (Fig. 1b). Similarly, the TC mineralisation rate in the UV/O3/PDS process shows a 50% enhancement compared to that of UV/O3 process (Fig. S2 in Supporting information). Furthermore, the synergy index (η) for the UV/O3/PDS process was determined to be 1.34 according to Eq. 1 [22], affirming a synergistic effect relative to each of the individual processes.
|
|
(1) |
To evaluate the feasibility of the UV/O3/PDS process, an economic analysis was conducted. The specific energy consumption (SEC) of different process was calculated to compare the electrical and chemical costs incurred per unit of treated pollutants (Text S3 in Supporting information) [23]. As delineated in Fig. S3 (Supporting information), although the SEC for PDS alone was elevated, it was observed that SEC of the integrated UV/O3/PDS process reduced and was lower than that of the UV/O3 process alone. This reduction can be attributed to the enhanced TC degradation efficacy observed in the UV/O3/PDS process. Moreover, the UV/O3/PDS process demonstrated the consistent and effective TC removal in different water matrices, including wastewater, tap water, and river water (Fig. S4 and Table S2 in Supporting information), underscoring its potential for practical applications.
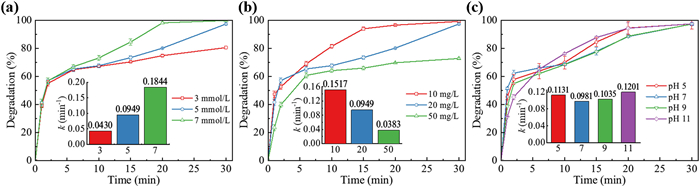
The impacts of PDS dosage, initial TC concentration and pH on TC degradation were then investigated. As shown in Fig. 2a, increasing the PDS dosage resulted in enhanced TC degradation, with degradation rates increasing from 74.8% to 98.1% within the first 20 min. This can be attributed to the greater generation of SO4•− and •OH when higher PDS dosages are combined with UV and O3, leading to improved TC removal. These findings emphasize the outstanding oxidizing ability of the integrated UV/O3/PDS process, enabling the degradation of high concentrations of pollutants with a moderate PDS dosage. As the initial concentration of TC increased from 10 mg/L to 50 mg/L (Fig. 2b), the removal rate of TC decreased from 96.5% to 69.7% after 20 min reaction, while the kobs dropped from 0.1517 min−1 to 0.0383 min−1. Inasmuch as the O3 concentration, PDS and UV dosage, as well as initial pH were kept constant through all the experiments, the reactive oxidation species generated in UV/O3/PDS process were supposed to be the same quantities. As the initial TC concentration increased, more competitive reactions occurred between TC and its degradation products. Interestingly, the kobs decreased from 0.1517 min−1 to 0.0949 min−1 when the initial TC concentration increased from 10 mg/L to 20 mg/L, but the final degradation rates of TC were close for both cases after 30 min, which indicated a longer retention time was necessary for removing high concentration of pollutants with a relatively low dosage of PDS. As illustrated by Fig. 2c, TC was almost completely destructed after 30 min in every batch experiment with varying initial pH, which proved the UV/O3/PDS process was effective in a wide range of operating pH. Interestingly, when the initial pH increased to 11, the phenomenon of intermediate accumulation did not occur at 2 min and TC was not degraded as rapidly as in other pH conditions when the reaction was just initiated. There are two possible explanations for this result. Firstly, a relatively acidic environment favours the generation of SO4•− radicals according to Eqs. 2 and 3 [5]. Secondly, SO4•− radicals tend to transfer into the weaker •OH radicals by excessive OH− at a strong alkaline condition [24]. Nevertheless, the UV/O3/PDS process seemed resilient to pH changes and could eliminate contaminants within a wide pH range in realistic conditions.
|
|
(2) |
|
|
(3) |
Previous studies have reported that the degradation processes of organic pollutants in complicated aqueous matrix were susceptible to the co-existing inorganic ions [25–27], while the impact of various ions on the degradation efficiency has become a controversial and much-disputed topic. Thus, a deeper understanding of the influence of various co-existing anions and ammonium on TC degradation is of great significance.
The effect of chloride ions (Cl−) on TC degradation was studied and the results are depicted in Fig. 3a. The presence of Cl− has almost no inhibitory effect on the degradation of TC in the UV/O3/PDS process. When the contents of Cl− increased from 0 to 5000 mg/L, the kobs dropped slightly (i.e., from 0.1078 min−1 to 0.0929 min−1). These results may be related to the dual effects of chloride anions on SR-AOP. Firstly, the reactive chlorine species (RCS) generated in the UV/O3/PDS process contributes to TC degradation. Previous research has established that SO4•− tends to oxidize Cl− to Cl• and generate •OH when pH is above 5.0 (Eqs. 4–6) [28]. Although Eq. 6 is reversible, due to the extremely fast reaction rate of the forward reaction, the reverse reaction becomes significant only when the pH is below 3.0 [29]. The generated ROS along with •OH was capable of degrading TC effectively in spite of their relatively weaker oxidation potentials than SO4•− [30]. Secondly, the presence of Cl− leads to a better dissolubility of O3 and a higher mass transfer constant, which almost compensates completely the scavenging of O3 by Cl− itself (Eqs. 7 and 8) when Cl− concentration is lower than 15 g/L [31]. Therefore, these findings suggest that the UV/O3/PDS process could be applied to the treatment of TC wastewater containing high contents of Cl−.
|
|
(4) |
|
|
(5) |
|
|
(6) |
|
|
(7) |
|
|
(8) |
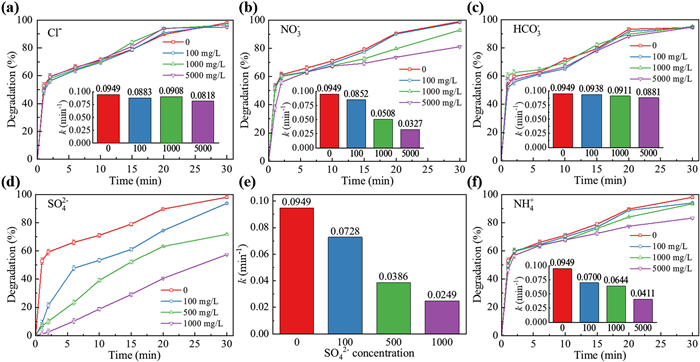
As illustrated in Fig. 3b, the degradation rate of TC dropped from 99.0% to 81.1% after 30 min with the increase of nitrate ions from 0 to 5000 mg/L, and the kobs declined significantly from 0.1255 min−1 to 0.0433 min−1, respectively. The NO3• is a weaker free radical compared with SO4•− (+ 2.3 ~+2.6 VNHE for NO3• and + 2.5 ~+3.1 VNHE for SO4•−) [32,33], and thus the degradation of TC is to be greatly suppressed when the majority of SO4•− are transformed into NO3•. However, Yu et al. showed that the presence of NO3− could slightly enhance the degradation efficiency of pollutants in UV/O3/PDS process, which was ascribed to the photosensitive effect of NO3− in the formation of •OH and O•− under UV irradiation (Eqs. 9 and 10) [34]. This discrepancy could be attributed to the distinct concentrations of NO3− in different studies, as the accelerative effect of NO3− was merely found when the concentration was relatively low (6–31 mg/L) [35]. Therefore, the NO3− concentration should be valued in UV/O3/PDS process.
|
|
(9) |
|
|
(10) |
Fig. 3c shows the variation of kobs was negligible from 0.0877 min−1 to 0.0814 min−1 with the increase of HCO3− concentration from 0 mg/L to 5000 mg/L. It is reported that HCO3− is a scavenger of •OH and SO4•− to form CO3•− [36]. However, the former investigation also indicated that the presence of HCO3− will not impact the performance of SR-AOP [37], which is in accordance with present study. It may be because that the quenching reaction between HCO3− and SO4•− is slower than that between HCO3− and •OH, which maintained a relatively high concentration of SO4•− in the bulk solution [38]. Besides, the introduction of HCO3− provides the buffer effect, and thus the pH of bulk solution will not decrease drastically during the reaction [39]. As the pH plays a critical role in ozonation, when the pH drops, the TC removal by ozone will be tremendously inhibited [40], which happens in non-buffered SR-AOP [41]. Thus, the constantly high rate of TC degradation by the ozonation process with HCO3− buffered solution can partly compensate for the quenching of •OH and SO4•−.
SO42− ions are common anions in industrial wastewater, especially for pharmaceutical factories [42], and the main products of SR-AOP [43]. However, there has been little discussion about the influence of SO42− on UV/O3/PDS. It is reported that SO42− can react with •OH to generate SO4•− (Eq. 11) [44], which enhances the removal efficiency of pollutants due to the higher redox potential of SO4•−. The contrary results were obtained in this study. The addition of 1000 mg/L SO42− prior to the reaction inhibited TC removal significantly as the degradation rate reduced from 98.0% to 57.4% after 30 min reaction (Fig. 3d), and the kobs reduced by 73.8% (Fig. 3e). In ozone treatment, high SO42− concentrations are known to accelerate ozone’s self-decomposition and enhance its mass-transfer constant, thereby generating smaller ozone gas bubbles [31]. Although this is advantageous for dissolving ozone gas in water [45], it poses a challenge for the combined UV/O3/PDS process. The increased bubble scatters UV light more extensively, thereby diminishing UV intensity. Given the unsatisfactory degradation efficiency of TC with O3 and PDS alone (Fig. 1), the reduced UV intensity resulted in lower TC degradation performance in the presence of excessive SO42−. Consequently, the dual role of SO42− needs careful consideration during the application of UV/O3/PDS process.
|
|
(11) |
The presence of ammonium ions was detrimental to the degradation of TC in UV/O3/PDS process (Fig. 3f). As ammonium concentration increased from 0 mg/L to 5000 mg/L, the removal rate of TC declined from 98.0% to 83.2% and the kobs reduced from 0.1078 min−1 to 0.0467 min−1, respectively. The reasons could be inferred as follows: (1) Under UV irradiation, the aqueous ammonium can be oxidized into nitrite and finally nitrate ions through photocatalytic degradation [41,46], and the nitrate ions are radical quenchers for •OH and SO4•− as discussed above; (2) PDS activated by UV light can react directly with ammonium ions at a rate constant of 4 × 10⁻⁶ mol L−1 min−1 [47], by which the TC degradation is competed and inhibited (Eqs. 12 and 13); (3) the hydrolysis of ammonium ions generates protons and thus reduces the pH of bulk solution during the reaction, exerting a negative influence on the SO4•− generation. Since ammonium ions are almost ubiquitous in all kinds of wastewater [48], a note of caution should be sounded before applying UV/O3/PDS process for wastewater treatment.
|
|
(12) |
|
|
(13) |
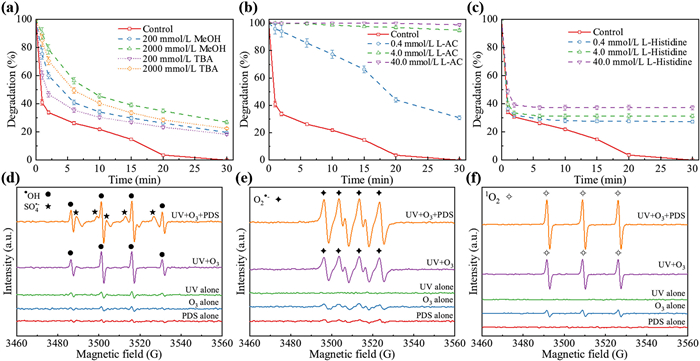
Quenching experiments were carried out to investigate the dominant ROS in various oxidation systems with methanol (MeOH) and tert‑butyl alcohol (TBA) [49]. As illustrated in Fig. 4a, the presence of MeOH and TBA inhibited TC degradation, and the inhibitory effects enhanced with the increase of dosage of MeOH and TBA. The percentage of residual TC was 18.3% and 19.6% by adding 200 mmol/L TBA and MeOH, respectively, which implied that •OH and SO4•− contributed to TC degradation. Nevertheless, the overall insignificant inhibition of TC degradation by EtOH and TBA indicated that •OH or SO4•− were not dominant ROS. Subsequent scavenging experiments with L-ascorbic acid (L-AC) and L-histidine were performed to examine the existence of O2•− and 1O2, respectively [50,51]. As shown in Figs. 4b and c, TC degradation was completely inhibited when adding 40.0 mmol/L of L-AC, while 72.8% of TC were still degraded with 40.0 mmol/L of L-histidine, which indicated that O2•− contributed more than 1O2 for TC degradation. Moreover, EPR spectra (Figs. 4d–f) confirmed the involvement of all aforementioned ROS, underlining their synergistic effect in TC degradation within the UV/O3/PDS process.
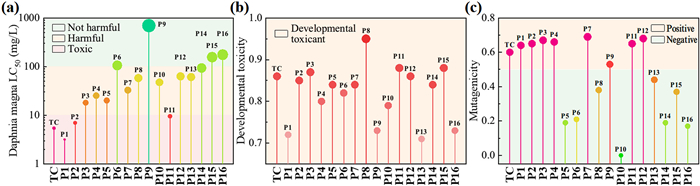
The transformation products (TP) of TC in UV/O3/PDS process were identified by UPLC-MS and the total ion chromatograms of TC degradation are presented in Fig. S5 (Supporting information). The possible degradation pathways were depicted in Fig. S6 in Supporting information and the detailed information of each intermediate was listed in Table S1 and Text S4 (Supporting information). Based on the comparison of isotope simulation and actual mass spectrum, 16 possible TP were speculated during TC degradation and 15 of them were captured. Then, the toxicity of intermediates generated during TC degradation was assessed, and three parameters were evaluated, i.e., Daphnia Magna LC50 (48 h), developmental toxicity and mutagenicity (Fig. 5). Daphnia Magna LC50 (48 h) represents the level of acute toxicity, namely, the concentration of a chemical that causes 50% of Daphnia Magna to die within 48 h. TC along with three of its degradation products were categorised as "Toxic". Especially for the decarbonylation product P1, its acute toxicity was even higher than TC, which may be ascribed to the higher toxicity of cyclopentenol than its counterpart [52]. For intermediates further oxidized, the acute toxicity was gradually alleviated by the breaking of benzene ring, and some small molecular products were labelled as “Not harmful”. The developmental toxicity of all intermediates as well as TC was considered as “Developmental toxicant”, but the mutagenicity of some intermediates was decreased and reckoned “Negative” in mutagenicity (e.g., P10, P14 and P16). Nevertheless, the comprehensive toxicity of each intermediate should be determined taking into consideration their concentration at various degradation durations. Therefore, some degradation products are more toxic than TC, while their concentration may be much lower than TC, thus bringing about degressive comprehensive toxicity throughout the degradation process [53].
In this study, the degradation mechanisms and performance of TC by UV/O3/PDS process were extensively investigated. The results demonstrate that PDS plays an outstanding synergistic role in the degradation of TC combing with the UV/O3 process. The removal rate of TC was significantly promoted in UV/O3/PDS process (97.3%) compared with UV/O3 process (70.5%). The increase of initial PDS dosage led to a faster degradation rate (kobs = 0.1844 min−1 for 7 mmol/L vs. Kobs = 0.0430 min−1 for 3 mmol/L), and the fluctuation of initial pH had limited impact on TC removal efficiency. It was also found that the existence of Cl− and HCO3− showed insignificant effect on TC abatement, even at a high concentration (5 g/L). However, the presence of NO3−, SO42− and NH4+ could inhibit TC removal, which acted as radical quenchers or induced competition reactions. Multiple ROS were all responsible for TC degradation in the UV/O3/PDS process and exhibited a synergistic effect. Two major degradation pathways have been speculated. Although some intermediates are estimated more toxic than TC, the final products are less harmful. The results obtained in this study proved that UV/O3/PDS process is capable of degrading TC effectively in wastewater.
The authors declare that they have no known competing financial interests or personal relationships that could have appeared to influence the work reported in this paper.
The authors are grateful for financial support from the National Natural Foundation of China (Nos. 52370045 and 51838009), Natural Science Foundation of Shanghai (No. 23ZR1467500), and Shanghai Rising-Star Program (No. 20QC1400300).
Supplementary material associated with this article can be found, in the online version, at doi:
R.P. Bisognin, D.B. Wolff, E. Carissimi, O.D. Prestes, R. Zanella, Environ. Technol. 42 (2021) 2292–2303. doi: 10.1080/09593330.2019.1701561
J. Hou, C. Wang, D. Mao, Y. Luo, Environ. Sci. Pollut. Res. 23 (2016) 1722–1731. doi: 10.1007/s11356-015-5431-5
Y. Chen, R. Yin, L. Zeng, W. Guo, M. Zhu, J. Hazard. Mater. 412 (2021) 125256. doi: 10.1016/j.jhazmat.2021.125256
S. She, J. Wang, J. Liu, et al., Chem. Eng. J. 426 (2021) 131295. doi: 10.1016/j.cej.2021.131295
X.W. Zhang, F. Wang, C.C. Wang, et al., Chem. Eng. J. 426 (2021) 131927. doi: 10.1016/j.cej.2021.131927
L. Jin, S. You, X. Duan, et al., J. Hazard. Mater. 423 (2022) 127111. doi: 10.1016/j.jhazmat.2021.127111
W. Zheng, Y. Liu, F. Liu, et al., Water Res. 223 (2022) 118994. doi: 10.1016/j.watres.2022.118994
F. Chen, L.L. Liu, J.H. Wu, et al., Adv. Mater. 34 (2022) 2202891. doi: 10.1002/adma.202202891
L. Jin, S. You, N. Ren, B. Ding, Y. Liu, Environ. Sci. Technol. 56 (2022) 11750–11759. doi: 10.1021/acs.est.2c03904
M.M. Huber, A. GÖbel, A. Joss, et al., Environ. Sci. Technol. 39 (2005) 4290–4299. doi: 10.1021/es048396s
J. Peng, Y. He, C. Zhou, S. Su, B. Lai, Chin. Chem. Lett. 32 (2021) 1626–1636. doi: 10.1016/j.cclet.2020.10.026
Y. Deng, R. Zhao, Curr. Pollut. Rep. 1 (2015) 167–176. doi: 10.1007/s40726-015-0015-z
B.T. Oh, Y.S. Seo, D. Sudhakar, et al., J. Hazard. Mater. 279 (2014) 105–110. doi: 10.1016/j.jhazmat.2014.06.065
W. Yao, S.W. Ur Rehman, H. Wang, et al., Water Res. 138 (2018) 106–117. doi: 10.1016/j.watres.2018.03.044
E. Gilbert, Ozone Sci. Eng. 24 (2002) 75–82. doi: 10.1080/01919510208901598
X. Zhang, Z. Chen, J. Kang, et al., J. Hazard. Mater. 401 (2021) 123837. doi: 10.1016/j.jhazmat.2020.123837
W. Qin, Z. Lin, H. Dong, et al., Water Res. 186 (2020) 116336. doi: 10.1016/j.watres.2020.116336
X. Shi, O. Lefebvre, K.K. Ng, H.Y. Ng, Bioresour. Technol. 153 (2014) 79–86. doi: 10.1016/j.biortech.2013.11.045
K. Hou, P. Shen, Z. Wang, et al., Chin. Chem. Lett. 34 (2023) 107555. doi: 10.1016/j.cclet.2022.05.069
F. Saadati, N. Keramati, M.M. Ghazi, Crit. Rev. Environ. Sci. Technol. 46 (2016) 757–782. doi: 10.1080/10643389.2016.1159093
X. Jiang, W.A. Jefferson, D. Song, et al., J. Environ. Sci. 87 (2020) 281–288. doi: 10.1016/j.jes.2019.07.004
J. Li, Z. Zhou, X. Li, et al., Chem. Eng. J. 428 (2022) 132613. doi: 10.1016/j.cej.2021.132613
R. Zhang, Y. Yang, C.H. Huang, L. Zhao, P. Sun, Water Res. 103 (2016) 283–292. doi: 10.1016/j.watres.2016.07.037
J. Cui, T. Liu, Q. Zhang, T. Wang, X. Hou, Chem. Eng. J. 404 (2021) 126453. doi: 10.1016/j.cej.2020.126453
R. Luo, C. Wang, Y. Yao, J. Qi, J. Li, Environ. Sci. Water Res. Technol. 8 (2022) 465–483. doi: 10.1039/D1EW00731A
J. Ma, Y. Yang, X. Jiang, et al., Chemosphere 190 (2018) 296–306. doi: 10.1016/j.chemosphere.2017.09.148
P. Neta, R.E. Huie, A.B. Ross, J. Phys. Chem. Ref. Data 17 (1988) 1027–1284. doi: 10.1063/1.555808
H.V. Lutze, N. Kerlin, T.C. Schmidt, Water Res. 72 (2015) 349–360. doi: 10.1016/j.watres.2014.10.006
U. von Gunten, Water Res. 37 (2003) 1469–1487. doi: 10.1016/S0043-1354(02)00458-X
Y. Zhang, Y.G. Zhao, Y. Hu, et al., Environ. Res. 212 (2022) 113324. doi: 10.1016/j.envres.2022.113324
H. Liu, Y. Gao, J. Wang, et al., Chemosphere 276 (2021) 130220. doi: 10.1016/j.chemosphere.2021.130220
P. Neta, R.E. Huie, J. Phys. Chem. 90 (1986) 4644–4648. doi: 10.1021/j100410a035
C. Wang, J. Kim, V. Malgras, et al., Small 15 (2019) 1900744. doi: 10.1002/smll.201900744
X. Yu, W. Qin, X. Yuan, et al., J. Hazard. Mater. 407 (2021) 124393. doi: 10.1016/j.jhazmat.2020.124393
Y. Fu, G. Wu, J. Geng, et al., Water Res. 150 (2019) 12–20. doi: 10.1016/j.watres.2018.11.051
J.E. Grebel, J.J. Pignatello, W.A. Mitch, Environ. Sci. Technol. 44 (2010) 6822–6828. doi: 10.1021/es1010225
Z. Li, C. Guo, J. Lyu, Z. Hu, M. Ge, J. Hazard. Mater. 373 (2019) 85–96. doi: 10.1016/j.jhazmat.2019.03.075
R. Zhang, P. Sun, T.H. Boyer, L. Zhao, C.H. Huang, Environ. Sci. Technol. 49 (2015) 3056–3066. doi: 10.1021/es504799n
M. Nie, W. Zhang, C. Yan, et al., Sci. Total Environ. 647 (2019) 734–743. doi: 10.1016/j.scitotenv.2018.08.065
Y. Wang, H. Zhang, J. Zhang, et al., J. Hazard. Mater. 192 (2011) 35–43.
T.K. Lau, W. Chu, N.J.D. Graham, Environ. Sci. Technol. 41 (2007) 613–619. doi: 10.1021/es061395a
Y. Song, H. Gong, J. Wang, F. Chang, K. Wang, Front. Environ. Sci. Eng. 14 (2020) 64. doi: 10.1007/s11783-020-1243-z
X. Duan, S. Yang, S. Wacławek, et al., J. Environ. Chem. Eng. 8 (2020) 103849. doi: 10.1016/j.jece.2020.103849
W. Abbas, S. Abbas, M. Nawaz, et al., J. Hazard. Mater. 416 (2021) 125879. doi: 10.1016/j.jhazmat.2021.125879
Z. Zhao, P. Gan, C. Zhu, et al., Chemosphere 307 (2022) 136143. doi: 10.1016/j.chemosphere.2022.136143
E.M. Bonsen, S. Schroeter, H. Jacobs, J.A.C. Broekaert, Chemosphere 35 (1997) 1431–1445. doi: 10.1016/S0045-6535(97)00216-6
B. Roig, C. Gonzalez, O. Thomas, Anal. Chim. Acta 389 (1999) 267–274. doi: 10.1016/S0003-2670(99)00212-3
M.A. Sutton, U. Dragosits, Y.S. Tang, D. Fowler, Atmos. Environ. 34 (2000) 855–869. doi: 10.1016/S1352-2310(99)00362-3
J. Chen, J. Xu, T. Liu, et al., J. Hazard. Mater. 386 (2020) 121656. doi: 10.1016/j.jhazmat.2019.121656
S. Lan, Y. Chen, L. Zeng, et al., J. Hazard. Mater. 393 (2020) 122448. doi: 10.1016/j.jhazmat.2020.122448
S. Som, C. Raha, I.B. Chatterjee, Acta Vitaminol. Enzymol. 5 (1983) 243–250.
X. Sun, Y. Leng, D. Wan, et al., Molecules 26 (2021) 6803. doi: 10.3390/molecules26226803
Z. Cai, X. Hao, X. Sun, et al., Water Res. 162 (2019) 369–382. doi: 10.1016/j.watres.2019.06.017

Figure 1 The degradation rates (a) and pseudo-first-order rate constants (b) of TC in different oxidation systems. Experimental conditions: [PDS0] = 5 mmol/L, [TC0] = 20 mg/L, [O3] = 8.4 mg/L, pH0 5.6.

Figure 2 The degradation rates and pseudo-first-order rate constants (insert graph) of TC under different PDS dosages (a), initial TC concentrations (b) and initial pH (c). Experimental conditions (if not altered): [PDS0] = 5 mmol/L, [TC0] = 20 mg/L, [O3] = 8.4 mg/L, pH0 5.6.

Figure 3 The degradation rates of TC with different concentrations of (a) Cl−, (b) NO3−, (c) HCO3−, (d) SO42−, (f) NH4+. Insert graphs and (e) depict corresponding pseudo-first-order rate constants (kobs). Experimental conditions: [PDS0] = 5 mmol/L, [TC0] = 20 mg/L, [O3] = 8.4 mg/L, pH0 5.6.

Figure 4 Effects of •OH and SO4•− scavengers on TC degradation (a), effects of O2•− scavenger (b), effects of 1O2 scavenger (c) and the EPR spectra in different systems (d–f). Experimental conditions: [PDS0] = 5 mmol/L, [TC0] = 20 mg/L, [O3] = 8.4 mg/L, pH0 5.6.

 扫一扫看文章

扫一扫关注我们
 DownLoad:
 下载:
下载:

 下载:
下载: