College of Chemistry and Chemical Engineering, Technology Innovation Center of Industrial Hemp for State Market Regulation, Qiqihar University, Qiqihar 161006, China
b.
College of Pharmacy, Jiamusi University, Jiamusi 154007, China
c.
State Key Laboratory of Supramolecular Structure and Materials, Jilin University, Changchun 130012, China
Received Date:
04 October 2023 Accepted Date:
19 December 2023 Revised Date:
30 November 2023 Available Online:
15 October 2024
Abstract:
The combination of interface engineering and defect engineering is a promising strategy for developing new semiconducting surface-enhanced Raman scattering (SERS) substrate. Herein, an organic/inorganic hybrid g-C3N4/TiO2-X heterojunction with synchronous generation of strong interface effect and abundant surface oxygen vacancy (OV) defect was prepared by a simple sol-hydrothermal procedure with a help of urea. Due to the improved substrate-to-molecule charge transfer (CT) from joint contribution of high-efficiency carrier separation induced by strong interface coupling effect and multiple CT paths derived from abundant surface OV, g-C3N4/TiO2-X substrate exhibits greatly enhanced SERS effect for non-resonant 4-mercaptobenzoic acid (4-MBA) probe. The enhancement factor of g-C3N4/TiO2-X substrate for 4-MBA is as high as 5.57 × 10⁶, and the substrate exhibits ultra-high stability and excellent spectral reproducibility. More meaningfully, the developed g-C3N4/TiO2-X heterojunction can be used to execute an ultrasensitive detection for antibiotic residues in real water system, even comprehensive evaluation of multi-component residues.
Surface-enhanced Raman scattering (SERS) is one of the most powerful analytical technologies, and has been widely applied in chemistry, materials science, catalysis and environmental science, biomedicine, and other fields [1-5]. Advancement of SERS is inseparable from development of substrate materials. Compared to traditional noble metal substrates (Au, Ag), recently developed semiconductor SERS substrates (especially wide-band gap semiconductors TiO2, ZnO, etc.) have attracted growing attention due to their unique advantages such as low cost, high stability, selectivity, biocompatibility and recyclability [6-11]. However, enhancement factor (EF) of semiconductor substrates is only 10–103, far lower than that of noble metals. Therefore, it is urgent to develop new semiconductor SERS substrates with high activity.
SERS of semiconductors is mainly derived from contribution of charge transfer (CT) between substrate and molecule. Some strategies have been proposed for development of semiconductor substrates, including defect engineering [12-14], energy band regulating (element doping) [15-17], amorphous state or morphology adjusting [6,18,19], semiconductor-metal hybridizing [20,21], etc. Among them, defect engineering is regarded as an effective strategy, which can promote CT between substrate and molecule as well as provide more active sites. Zhao et al. [22] reported an urchin-like W18O49 nanowire for SERS enhancement. Due to contribution of abundant oxygen vacancies (OV) in W18O49 to CT, its EF was as high as 3.4 × 10⁵, and limit of detection (LOD) of Rhodamine 6G (R6G) probe was as low as 10−7 mol/L. Recently, Guo and co-workers [23] developed a nonstoichiometric three-dimensional cubic Cu2O by recrystallization-induced self-assembly method, in which a large number of OV were generated for enhancing SERS effect induced by CT, with an EF of 8 × 10⁵ for R6G. Yang et al. [24] also developed a hydrogenation strategy for preparing black TiO2 nanowire, which boosted SERS performance of the substrate with a LOD of 10−7 mol/L for R6G and an EF of 1.2 × 10⁶ due to formation of abundant surface defects induced by hydrogen doping.
These defect engineering strategies mainly depend on defects and/or active sites induced by vacancy to create or increase new CT paths for activating SERS enhancement, which paid little attention to the influence of separation efficiency of photogenerated carrier on CT and SERS. According to theory of Herzberg-Teller vibration coupling in semiconductor-molecule system proposed by Lombardi et al. [25,26], it can be inferred that the rich carrier state density and its high separation efficiency will certainly promote CT between substrate and molecule, in addition to the resonance effect induced by defect engineering. However, there are few efforts focusing on the carrier regulation strategy for development of new semiconducting substrates, especially the combination strategy of carrier regulating and defect engineering.
Here, based on a combined strategy of carrier regulating and defect engineering, a g-C3N4/TiO2-X heterojunction SERS substrate with abundant surface OV was developed by an in-situ synchronous generation scheme of heterostructure and surface defects. The strong interfacial coupling effect (chemical interaction) between two components in heterostructure improves the carrier separation efficiency in TiO2, and the concomitantly formed abundant surface OV provides more CT paths, which are together responsible for greatly enhanced SERS activity. EF of 4-mercaptobenzoic acid (4-MBA) on substrate is as high as 5.57×10⁶, and LOD is as low as 1 × 10⁻⁸ mol/L. Meanwhile, the substrate exhibits excellent reproducibility and stability, which can resist corrosions of strong acid and strong base. And, g-C3N4/TiO2-X can be applied for ultrasensitive detection of antibiotic contaminations (ciprofloxacin, CIP and enoxacin, ENX) in real water system. This work is of great significance for the development and practical application of new semiconductor substrates, and also provides a simple, economical and ultrasensitive SERS strategy for drug residue detection in real water system.
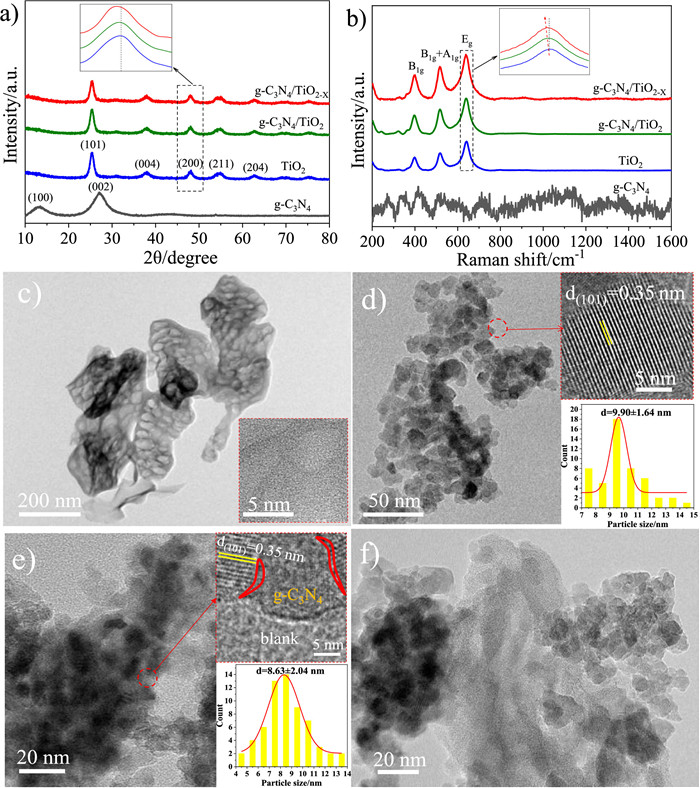
In this work, g-C3N4/TiO2-X heterojunction was synthesized by a sol-hydrothermal method with the help of urea. Urea was used as raw material of g-C3N4 to mix with TiO2 precursor obtained by sol-hydrothermal process for in-situ formation of g-C3N4/TiO2-X with strong interfacial coupling effect via a heat treatment procedure, in which urea was also acted as an adjuvant to induce abundant surface OV in TiO2 by a surface reduction effect of NH3 generated by decomposition of urea (i.e., urea achieves the role of "two birds with one stone"). For comparation, g-C3N4, TiO2 and g-C3N4/TiO2 (g-C3N4/TiO2 was obtained by directly calcining the mixture of as-prepared g-C3N4 and TiO2 precursor via a same heat treatment procedure) were also prepared. Fig. 1a shows XRD patterns of g-C3N4, TiO2, g-C3N4/TiO2 and g-C3N4/TiO2-X. Diffraction peaks of pure g-C3N4 and TiO2 are highly matched with hexagonal structure g-C3N4 (JCPDS No. 87–1526) and anatase TiO2 (JCPDS No. 21–1272), respectively [27,28]. In two heterojunction samples, no any diffraction peaks about g-C3N4 are observed, which is due to the lower content of g-C3N4 in heterojunctions (in our case, mass ratio of g-C3N4 to TiO2 is about 1%). Interestingly, however, diffraction peak of (200) crystal plane of TiO2 in two heterojunctions exhibits a shift towards a smaller 2θ angle compared to that of pure TiO2, and the shift is the largest for g-C3N4/TiO2-X, which should be caused by interfacial interaction between g-C3N4 and TiO2, implying the formation of heterostructures [29]. In addition, it can be found that diffraction peak intensity of TiO2 in two heterojunctions also displays a decrease compared with that of pure TiO2, and the decreased degree is also the largest for g-C3N4/TiO2-X, indicating a decrease in crystallinity of TiO2 due to the inhibit effect of heterojunction forming on crystal growth of TiO2, which also implies the formation of more abundant surface defects in g-C3N4/TiO2-X. Further, Raman spectra were measured (Fig. 1b). In pure g-C3N4, there are no obvious Raman bands appearing due to its strong fluorescence effect. Pure TiO2 shows three characteristic bands at 398, 518 and 642 cm−1, which correspond to B1g, B1g+A1g and Eg vibrational modes of TiO2, respectively [30]. It can be found that Eg vibration mode in two heterojunctions exhibits a slight shift towards lower frequency compared to that in pure TiO2, it is more obvious in g-C3N4/TiO2-X, which can be attributed to the change of Ti-O bond length [31]. This is a result of N atom in g-C3N4 entering into surface lattice of TiO2 to replace the O atom [31,32], due to the formation of heterostructures (i.e., generation of interfacial interaction). Figs. 1c-f show representative TEM and HRTEM images of samples. g-C3N4 presents porous nanosheet morphology (Fig. 1c), which was caused by the release of CO2 and NH3 during thermal decomposing of urea [32]. Pure TiO2 is spherical, ultrafine and homogeneously dispersed nanoparticles with average particle size about 9.9 nm, and the crystal lattice fringe of 0.35 nm corresponds to (101) plane of anatase TiO2 (Fig. 1d). It can be found from Fig. 1e that g-C3N4 is uniformly dispersed on surface of TiO2 in g-C3N4/TiO2-X. This uniform combination can be attributed to the synchronous formation of integral heterojunction and its component unit (g-C3N4) by in-situ decomposition of urea. However, in g-C3N4/TiO2 (Fig 1f), g-C3N4 exhibits non-uniform distribution due to the asynchronous formation of heterojunction and g-C3N4. Due to in-situ synchronous formation, the intimate interface boundary between g-C3N4 and TiO2 in g-C3N4/TiO2-X can be clearly observed from HRTEM (inset of Fig. 1e), and the average particle size (about 8.63 nm) of TiO2 in g-C3N4/TiO2-X is smaller than that of pure TiO2.
Figure 1
Figure 1.
(a) XRD patterns and (b) Raman spectra of g-C3N4, TiO2, g-C3N4/TiO2 and g-C3N4/TiO2-X. (c-f) TEM images of g-C3N4, TiO2, g-C3N4/TiO2-X and g-C3N4/TiO2 (Insets are the corresponding HRTEM images and size distribution histograms).
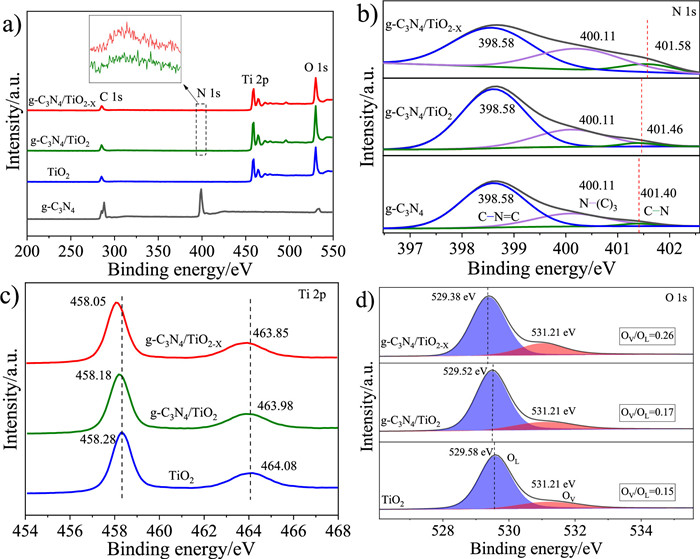
In order to further explore elemental composition and interface interaction in heterojunction, XPS analysis was carried out. XPS full spectra (Fig. 2a) reveal that Ti, O, C and N elements coexist in g-C3N4/TiO2-X. Gauss-Lorentzian nonlinear fitting results (Fig. 2b) show that N 1s spectra of all samples contain three clearly distinguished peaks at 398.58, 400.11 and about 401.4 eV, which are assigned to sp2 hybrid nitrogen (C—N=C), sp3 hybrid nitrogen (N-(C)3) and sp hybrid nitrogen (C—N) in g-C3N4 structure [33,34]. It can be found that the C—N binding energy of two heterojunctions exhibits an increase compared to that of pure g-C3N4, and it is the biggest for g-C3N4/TiO2-X (increased by 0.18 eV), indicating a decrease in electron cloud density of N atom. This can be attributed to the formation of N-Ti-O bonds in g-C3N4/TiO2 and g-C3N4/TiO2-X, resulting in decrease of N electron cloud density due to electron migration from N to O because of higher electronegativity of O than N. This is consistent with results of XRD and Raman, and the formation of N-Ti-O bond can be further confirmed by XPS results of Ti 2p (Fig. 2c). It is seen that Ti 2p binding energy of two heterojunctions presents a decrease (contrary to the change of N binding energy), due to the electron migration from N to O via bridged Ti in N-Ti-O bond that results in an increase of Ti electron cloud density. And, it should be noted that due to in-situ synchronous synthesis, a stronger interfacial coupling effect can be formed in g-C3N4/TiO2-X, because of a lager change in binding energy of N 1s and Ti 2p in g-C3N4/TiO2-X compared to those in g-C3N4/TiO2. Fig. 2d shows O 1s XPS spectra of TiO2, g-C3N4/TiO2 and g-C3N4/TiO2-X. Two O 1s peaks at 531.21 and about 529.0 eV correspond to surface OV and lattice oxygen (OL), respectively [35,36]. OL binding energy of two heterojunctions also exhibits a decrease similar to change of their Ti 2p binding energy, due to the same cause mentioned above. Interestingly, however, the content of surface OV in two heterojunction samples presents an increase trend compared to that of pure TiO2, especially in g-C3N4/TiO2-X (OV/OL ratio is as high as 0.26, increased by 73%). Abundant surface OV generally means a more excellent SERS enhancement effect. In a word, a g-C3N4/TiO2-X heterojunction with strong interfacial coupling effect (chemical interaction by N-Ti-O bonds) and abundant surface OV was successfully prepared through such an in-situ synchronous generation strategy by means of the "two birds with one stone" role of urea.
Figure 2
Figure 2.
(a) XPS full spectra of g-C3N4, TiO2, g-C3N4/TiO2 and g-C3N4/TiO2-X. (b) N 1s XPS spectra of g-C3N4, g-C3N4/TiO2 and g-C3N4/TiO2-X. (c) Ti 2p and (d) O 1s XPS spectra of TiO2, g-C3N4/TiO2 and g-C3N4/TiO2-X.
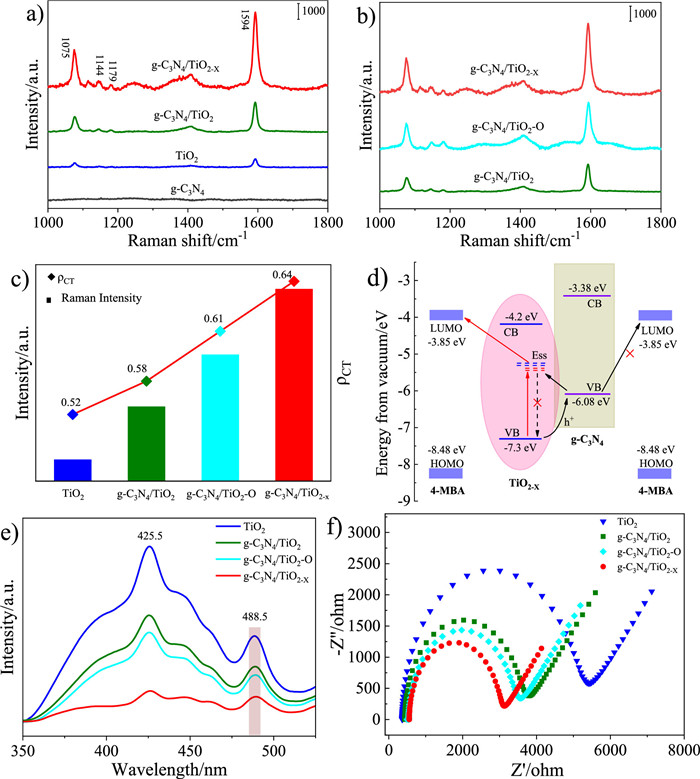
In this study, non-resonant molecule 4-MBA was served as a standard probe to evaluate SERS performances of substrates under 633 nm (1.96 eV) excitation. Fig. 3a shows SERS spectra of 4-MBA adsorbed on different substrates. There is no SERS signal of 4-MBA to be observed on pure g-C3N4, while several typical characteristic Raman peaks can be observed on pure TiO2 at 1075 (ν8a (a1) aromatic ring vibration), 1594 (ν12 (a1) aromatic ring vibration), 1144 and 1179 (C—H deformation modes) cm−1, due to the contribution of TiO2-to-molecule CT mechanism [28,37,38]. Interestingly, however, 4-MBA on g-C3N4/TiO2 exhibits a larger SERS enhancement compared to that on pure TiO2, which should be derived from contribution of the introduce of g-C3N4 and the formed interfacial interaction between g-C3N4 and TiO2. More interestingly, 4-MBA on g-C3N4/TiO2-X exhibits an amazingly huge enhancement, which is even 2.6 times greater than enhancement on g-C3N4/TiO2. According to the above characterization results, such a huge enhancement on g-C3N4/TiO2-X compared with g-C3N4/TiO2 may be derived from contributions of two aspect factors to TiO2-to-molecule CT. One is contribution from stronger interfacial coupling effect, and the other is contribution from more abundant surface OV. In order to verify this hypothesis, we prepared a comparison sample g-C3N4/TiO2-O that was obtained by secondary calcining g-C3N4/TiO2-X in air atmosphere to reduce the content of OV under no changing the interfacial interaction, aiming to verify specific contribution of aforementioned two factors. Fig. S1 (Supporting information) reveals that OV/OL in g-C3N4/TiO2-O is only 0.18, obviously less than that in g-C3N4/TiO2-X (0.26) and almost equal with that in g-C3N4/TiO2. As shown in Fig. 3b, with the decrease of OV content in g-C3N4/TiO2-O, its SERS activity also decreases, obviously lower than g-C3N4/TiO2-X but obviously higher than g-C3N4/TiO2. This indicates that such huge SERS enhancement on g-C3N4/TiO2-X must be derived from joint contribution of two factors (strong interfacial coupling effect and abundant surface OV), which together promote TiO2-to-molecule CT. Improvement of CT efficiency can be further confirmed by degree of charge transfer (ρCT), a concept proposed by Lombardi for evaluating contribution degree of CT to SERS [25]. It can be seen from Fig. 3c that the change trend of ρCT is perfectly consistent with SERS signal intensity, which is the largest for 4-MBA-g-C3N4/TiO2-X system, indicating a maximum degree of CT in this system (see Supporting information for detailed calculation of ρCT). In order to further elucidate CT mechanism in 4-MBA-g-C3N4/TiO2-X system, relevant energy levels (two semiconductors as well as 4-MBA [39-42]) were given in Fig. 3d. In this work, the 633 nm excitation energy (1.96 eV) is not sufficient to excite the electron transition from valence band (VB) of g-C3N4 to its conduction band (CB) for SERS enhancement of molecule, while it is sufficient to excite the electron transition from VB of TiO2 to its energy level of surface state (ESS, i.e., energy level of surface OV defect state) and then the excited electron is further transferred to the lowest unoccupied molecular orbital (LUMO) of 4-MBA for SERS enhancement. However, in g-C3N4/TiO2-X, electron in VB of g-C3N4 can be excited to ESS of TiO2 due to the energy matching principle and the strong interfacial coupling effect between g-C3N4 and TiO2, which provides an additional CT for SERS enhancement of 4-MBA. Meanwhile, photogenerated hole in VB of TiO2 is migrated to VB of g-C3N4 due to the energy level offset between their VBs. Such a hole migration inhibits recombination of photogenerated carriers in TiO2 side, which provides more opportunities for another additional TiO2-to-molecule CT to enhance SERS of 4-MBA. Improvement of carrier separation efficiency of TiO2 in the system can be verified by PL and photocurrent measurements. As shown in Fig. 3e, intensity of luminescence at 488.5 nm related to TiO2ESS in g-C3N4/TiO2-X is significantly lower than those of other samples, and photocurrent of g-C3N4/TiO2-X is also the largest (Fig. S2 in Supporting information), indicating a highest carrier separation efficiency in g-C3N4/TiO2-X. In addition, abundant surface OV in g-C3N4/TiO2-X also provides lots of additional CT channels for SERS enhancement, because the surface OV serves as a bridge of TiO2-to-molecule CT. Large numbers of CT channels and high-efficiency carrier separation are undoubtedly conducive to promoting CT from substrate to molecule. It can be found from Fig. 3f that g-C3N4/TiO2-X presents a smallest arc radius of EIS Nyquist plot among all substrates, which means a strongest CT capacity. In short, high carrier separation efficiency contributed by strong interfacial coupling effect (interface engineering) and more CT paths contributed by abundant OV (defect engineering) are jointly responsible for greatly enhanced SERS activity.
Figure 3
Figure 3.
(a) SERS spectra of 4-MBA (1 × 10⁻³ mol/L) adsorbed on g-C3N4, TiO2, g-C3N4/TiO2 and g-C3N4/TiO2-X. (b) SERS spectra of 4-MBA (1 × 10⁻³ mol/L) adsorbed on g-C3N4/TiO2, g-C3N4/TiO2-O and g-C3N4/TiO2-X. (c) SERS intensity (1594 cm−1) and ρCT of 4-MBA on different substrates. (d) CT mechanism of 4-MBA-g-C3N4/TiO2-X system. (e) PL spectra and (f) EIS Nyquist plots of different substrate samples.
Since SERS of g-C3N4/TiO2-X substrate highly depends on strong interface interaction and abundant surface OV induced by the "two birds with one stone" effect of urea, addition amount of urea should have an important effect on SERS enhancement. As shown in Fig. S3a (Supporting information), with the increase of mass ratio of urea to TiO2 precursor (U/T), SERS activity of substrate exhibits a change tendency of increasing first and then decreasing, when U/T is 2:1, g-C3N4/TiO2-X exhibits the highest SERS activity. This can be attributed the fact that a small amount addition of urea is not enough to form more heterostructures due to low yield of g-C3N4 (it is only 5% in this system) and also does not generate more strong interface interaction, however, an excess urea addition results in a mass generation of g-C3N4 that decreases SERS activity of substrate due to its overcovering on TiO2 surface and its strong fluorescence effect. PL measurements (Fig. S3b in Supporting information) reveal that insufficient heterostructures, weak interface interaction and strong fluorescence effect are not conducive to carrier separation of TiO2. Under the optimal ratio, performances of substrate were further examined. Concentration-dependent SERS measurements (Fig. S3c in Supporting information) show that LOD of 4-MBA on g-C3N4/TiO2-X reaches up to 1 × 10⁻⁸ mol/L, four orders of magnitude lower than that on pure TiO2 (1 × 10⁻⁴ mol/L, Fig. S3d in Supporting information). EF of 4-MBA on g-C3N4/TiO2-X is as high as 5.57×10⁶ (see Supporting information for calculation details of EF). And, g-C3N4/TiO2-X substrate also exhibits ultra-high stability and excellent spectral reproducibility. As shown in Fig. S3e (Supporting information), after placing for length-up to 60 days, the substrate still shows high SERS activity similar to the fresh substrate, and it can withstand corrosion of high temperature up to 200 ℃, even corrosions of strong acid or strong alkali. Fig. S3f (Supporting information) indicates that SERS spectra of 4-MBA from 10 random test sites on the same substrate are almost identical, and relative standard deviation (RSD) of peak intensity at 1594 cm−1 is only 5.97%.
Further, practical application of the developed substrate for detection of antibiotic residues in water system was tentatively attempted. Antibiotic residues (especially quinolone drug residues) in actual water system are seriously threatening ecological environment and human health, due to their abuse and overuse in aquaculture and livestock breeding [43,44]. From the perspective of drinking water safety and ecological protection, it is very necessary and valuable to conduct an ultrasensitive detection for the residues, especially comprehensive fingerprint evaluation of multi-component residues. Here, the local Nenjiang River water was taken as actual water sample, and typical quinolone antibiotics CIP and ENX were taken as residue pollutants for practical detecting. Encouragingly, g-C3N4/TiO2-X substrate can achieve a highly sensitive detection for CIP and ENX residues in Nenjiang River water, with fine fingerprint information (Raman shifts and assignments of CIP and ENX are listed in Table S1 in Supporting information), their LODs are as low as 1 × 10⁻⁹ mol/L and 1 × 10⁻⁸ mol/L respectively (Fig. S4 in Supporting information), which are far lower than the standard of maximum residue limit (3.0 × 10⁻⁷ mol/L) by European Union [45]. And, a good quantitative relationship between SERS intensity (at 1386 cm−1 for CIP, at 1419 cm−1 for ENX) and their corresponding concentration logarithm can be obtained within a wide concentration range. According to the linear equation, quantitative detection can be executed. As shown in Table S2 (Supporting information), detect concentrations of five CIP or ENX spiked Nenjiang River water samples are consistent with their spiked concentrations, and recoveries for CIP and ENX residues in the water samples are between 90.8%−98.0% and 87.2%−97.0%, with RSDs of 2.8%−5.1% and 2.7%−5.3%, respectively. More importantly, SERS method based on g-C3N4/TiO2-X as substrate can also achieve a highly sensitive detection and discrimination for multi-component antibiotic residues in actual water system (Fig. S4e). Mixed residues of CIP and ENX can be well distinguished according to the position and/or shape of their corresponding characteristic peaks, due to the fingerprint characteristics of SERS and the excellent performances (activity and selectivity) of g-C3N4/TiO2-X substrate.
In summary, an organic/inorganic hybrid g-C3N4/TiO2-X heterojunction SERS substrate with a high EF was successfully constructed by an in-situ synchronous synthesis strategy. The strong interfacial coupling effect in heterostructure and the synchronously formed abundant surface OV are together responsible for greatly enhanced SERS activity, due to high-efficiency carrier separation and multichannel charge transport capability. g-C3N4/TiO2-X substrate also exhibits high stability and excellent spectral reproducibility, and can be used to execute an ultrasensitive qualitative and quantitative detection for the antibiotic residues in water system. This study provides a new idea and approach for the development of new semiconductor substrate and also lays a foundation for the practical application of semiconductor SERS in real system.
Declaration of competing interest
The authors declare that they have no known competing financial interests or personal relationships that could have appeared to influence the work reported in this paper.
Acknowledgments
The research was supported by National Natural Science Foundation of China (Nos. 21804054, 21773080), Natural Science Foundation of Heilongjiang Province of China for Distinguished Young Scholars (No. JQ2019B002), and Scientific Research Project of Qiqihar University (Nos. 130412223001, 130412223002).
Supplementary materials
Supplementary material associated with this article can be found, in the online version, at doi:10.1016/j.cclet.2023.109415.
Figure 1
(a) XRD patterns and (b) Raman spectra of g-C3N4, TiO2, g-C3N4/TiO2 and g-C3N4/TiO2-X. (c-f) TEM images of g-C3N4, TiO2, g-C3N4/TiO2-X and g-C3N4/TiO2 (Insets are the corresponding HRTEM images and size distribution histograms).
Figure 2
(a) XPS full spectra of g-C3N4, TiO2, g-C3N4/TiO2 and g-C3N4/TiO2-X. (b) N 1s XPS spectra of g-C3N4, g-C3N4/TiO2 and g-C3N4/TiO2-X. (c) Ti 2p and (d) O 1s XPS spectra of TiO2, g-C3N4/TiO2 and g-C3N4/TiO2-X.
Figure 3
(a) SERS spectra of 4-MBA (1 × 10⁻³ mol/L) adsorbed on g-C3N4, TiO2, g-C3N4/TiO2 and g-C3N4/TiO2-X. (b) SERS spectra of 4-MBA (1 × 10⁻³ mol/L) adsorbed on g-C3N4/TiO2, g-C3N4/TiO2-O and g-C3N4/TiO2-X. (c) SERS intensity (1594 cm−1) and ρCT of 4-MBA on different substrates. (d) CT mechanism of 4-MBA-g-C3N4/TiO2-X system. (e) PL spectra and (f) EIS Nyquist plots of different substrate samples.

 DownLoad:

 下载:
下载:


 下载:
下载:
