Figure 1.
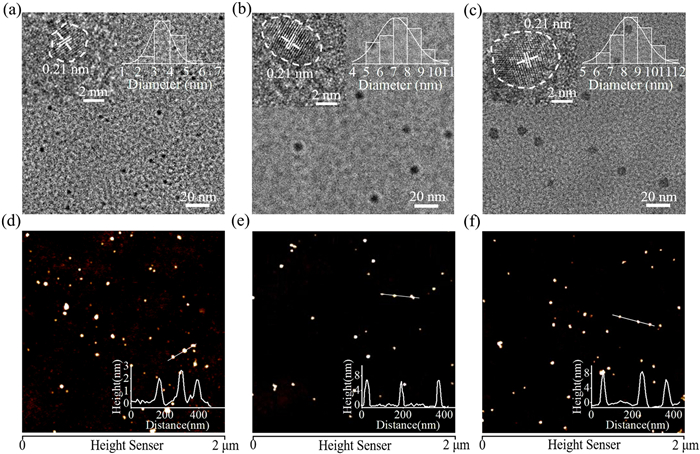
TEM and high-resolution TEM (insets) images of (a) 140-CDs, (b) 160-CDs, (c) 180-CDs. AFM images of (d) 140-CDs, (e) 160-CDs, (f) 180-CDs. The inset shows the height profile along the line.
Regulation of the multi-emission centers in carbon dots via a bottom-up synthesis approach
Bohan Zhang , Bingzhe Wang , Guichuan Xing , Zikang Tang , Songnan Qu

Carbon dots (CDs), characterized by low toxicity, excellent biocompatibility, high photostability, and affordability, have garnered increasing attention. To date, numerous techniques have been developed for the synthesis of CDs with various optical properties for applications in bioimaging, lighting, biomedicine, and photocatalysis [1–9]. Depending on the types of precursor materials, the synthesis processes can be categorized into top-down and bottom-up approaches. In the top-down approach, carbon materials such as graphite, graphene, and nanotubes are primarily used as starting materials. They are broken down into nanosized species—through physical or chemical methods such as laser ablation, electrochemical shearing, chemical oxidation shearing, and physical shearing—to yield CDs [10–12]. CDs fabricated through top-down methods often suffer from relatively low photoluminescence quantum yields (PLQYs) and a limited spectral regulation range. In the bottom-up approach, CDs are prepared through dehydration and carbonization processes of organic molecules via methods such as microwave-assisted heating and hydrothermal and solvothermal techniques. The abundance of raw materials and straightforward synthesis conditions make these bottom-up methods more popular for CDs preparation. Additionally, CDs synthesized via bottom-up methods have achieved high PLQYs and a wide range of spectral regulation [13–18]. For example, Zhang et al. reported the synthesis of blue-emitting CDs with a PLQY of ~100% using citric acid and ethylenediamine as precursors under a solvothermal method [19]. Yuan et al. utilized perylene as raw material and prepared green-emissive CDs with a PLQY of 96% through a solvothermal method [20]. Xiong et al. synthesized red-emitting CDs with a PLQY of 73% using mulberry and ethanol as precursors via a solvothermal method [21].
Excitation-dependent emissions are commonly observed in CDs, indicating the existence of multiple emission centers. The luminescence centers of CDs are believed to originate from sp2 domains in carbon cores, surface groups, organic fluorophores, or crosslinked polymer chains [22–25]. However, for the bottom-up synthesized CDs, the origins and related mechanisms are still unclear owing to the various precursors and different synthesis conditions. Thus, the assignment and regulation of these luminescent centers are significant for the rational design of bandgap emissions from CDs.
In our previous work, we demonstrated the assignment of core and surface-related states in multicolor-emissive CDs via a bottom-up approach using citric acid in formamide and a solvothermal method [26]. In this study, we systematically investigated the formation processes of the multi-emission centers in CDs synthesized via this bottom-up approach by controlling the solvothermal reaction temperature. At a lower reaction temperature (140 ℃), the prepared CDs (140-CDs) with a low carbonization degree exhibited two main emission centers. The first was a yellow–green emission center for the core state; this center originated from the sp2-conjugated domains in the carbon core. The second was a red emission center for the surface-related state; this center originated from the electron-withdrawing groups. At a high reaction temperature (180 ℃), the resulting CDs (180-CDs) showed increased particle sizes and more complicated emission centers owing to increased dehydration and carbonization contents between citric acid in formamide. 180-CDs exhibited a redshifted core-state emission owing to extended sp2-conjugated domains in the cores and enhanced red surface-related state emission from increased surface electron-withdrawing groups. Furthermore, an enhanced near-infrared emission occurred in 180-CDs, which was attributable to the increased content of radical defects in the cores caused by the elevated carbonization during high-temperature treatment. This was demonstrated by the more pronounced electron paramagnetic resonance (EPR) signals exhibited by 180-CDs compared with those exhibited by the CDs synthesized at lower temperatures.
The 140-CDs, 160-CDs, and 180-CDs were produced from 1 g of citric acid dissolved in 10 mL of formamide under solvothermal heating at 140, 160, and 180 ℃ for 6 h, respectively. The resulting dark brown solutions were mixed with 30 mL of ethanol and centrifuged at 8000 rpm for 10 min. The precipitates were dissolved in water and centrifuged at 10,000 rpm for 10 min to remove large or agglomerated particles. The supernatant was purified via dialysis for 36 h using a dialysis bag with a molecular weight cut-off of 1000 Da. The aqueous solutions inside the dialysis bag were collected and freeze-dried to obtain the CD samples.
The morphologies of the CDs were characterized via transmission electron microscopy (TEM) and atomic force microscopy (AFM). TEM images revealed spherical nanoparticles uniformly dispersed. The diameter distribution of 140-CDs was 3.2 ± 0.5 nm. For 160-CDs and 180-CDs, the particle sizes increased to 7.1 ± 1.3 nm and 8.3 ± 1.2 nm, respectively, indicating increased dehydration and carbonization contents among precursor molecules (Figs. 1a–c). The high-resolution TEM images of these CDs all provided well-resolved lattice fringes with a spacing of 0.21 nm, attributed to the (100) crystal plane of graphitic carbon. The AFM images revealed that the morphologic heights of 140-CDs, 160-CDs, and 180-CDs were 2.4 ± 0.5 nm, 7.1 ± 0.6 nm, and 8.8 ± 1.2 nm, respectively (Figs. 1d–f), confirming that these CDs had a quasi-spherical structure [27]. According to the results, a higher solvothermal reaction temperature was beneficial for the formation of larger carbonized cores.
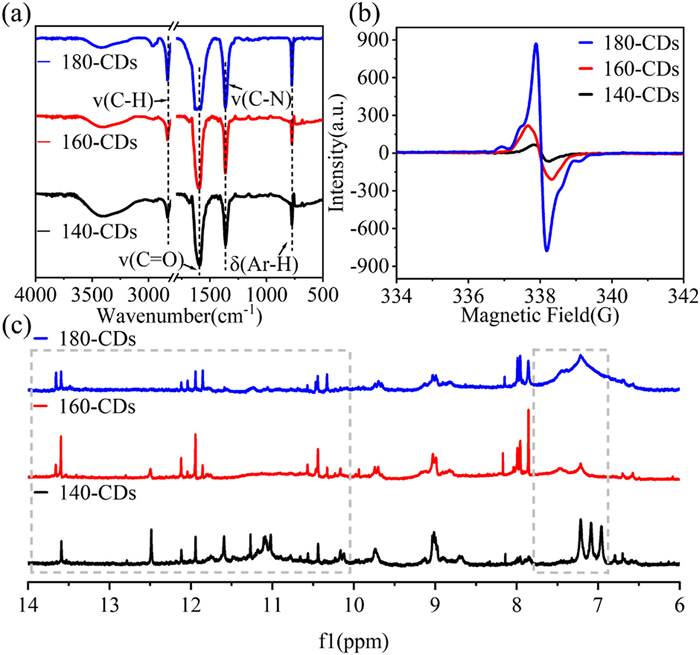
The chemical structures of these CDs were analyzed via X-ray photoelectron spectroscopy (XPS), Fourier-transform infrared (FTIR) spectroscopy, and nuclear magnetic resonance (NMR) spectrometry. The full survey XPS spectra (Fig. 2a) revealed the presence of the elements C, N, and O in the three samples. Their atomic contents were summarized in Table 1 and Table S1 (Supporting information). The N content of these CDs gradually increased with increasing solvothermal treatment temperature. Compared with 140-CDs, the N content of 180-CDs significantly increased from 16% to 22%. The high-resolution C 1s XPS spectra exhibited three peaks at 284.8, 286.7, and 288.3 eV, corresponding to C—C/C=C, C—O/C—N, and C=O bonds, respectively (Fig. 2b). The high-resolution N 1s XPS spectra showed two peaks attributed to pyridinic N (400.2 eV) and pyrrolic N (399.4 eV) (Fig. 2d). The contents of C(C—O/C—N) increased from 7% in 140-CDs to 10% in 180-CDs, along with a noticeable increase in the content of pyridinic N from 11% in 140-CDs to 18% in 180-CDs, indicating the formation of more heterocycles with pyridinic N at higher reaction temperatures (Figs. 2b and d). The O content decreased from 40% in 140-CDs to 35% in 180-CDs, possibly owing to the increased degree of dehydration and carbonization among precursors during higher-temperature solvothermal treatment. High-resolution O 1s XPS spectra confirmed the presence of C=O (531 eV) and C—O/O—H (532.2 eV) in the CDs (Fig. 2c) [28]. Analysis of Fig. 2c revealed that the content of C=O-related peaks increased from 26% in 140-CDs to 31% in 160-CDs, indicating the formation of a greater proportion of electron-withdrawing functional groups. The content of C—OH/O—C-O exhibited a gradual decrease from 14% in 140-CDs to 7% in 180-CDs, providing further evidence of increased dehydration and carbonization during higher-temperature solvothermal treatment.

 DownLoad:
CSV
DownLoad:
CSV

|
The analysis of the FTIR spectra of these CDs (Fig. 3a) revealed that the stretching vibration bands at 1360, 1649, 2830, and 3400 cm−1 were assigned to the C—N, C=O, O = C—H, and O—H bonds, respectively [29,30]. The deformation vibration signal at 760 cm−1 illustrated the existence of Ar-H. When compared to 140-CDs and 160-CDs, 180-CDs exhibited intensified C—N and Ar-H signals and a weakened O—H signal, further demonstrating a higher degree of dehydration and carbonization between citric acid and formamide under higher-temperature solvothermal treatment. This was also evident in the 1H NMR spectra (Fig. 3c), where increased proton signals from aromatic rings (6.90 ppm to 7.80 ppm) and decreased proton signals from carboxyl/aldehyde groups (> 10 ppm) were observed in 180-CDs compared to CDs synthesized at lower temperatures [24,31,32]. Additionally, an enhanced ESR signal with a g value of 1.9964 was detected in 180-CDs, indicating the generation of more radical defects in the carbon cores during the higher-temperature solvothermal reaction (Fig. 3b).
The optical properties of these CDs were investigated comparatively. Photographs of CDs in DMSO (Fig. S6 in Supporting information) exhibited great difference. Absorption spectra of these CDs in DMSO at 50 µg/mL showed gradually changing absorption intensities in the visible region (Fig. S1 in Supporting information). Their absorption spectra were fitted with a series of Gaussian peaks (Fig. 4a). For 140-CDs, intense absorption bands were observed at 500 and 535 nm with a shoulder band at 595 nm. In the case of 160-CDs, the broad absorption band at 595 nm became dominant with an enhanced shoulder band at 660 nm. For 180-CDs, the maximum absorption band occurred at 575 nm, with a redshifted broad shoulder band at 610 nm. Notably, clear near-infrared (NIR) absorption bands occurred at 700 nm and 730 nm. Fig. 4b showed the normalized photoluminescence (PL) spectra upon 532 nm excitation of these CDs in DMSO. The PL spectra were fitted with four Gaussian peaks, located at 545, 580, 645, and 700 nm for 140-CDs and 160-CDs, and 545, 585, 650, and 730 nm for 180-CDs (Fig. 4b). Compared with 140-CDs and 160-CDs, 180-CDs exhibited a significant increase in the intensity ratios of yellow, red, and NIR emissions to green fluorescence.
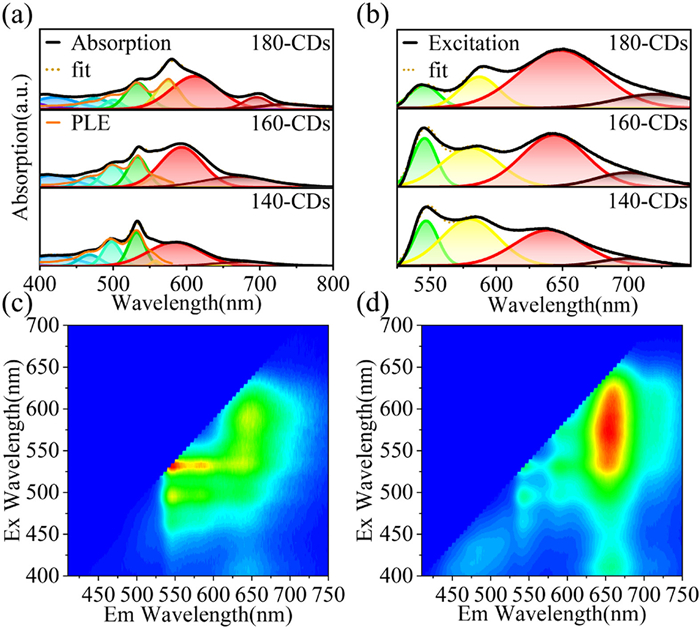
The PL excitation–emission maps provided detailed information on the fluorescence properties of these CDs (Figs. 4c and d, Fig. S2 in Supporting information). 180-CDs exhibited a new NIR emission center at 730 nm, which was consistent with the 3D mapping images of the time-resolved PL (Fig. S3 in Supporting information). For 140-CDs, the average PL lifetime at 730 nm was 1.15 ns, and the PLQY of CDs in NIR wavelength region was 0.2%. For 180-CDs, the PL lifetime of CDs at 730 nm further prolonged to 1.65 ns, and PLQY in NIR wavelength region increased to 1.9% (Fig. S5, Tables S2 and S3 in Supporting information). In our previous work, we demonstrated that unpaired radical defects in carbon cores could result in NIR emission. In this CD system, the enhanced NIR emission center with a significantly increased EPR signal in 180-CDs was attributable to the generation of high content of radical defects during the high degree of carbonization process under high-temperature solvothermal treatment [33].
The absorption, photoluminescence excitation (PLE), and PL spectra of these CDs were shown in Fig. 5. The PLE spectra monitored at 591 nm for 140-CDs and 160-CDs exhibited multiple peaks at 466 nm, 496 nm, and 532 nm, along with a shoulder band at 555 nm. The PL spectra of 140-CDs and 160-CDs, excited at 466, 496, and 532 nm, featured three emission bands peaking at 545, 580, and 645 nm (Figs. 5a and b). In our previous work, we demonstrated that the former two emission bands belonged to the core-state emission, while the broad emission band in the red region was due to the surface-related state. PLE spectra monitored at 650 nm for 140-CDs and 160-CDs were shown in Figs. S4a and b (Supporting Information). For 140-CDs, the emission band at 650 nm can be efficiently populated upon 532 nm excitation, indicating efficient resonance energy transfer to the longer-wavelength emission associated with the two optical centers. For 160-CDs, one peak with strong intensity in the PLE spectrum occurred at 595 nm, coinciding with the intense peak in the absorption spectrum.

PLE and PL spectra of 180-CDs were presented in Figs. 5c and d. The PLE peaks of 180-CDs monitored at 590 nm redshifted to 496, 532, and 575 nm, which can be attributed to the increased carbonization content resulting from high-temperature solvothermal treatment. The PL spectra of 180-CDs, excited at 496 nm, exhibited three emission bands peaking at 545, 591, and 650 nm. The significantly enhanced red fluorescence from 180-CDs was attributable to the increased content of electron-withdrawing groups, such as pyridinic and C=O groups, after a high degree of dehydration during the high-temperature solvothermal treatment. Fig. 5d showed the PLE spectrum monitored at 650 nm and the related PL spectrum of 180-CDs. An intense and broad peak in the PLE spectrum occurred at 575 nm, with a shoulder at 610 nm, consistent with the deconvoluted peak in the absorption spectrum (Fig. 4a). Moreover, the optical transition occurring at 575 nm was due to the optical center within the core. The PLE monitored at the surface state-related emission showed the strongest signal precisely at this wavelength, suggesting that effective fluorescence resonance energy transfer also existed between the two optical centers.
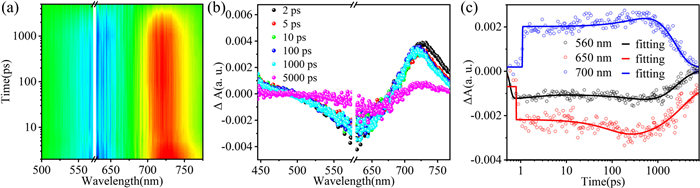
To gain further insight into the excited-state dynamics of 180-CDs in DMSO, femtosecond transient absorption (TA) spectroscopy measurements were performed using 580 nm excitation. The 2D pseudo-color TA spectra and their differential absorption features at indicated time delays were shown in Figs. 6a and b. Upon photoexcitation, ground-state bleaching (GSB) minima from 550 nm to 650 nm and excited-state absorption (ESA) maxima from 700 nm to 775 nm were observed in the visible region. With longer time decay, the GSB minimum shifted to longer wavelengths centered at 660 nm. A closer look at the TA kinetic traces at 650 nm (Fig. 6c) demonstrated the energy transfer process (kET = 1 × 10¹⁰ s−1).
According to the data discussed above, a possible formation process of the multiple emission centers and their related luminescence mechanism of these CDs was proposed, as shown in Scheme 1. The core and surface-related emission centers in these CDs were constituted by the inner sp2 domains and surface-contained electron-withdrawing groups, respectively. At a low solvothermal temperature treatment, small-sized sp2 domains were formed through a moderated carbonization process. The domains were linked by non-conjugated molecular chains to form the green-yellow emissive CDs. The surface of the CDs synthesized at low temperatures was predominantly populated with weak electron-withdrawing groups, such as hydroxyl groups, leading to relatively weak red emission. With higher-temperature solvothermal treatment, the carbonization degree gradually intensified. This was initially manifested by an increase in the quantity of graphitic conjugated fragments in the carbon core, followed by the growth of aromatic domains, sp2 domains, and pyridine nitrogen doping. These changes induced a redshift of core-associated absorption and emission. Simultaneously, a higher degree of dehydration resulted in a substantial amount of strong electron-withdrawing functional groups generated on the surface, leading to enhanced optical transitions from the surface-related emission centers. Furthermore, increased radical defects were generated in the carbon cores during the high degree of carbonization and dehydration process under higher-temperature solvothermal reaction conditions. This was supported by the significantly enhanced ESR signals in 180-CDs. These high-synthesis-temperature-induced radical defects in the carbon cores accounted for the emergence of NIR absorption and emission bands.

We systematically investigated the formation processes of multi-emission centers in CDs synthesized through a bottom-up approach by controlling the solvothermal reaction temperature. Experimental studies revealed that 140-CDs, with a low degree of carbonization, exhibited two main emission centers. The first was a dominant yellow–green emission center (540–580 nm) for the core state; this center originated from the sp2-conjugated domains in the carbon core. The second was a weak red emission center for the surface-related state; this center originated from the electron-withdrawing groups. 180-CDs, which were synthesized at a higher temperature, exhibited a redshifted core-state emission owing to extended sp2-conjugated domains in the cores, and enhanced red surface-related state emission from increased surface electron-withdrawing groups. Additionally, more radical defects were generated in the carbon cores under high-temperature solvothermal treatment, leading to enhanced NIR bandgap emission. This study contributed to a fundamental understanding of the assignment and regulation of multiple emission centers in CDs, and the findings can facilitate the rational design of CDs for various luminescence applications.
The authors declare that they have no known competing financial interests or personal relationships that could have appeared to influence the work reported in this paper.
This work was financially supported by the Science and Technology Development Fund of Macau SAR (Nos. 0128/2020/A3, 0131/2020/A3, 0007/2021/AKP, 006/2022/ALC and 0139/2022/A3), fund from the University of Macau (No. MYRG2020–00164- IAPME), the Research and Development Grant for Chair Professor Fund from the University of Macau (No. CPG2020–00026-IAPME), and the Shenzhen-Hong Kong-Macao Science and Technology Innovation Project (Category C) (Nos. SGDX20210823103803021, EF029/IAPME-QSN/2022/SZSTIC).
Supplementary material associated with this article can be found, in the online version, at doi:
D. Guo, J.H. Lei, D. Rong, et al., Adv. Sci. 9 (2022) e2205106. doi: 10.1002/advs.202205106
L. Wang, L. Li, B. Wang, et al., Small 19 (2023) e2206667. doi: 10.1002/smll.202206667
J. Wu, J.H. Lei, B. He, et al., Aggregate 2 (2021) e139. doi: 10.1002/agt2.139
H. Zhang, G. Wang, Z. Zhang, et al., Light Sci. Appl. 11 (2022) 113. doi: 10.1038/s41377-022-00798-5
Y. Li, Y. Ban, R. Wang, et al., Chin. Chem. Lett. 31 (2020) 443–446. doi: 10.1016/j.cclet.2019.07.047
H. Li, S. Han, B. Lyu, et al., Chin. Chem. Lett. 32 (2021) 2887–2892. doi: 10.1016/j.cclet.2021.03.051
Y. Ren, H. Zhang, C. Hao, et al., Chin. Chem. Lett. 35 (2024) 108225. doi: 10.1016/j.cclet.2023.108225
Y. Wang, Y. Li, G. Yang, et al., Chin. Chem. Lett. 35 (2024) 108277. doi: 10.1016/j.cclet.2023.108277
C. Wang, J. Huang, Y. He, G. Ran, Q. Song, Chin. Chem. Lett. 35 (2024) 108420. doi: 10.1016/j.cclet.2023.108420
S. Hu, J. Liu, J. Yang, Y. Wang, S. Cao, J. Nanopart. Res. 13 (2011) 7247–7252. doi: 10.1007/s11051-011-0638-y
M. Liu, Y. Xu, F. Niu, J. Gooding, J. Liu, Analyst 141 (2016) 2657–2664. doi: 10.1039/C5AN02231B
C. Wang, D. Li, Z. Lu, M. Song, W. Xia, Chem. Eng. Sci. 227 (2020) 115921. doi: 10.1016/j.ces.2020.115921
Y. Liu, J.H. Lei, G. Wang, et al., Adv. Sci. 9 (2022) e2202283. doi: 10.1002/advs.202202283
T. Zhang, J. Wu, Z. Tang, S. Qu, Mater. Chem. Front. 7 (2023) 2359–2372. doi: 10.1039/D3QM00043E
B. Wang, G.I. Waterhouse, S. Lu, Trends Chem. 5 (2023) 76–87. doi: 10.1016/j.trechm.2022.10.005
M. Fang, X. Qu B. Wang, et al., Chin. Chem. Lett. 35 (2024) 108423. doi: 10.1016/j.cclet.2023.108423
X. Yang, X. Li, B. Wang, et al., Chin. Chem. Lett. 33 (2022) 613–625. doi: 10.1016/j.cclet.2021.08.077
Y. Zhai, D. Zhou, P. Jing, et al., J. Colloid Interface Sci. 497 (2017) 165–171. doi: 10.1016/j.jcis.2017.03.007
M. Zhang, X. Long, Y. Ma, S. Wu, Opt. Mater. 135 (2023) 113311. doi: 10.1016/j.optmat.2022.113311
T. Yuan, F. Yuan, L. Sui, et al., Angew. Chem. Int. Ed. 62 (2023) e202218568. doi: 10.1002/anie.202218568
J. Liu, T. Kong, H.M. Xiong, Adv. Mater. 34 (2022) e2200152. doi: 10.1002/adma.202200152
D. Li, P. Jing, L. Sun, et al., Adv. Mater. 30 (2018) e1705913. doi: 10.1002/adma.201705913
C.L. Shen, Q. Lou, G.S. Zheng, et al., ACS Sustain. Chem. Eng. 10 (2022) 1624–1632. doi: 10.1021/acssuschemeng.1c07515
I. Srivastava, P. Moitra, M. Fayyaz, et al., ACS Appl. Mater. Interfaces 13 (2021) 59747–59760. doi: 10.1021/acsami.1c19995
C. Xia, S. Zhu, S.T. Zhang, et al., ACS Appl. Mater. Interfaces 12 (2020) 38593–38601. doi: 10.1021/acsami.0c11867
B. Zhang, B. Wang, E.V. Ushakova, et al., Small 19 (2023) e2204158. doi: 10.1002/smll.202204158
S. Kalytchuk, K. Polakova, Y. Wang, et al., ACS Nano 11 (2017) 1432–1442. doi: 10.1021/acsnano.6b06670
X. Xu, L. Mo, Y. Li, et al., Adv. Mater. 33 (2021) e2104872. doi: 10.1002/adma.202104872
J. Guo, Y. Lu, A.Q. Xie, et al., Adv. Funct. Mater. 32 (2022) 2110393. doi: 10.1002/adfm.202110393
J. Zhu, J. Hu, Q. Hu, et al., Small 18 (2022) e2105415. doi: 10.1002/smll.202105415
B. Bartolomei, A. Bogo, F. Amato, G. Ragazzon, M. Prato, Angew. Chem. Int. Ed. 61 (2022) e202200038. doi: 10.1002/anie.202200038
Z. Lu, X. Lu, Y. Zhong, et al., Anal. Chim. Acta 1050 (2019) 146–153. doi: 10.1016/j.aca.2018.11.006
T. Zhang, Q. Cheng, J.H. Lei, et al., Adv. Mater. 35 (2023) e2302705. doi: 10.1002/adma.202302705

Figure 1 TEM and high-resolution TEM (insets) images of (a) 140-CDs, (b) 160-CDs, (c) 180-CDs. AFM images of (d) 140-CDs, (e) 160-CDs, (f) 180-CDs. The inset shows the height profile along the line.

Figure 2 (a) Survey XPS spectra and high-resolution (b) C 1s, (c) O 1s, and (d) N 1s XPS spectra of 140-CDs, 160-CDs, and 180-CDs.

Figure 3 (a) FTIR spectra and (b) EPR spectra of 140-CDs, 160-CDs, and 180-CDs. (c) 1H NMR spectra of 140-CDs, 160-CDs, and 180-CDs in DMSO-d6.

Figure 4 (a) Absorption spectra (in black) of 140-CDs, 160-CDs, and 180-CDs in DMSO, fitted (in yellow) by multiple Gaussian peaks (colored bands), presented in comparison with the PLE spectra (in orange) of these CDs monitored at 590 nm. (b) PL spectra (in black) of these CDs in DMSO, fitted (in yellow) by multiple Gaussian peaks (colored bands), excitation wavelength 532 nm. Excitation–emission maps of (c) 140-CDs and (d) 180-CDs in DMSO.

Figure 5 Absorption (dashed grey line), PLE (black line), and PL (colored lines) spectra of (a) 140-CDs, (b) 160-CDs, and (c, d) 180-CDs in DMSO. Excitation wavelengths for PL spectra and monitored emission wavelengths for PLE spectra are given in the legends.

Figure 6 (a) 2D pseudo-color map and (b) differential absorption features at indicated times delays of the TA spectra of 180-CDs in DMSO upon 580 nm excitations. (c) TA kinetic traces of 180-CDs in DMSO collected at 560 nm (black), 650 nm (red), and 700 nm (blue). Dots are experimental points, and solid lines are fittings.
Table 1. Specific C, O and N contents for different chemical bonds in 140-CDs, 160-CDs, and 180-CDs in XPS spectra.
|
|
 下载: 导出CSV

 扫一扫看文章

扫一扫关注我们
