School of Environmental and Chemical Engineering, Jiangsu University of Science and Technology, Zhenjiang 212003, China
b.
Key Laboratory of the Colloid and Interface Chemistry, Ministry of Education, School of Chemistry and Chemical Engineering, Shandong University, Ji'nan 250100, China
c.
Jiangsu Hengshen Co., Ltd., Zhenjiang 212314, China
d.
School of the Environment and Safety engineering, Jiangsu University, Zhenjiang 212013, China
chexsl@sdu.edu.cn (S. Xiong). 1 These authors contributed equally to this work.
Received Date:
15 August 2023 Accepted Date:
01 November 2023 Revised Date:
21 October 2023 Available Online:
15 September 2024
Abstract:
To solve the volume expansion and poor electrical conductivity of germanium-based anode materials, Ge/rGO/CNTs nanocomposites with three-dimensional network structure are fabricated through the dispersion of polyethylene-polypropylene glycol (F127) and reduction of hydrogen. An interesting phenomenon is discovered that F127 can break GeO2 polycrystalline microparticles into 100 nm nanoparticles by only physical interaction, which promotes the uniform dispersion of GeO2 in a carbon network structure composed of graphene (rGO) and carbon nanotubes (CNTs). As evaluated as anode material of Lithium-ion batteries, Ge/rGO/CNTs nanocomposites exhibit excellent lithium storage performance. The initial specific capacity is high to 1549.7 mAh/g at 0.2 A/g, and the reversible capacity still retains 972.4 mAh/g after 100 cycles. The improved lithium storage performance is attributed to that Ge nanoparticles can effectively slow down the volume expansion during charge and discharge processes, and three-dimensional carbon networks can improve electrical conductivity and accelerate lithium-ion transfer of anode materials.
The market demand for energy density of lithium-ion batteries (LIBs) is increasing, making the graphite cannot meet the market requirements [1–4]. Therefore, it is urgent to find advanced anode materials with high specific capacity to replace graphite anode. Germanium (Ge) is considered as potential LIBs anode material due to its high theoretical capacity (1624 mAh/g) [5,6]. Moreover, Ge exhibits better conductivity and Li+ diffusion coefficient compared to silicon (Si) [7]. Despite the above advantages, Ge has low conductivity and volume expansion of more than 200% during lithiation/delithiation process, thereby imposing limitations on its practical application [8].
At this stage, great progress has been made in solving the problems of volume expansion and low conductivity of Ge-based composites [9]. Nanozation and reasonable design are effective methods to inhibit the volume expansion of Ge and improve the conductivity [10–12]. Because nanostructures have the advantages of small volume and large specific surface area, they are conducive to shortening the transmission path of Li+ [13–15]. The carbon layer plays a buffer role in the volume expansion caused by the charging and discharging of Ge, and can improve the overall conductivity [16,17]. Among of carbon materials, graphene (rGO) is widely used in Ge-based composites because of its large and thin layered structure and high conductivity [18]. The active material can be effectively dispersed, and the electrical conductivity of Ge based composites can be improved [19,20]. However, there are also some problems, such as the high cost of rGO and Ge [21–23].
As the synthesis technology of graphene advances, the price of graphene has gradually come down, but the price of Ge salt for preparing Ge materials remains high. The innovation of this work lies in the successful preparation of high-performance germanium-carbon anode material using F127 as dispersant. F127 is a common nonionic surfactant that is not only inexpensive but also environmentally friendly. During the preparation process, the F127 solution forms a special microenvironment that is beneficial to the uniform dispersion of germanium dioxide (GeO2). In this work, an interesting phenomenon was found that F127 can GeO2 polycrystalline microparticles to nanoparticles, which facilitates to prepare Ge/rGO/CNTs nanocomposites with uniform dispersion and three-dimensional (3D) network structure. The results indicated that 2 wt% F127 solution can well disperse GeO2 microparticles into nanoparticles with about 100 nm. Then, GO and CNTs were selected as carbon sources for fabricating Ge/C composites with 3D network structure. Due to hydrogen bonding between F127 and GO nanosheet, GeO2/F127 spontaneously adhered to GO layer to obtain GeO2/F127/GO nanocomposites. Subsequently, CNTs were added to the above suspension to prevent the accumulation of GO sheets. Different Ge/C composites were synthesized by adjusting the mass ratio of GO and CNTs. As evaluated as anode material of LIBs, Ge/rGO/CNTs nanocomposites has higher specific capacity and more stable cycling performance, because they can make Ge nanoparticles uniformly and efficiently disperse on the layered structure of rGO, fully exposing the reactive sites. Meanwhile, the gap between CNTs can also promote the rapid transport of ions, and 3D network structure can effectively improve the conductivity and buffer the volume expansion of Ge nanoparticles.
Fig. 1a shows the Schematic illustration of synthesis process of Ge/rGO/CNTs nanocomposites. Firstly, the clear and transparent GeO2/F127 dispersion solution was obtained by using F127 as the dispersant of GeO2 under water system. Subsequently, GO and CNTs were added as carbon sources. Due to the hydrogen bond cooperation between F127 and GO, GeO2/F127 spontaneously attaches to the GO layers. The attachment of GeO2/F127 to the layers of GO was facilitated by the cooperative hydrogen bonding between F127 and GO. Meanwhile, CNTs can prevent agglomeration of GO layers, which is conducive to the efficient dispersion of GeO2/F127. Finally, Ge/rGO/CNTs nanocomposites were obtained by freeze-drying and high-temperature hydrogenous reduction [24]. Among them, F127 was eliminated by pyrolysis at high temperature. The XRD patterns of F127, GeO2 and F127/GeO2 composites in Fig. 1b show that the three strong peaks displayed by F127/GeO2 composites correspond to the diffraction peaks of F127 and GeO2, and no new diffraction peaks appear. It confirms the dispersion-promoting effect of F127 on GeO2 only by physical interaction [25,26]. Fig. 1c displays F127/GeO2 aqueous dispersion at different F127 concentrations (0 wt%, 1 wt%, 2 wt%, 4 wt%). Interestingly, GeO2 exhibits insolubility in water and rapidly precipitates as a white solid. However, the addition of F127 enables the dispersion of GeO2 polycrystalline microparticles, leading to a gradual enhancement in solution clarity and transparency with increasing F127 concentration. Notably, complete dispersion of GeO2 polycrystalline microparticles is achieved at a F127 concentration of 2 wt%. Fig. 1d shows the SEM image of GeO2 microparticle, revealing the size of GeO2 particles is in the micrometer range and the surface is rough. Fig. 1e and Figs. S1a and b (Supporting information) display the SEM images of F127/GeO2 composites, indicating that the size of dispersed GeO2 particle decreases as F127 concentration increases. Well-dispersed GeO2 nanoparticles with about 100 nm can be clearly observed when F127 concentration is 2 wt%, whereas excessive addition of F127 (4 wt%) does not make GeO2 particles smaller. Figs. 1f and g show the SEM images of Ge/rGO/CNTs nanocomposites, revealing the uniform attachment of Ge nanoparticles to the rGO sheets with particle sizes ranging from 50 nm to 200 nm. The rGO layer structure provides buffer effect for the volume change of Ge based anode material, which is beneficial to improve the lithium storage performance.
Figure 1
Figure 1.
(a) Schematic illustration of synthesis process of Ge/rGO/CNTs nanocomposites. (b) XRD patterns of F127, GeO2 and F127/GeO2. (c) Digital photograph of F127/GeO2 dispersions at different F127 concentrations. SEM images of F127/GeO2 dispersion at (d) 0 wt% and (e) 2 wt%. SEM images of (f, g) Ge/rGO/CNTs. (h) TEM image, (i, j) HRTEM images, (k) SAED pattern of Ge/rGO/CNTs nanocomposites. (l) Corresponding elemental mapping images of Ge and C.
Figs. S3a and b (Supporting information) show that the dispersion of Ge particles in the rGO matrix becomes low with the absence of CNTs, indicating that the presence of CNTs facilitates the dispersion of Ge particles. If rGO are replaced by CNTs, the Ge particles in Ge/CNTs composites become larger, indicating CNTs cannot effectively limit the accumulation of Ge particles (Figs. S3c and d in Supporting information). Additionally, the ratio of rGO and CNTs in the Ge/rGO/CNTs composite has an important effect on the size and dispersion of Ge particles (Figs. S3e-i in Supporting information).
The TEM image in Fig. 1h clearly demonstrates the presence of a large and thin rGO lamellar structure in the Ge/rGO/CNTs nanocomposites. Additionally, the CNTs are uniformly dispersed into small bundles between the rGO layers, effectively preventing any noticeable aggregation. This dispersion strategy significantly mitigates the agglomeration of rGO layers and facilitates optimal adhesion of GeO2/F127 onto the rGO layers. Ge nanoparticles are well dispersed in the 3D carbon network. Figs. 1i and j show the HRTEM images of Ge/rGO/CNTs nanocomposites. The lattice spacing of 0.326 nm corresponds to (111) plane of Ge, which confirms the existence of Ge. The electron diffraction pattern in Fig. 1k shows continuous concentric circular diffraction rings, and the corresponding lattice is consistent with the XRD results. Fig. 1l shows the element distribution images of Ge/rGO/CNTs nanocomposites, indicating that Ge and C elements were uniformly distributed.
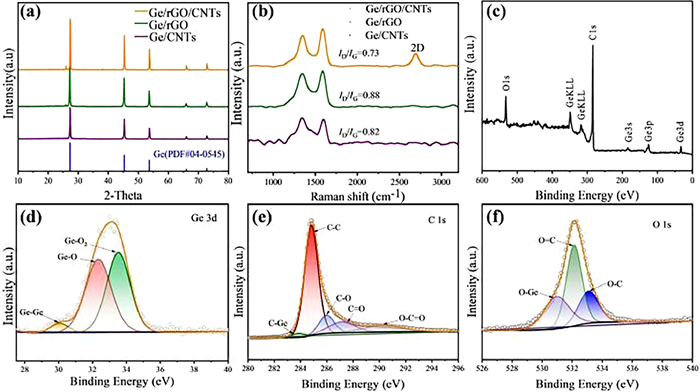
Fig. 2a exhibits the XRD patterns of Ge/rGO/CNTs, Ge/rGO and Ge/CNTs composites. The diffraction peaks of three samples are located at 27.3°, 45.3°, 53.7°, 66.0° and 72.8°, which correspond to the (111), (220), (311), (400) and (331) crystal planes of Ge (JCPDS No. 04–0545), respectively. The absence of GeO2 peaks demonstrates a complete reduction process compared with Fig. S2 (Supporting information). In view of the high intensity of (111) plane around 27° and the amorphous carbon structure, no obvious carbon peak can be observed in the pattern of Ge/rGO/CNTs nanocomposites. The amorphous state of the carbon layer can be further characterized by Raman spectroscopy in Fig. 2b. The peaks located at 1340 and 1601 cm−1 belong to the D and G bands of carbon, respectively. The D-band peak to G-band peak (ID/IG) values are calculated as 0.73, 0.88 and 0.82, respectively [27,28]. It indicates that Ge/rGO/CNTs nanocomposites have a higher degree of graphitization and good conductivity [29]. By comparison, the Ge/rGO/CNTs nanocomposites have a lower ID/IG value, indicating that the functional groups of the material produced fewer defects during the reduction process. Meanwhile, the 2D peak is roughly located at 2650 cm−1, confirming a typical rGO structure [30]. It is well known that the proportion of carbon and Ge in Ge/rGO/CNTs nanocomposites has an important impact on the lithium storage performances. According to the results of TG in Fig. S4 (Supporting information), the proportions of carbon and Ge in Ge/rGO/CNTs composite were determined to be 54.1 wt% and 45.9 wt%, respectively.
Figure 2
Figure 2.
(a) XRD patterns and (b) Raman spectra of Ge/rGO/CNTs, Ge/rGO and Ge/CNTs. XPS survey spectrum of Ge/rGO/CNTs: (c) Survey spectrum, (d) Ge 3d, (e) C 1s, (f) O 1s.
The XPS spectra were used to interpret the chemical state and bonding composition of elements in Ge/rGO/CNTs nanocomposites. The sample contains Ge, C and O elements (Fig. 2c). The high-resolution XPS spectrum of Ge 3d can be fitted to 29.7, 32.3 and 33.5 eV peaks, corresponding to Ge-Ge, Ge-O and Ge-O2 (Fig. 2d) [2,31]. The Ge-Ge bond is formed by high temperature carbonization reduction to Ge. The Ge-O bond may be due to insufficient reduction of GeO2 during high-temperature annealing. The appearance of Ge-O2 may be related to the oxidation of the surface of Ge. This indicates that Ge nanoparticles are well bound to the rGO framework, which is beneficial to enhance the overall mechanical stability of the composite. High-resolution C 1s spectrum (Fig. 2e) can fit five peaks at 284.1, 284.6, 286.2, 287.4 and 289.9 eV, which are related to C-Ge, C—C, C—O, C═O and O—C═O, respectively. As shown in Fig. 2f, the high-resolution O 1s spectrum consists of O—C (533.1 eV), O═C (532.1 eV) and O-Ge (531.0 eV) peaks. The O-Ge peak also indicates that the high surface active Ge nanoparticles are partially oxidized [32].
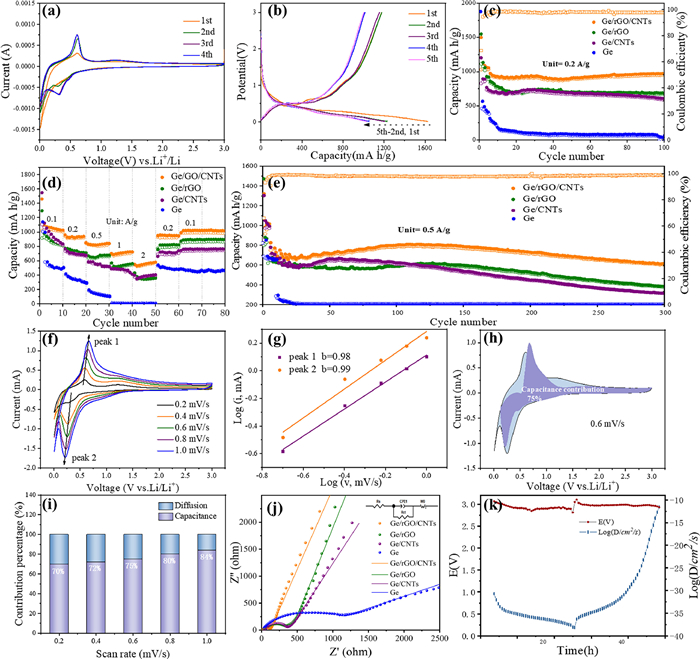
Fig. 3a shows the CV curves for the first four cycles of Ge/rGO/CNTs anode at a sweep speed of 0.1 mV/s and a potential window of 0.01–3 V. During the initial embedding process of Li+, the CV curve of anode has an irreversible reduction peak at 0–0.5 V, which is attributed to the formation of solid electrolyte interphase (SEI) film [33]. In addition, the second cycle has a wide cathodic peak at 0.29 V, which is the reversible alloying reaction of Ge-Li to generate various amorphous LixGe phases. The oxidation peaks observed at approximately 0.41 V and 0.57 V can be attributed to the delithiation process of LixGe alloys, indicating a gradual removal of lithium ions. The cycle curves of the third and fourth cycles coincide well, which ensures the cycle stability of the anode. However, a small peak at 1.12 V is also detected in the CV curves, which is ascribed to the partial surface oxidation of Ge to GeOx because nanosized Ge crystal is more susceptible to the oxidation. The lithium storage capacity of Ge/rGO/CNTs nanocomposites was systematically studied by constant current charge-discharge test at a potential window of 0.01–3 V and a current density of 0.1 A/g (Fig. 3b). It can be seen that the discharge and charging platform of the anode corresponds to the position of redox peak in Fig. 3a. The Ge/rGO/CNTs anode has high initial discharge specific capacity (1630 mAh/g) and charge specific capacity (1185 mAh/g), and the initial Coulomb efficiency (ICE) is 73%. The low Coulomb efficiency is because the SEI layer is generated due to the large area of direct contact between the anode and electrolyte during the first charge/discharge process, and the consumption of Li+ leads to the generation of irreversible capacity and the loss of Li+ [34]. The CE value of the second cycle rose to 95.93% and showed an increasing trend with the cycle proceeding. Fig. 3c and Fig. S5a (Supporting information) show the cycle performance of the seven materials for 100 cycles at 0.2 A/g. It can be seen that the discharge specific capacities of the anodes are maintained at 972.4 mAh/g (Ge/rGO/CNTs), 688.7 mAh/g (Ge/rGO), 601.7 mAh/g (Ge/CNTs), 59.4 mAh/g (Ge), 759.5 mAh/g (Ge/rGO/CNTs-5), 911.4 mAh/g (Ge/rGO/CNTs-20) and 824.6 mAh/g (Ge/rGO/CNTs-40). Ge/rGO/CNTs has better cycling performance. Fig. 3d and Fig. S5b (Supporting information) display the rate performance of seven samples at various current densities. Obviously, Ge/rGO/CNTs anode has the best rate performance. The steady-state reversible capacities of Ge/rGO/CNTs anode at 0.1, 0.2, 0.5, 1 and 2 A/g are 829.5, 708.2, 675.3, 560 and 363 mAh/g, respectively. When the current density returns to 0.1 A/g, the reversible capacity of Ge/rGO/CNTs anode still reaches 894.9 mAh/g, because the 3D carbon network constructed from GO and CNTs can effectively alleviate the large volume changes of Ge/rGO/CNTs anode and promote the diffusion/ transport of Li+ and electrons, thus improving the lithium storage performance. At a higher current density of 0.5 A/g, the long-cycle performance is also studied (Fig. 3e and Fig. S5c in Supporting information). The discharge capacity of Ge/rGO/CNTs anode after 300 cycles is 614.5 mAh/g, compared with the discharge capacity of the second cycle (983.4 mAh/g), the capacity retention rate is 62.5%. It indicates that Ge/rGO/CNTs anode with an appropriate ratio of rGO and CNTs has good long-term cycling stability, because less CNTs added will easily make rGO nanosheets to agglomerate and reduce the performance, and more CNTs added will enlarge the space of rGO layers, resulting in larger volume expansion [35]. Therefore, the combination of an appropriate amount of CNTs and GO, which can effectively alleviate the volume expansion of Ge particles, and improve the electrical conductivity and electrochemical activity. The prepared Ge/rGO/CNTs, Ge/rGO, Ge/CNTs, Ge/rGO/CNTs-5, Ge/rGO/CNTs-20 and Ge/rGO/CNTs-40 anodes show better electrochemical performance than Ge anode, proving the feasibility of synthetic materials.
Figure 3
Figure 3.
(a) The cyclic voltammetry curves of Ge/rGO/CNTs at 0.1 mV/s within 0.01–3 V versus Li/Li+. (b) The charge-discharge profiles at 0.5 A/g for Ge/rGO/CNTs anode. (c) Cycle performance of at 200 mA/g. (d) Rate capability at different current densities from 100 mA/g to 2000 mA/g. (e) Cycle performance of at 500 mA/g. (f) CV curves of the Ge/rGO/CNTs anode from 0.2 mV/s to 1 mV/s. (g) log(i) vs. log(v) plots at oxidation and reduction peaks. (h) Capacitance contribution of Ge/rGO/CNTs anode at 0.6 mV/s. (i) The diffusion-controlled and capacitive capacities of Ge/rGO/CNTs anode at different scan rates. (j) EIS spectra. (k) The GITT curves for the Ge/rGO/CNTs anode at room temperature.
Fig. 3f shows the CV curves of Ge/rGO/CNTs anode at different scanning speeds of 0.1–1.0 mV/s, where a pair of obvious reduction-oxidation peaks can quantify the ratio of capacitance contribution and diffusion control contribution [36]. From the slope of log(v) to log(i) in Fig. 3g, the values of the two peaks of Ge/rGO/CNTs anode are 0.98 (peak 1) and 0.99 (peak 2), which are close to 1, indicating that the transformation reaction of the anode is mainly pseudo capacitance behavior. In Fig. 3h, the capacitance contribution of Ge/rGO/CNTs anode (lavender area) is very prominent compared with the total capacity, reaching 75% at 0.6 mV/s. At other scan rates in Fig. S6 (Supporting information), the corresponding capacitance control contributions are 70% (0.2 mV/s), 72% (0.4 mV/s), 80% (0.8 mV/s) and 84% (1.0 mV/s), respectively. It is observed that the ratio of capacitance control increased with the increase of scanning rate in Fig. 3i. The results show that the capacitive control process plays a dominant role in lithium storage of Ge/rGO/CNTs anode, possibly because the combination of nanoscale Ge and rGO can provide rich surface/ interface to capture more Li+ through surface absorption or REDOX reactions. Finally, the surface capacitance contribution of Ge/rGO/CNTs anode is increased. Fig. 3j shows the EIS of Ge/rGO/CNTs, Ge/rGO, Ge/CNTs and Ge anodes before cycling, and insert is the equivalent circuit diagram of the EIS. By comparison, Ge/rGO/CNTs anode has a smaller semicircle in the high frequency region (a semicircle) and a steeper straight line in the low frequency region (an oblique line), indicating its rapid ion and electron mobility [37]. The results from Galvanostatic Intermittent Titration Technique (GITT) in Fig. 3k and Figs. S7a and b (Supporting information) reveal that the Li+ diffusion coefficient (DLi+) of Ge/rGO/CNTs anode is about 4.0 × 10⁻¹² cm2/s, which indicates that the Li+ diffusion is fast and uniform at different voltages, exhibiting excellent rate performance.
The morphology and microstructure of Ge/rGO, Ge/CNTs and Ge/rGO/CNTs anodes before and after cycling were detected by SEM. Figs. S8a-d (Supporting information) indicate that the Ge/rGO anode causes obvious cracking phenomenon, and the Ge/CNTs anode falls off significantly after 100 cycles. Figs. S8e and f (Supporting information) indicate that the Ge/rGO/CNTs anode after cycling can maintain the initial morphology without serious surface cracking and exfoliation, although there is a certain degree of pulverization, which can be attributed to the formation of stable SEI film on the surface of the active material. Moreover, the digital illustration of the electrode sheet shows that Ge/rGO/CNTs nanocomposites still maintains a robust and consistent connection with the fluid collector (copper foil) after cycling, indicating that the prepared composites have excellent stable structure [38]. The TEM images of expired Ge/rGO/CNTs anode after 100 cycles in Fig. S9 (Supporting information), reveal that Ge particles are still stably embedded in the carbon matrix composed of rGO and CNTs although they are pulverized, which effectively alleviates the stress caused by the volume change of the anode material during cycling, and prevents the anode material from crushing and falling off. This enhancement in lithium storage performances can be primarily ascribed to the synergistic effect arising from the integration of Ge nanoparticles and a 3D carbon network structure [39–41].
In summary, an interesting phenomenon was found that F127 can disperse GeO2 polycrystalline micrpparticles into nanoparticles with about 100 nm only by physical interaction, which facilitates to prepare Ge/rGO/CNTs nanocomposites with uniform dispersion and 3D network structure. The results indicated that 2 wt% F127 solution can well disperse GeO2 microparticles into nanoparticles with the size of about 100 nm. Then, GO and CNTs were selected as carbon sources for fabricating Ge/rGO/CNTs nanocomposites with 3D network structure. As evaluated as anode material of Lithium-ion batteries, it exhibits a high initial specific capacity of 1549.7 mAh/g at 0.2 A/g, and still retains 972.4 mAh/g after 100 cycles, which is attributed to the synergistic effect between Ge nanoparticles and 3D carbon network structure, effectively improving the conductivity and buffering the volume expansion of Ge nanoparticles.
Declaration of competing interest
The authors declare that they have no known competing financial interests or personal relationships that could have appeared to influence the work reported in this paper.
Acknowledgments
The work was financially supported by National Natural Science Foundation of China (Nos. 22379056, 52102100), Industry foresight and common key technology research in Carbon Peak and Carbon Neutrality Special Project from Zhenjiang city (No. CG2023003) and Research and Practice Innovation Plan of Postgraduate Training Innovation Project in Jiangsu Province (No. SJCX23_2164).
Supplementary materials
Supplementary material associated with this article can be found, in the online version, at doi:10.1016/j.cclet.2023.109273.
[1]
W.F. Zhang, L. Wang, G.C. Ding, et al., Chin. Chem. Lett. 34 (2023) 107328. doi: 10.1016/j.cclet.2022.03.051
Figure 1
(a) Schematic illustration of synthesis process of Ge/rGO/CNTs nanocomposites. (b) XRD patterns of F127, GeO2 and F127/GeO2. (c) Digital photograph of F127/GeO2 dispersions at different F127 concentrations. SEM images of F127/GeO2 dispersion at (d) 0 wt% and (e) 2 wt%. SEM images of (f, g) Ge/rGO/CNTs. (h) TEM image, (i, j) HRTEM images, (k) SAED pattern of Ge/rGO/CNTs nanocomposites. (l) Corresponding elemental mapping images of Ge and C.
Figure 2
(a) XRD patterns and (b) Raman spectra of Ge/rGO/CNTs, Ge/rGO and Ge/CNTs. XPS survey spectrum of Ge/rGO/CNTs: (c) Survey spectrum, (d) Ge 3d, (e) C 1s, (f) O 1s.
Figure 3
(a) The cyclic voltammetry curves of Ge/rGO/CNTs at 0.1 mV/s within 0.01–3 V versus Li/Li+. (b) The charge-discharge profiles at 0.5 A/g for Ge/rGO/CNTs anode. (c) Cycle performance of at 200 mA/g. (d) Rate capability at different current densities from 100 mA/g to 2000 mA/g. (e) Cycle performance of at 500 mA/g. (f) CV curves of the Ge/rGO/CNTs anode from 0.2 mV/s to 1 mV/s. (g) log(i) vs. log(v) plots at oxidation and reduction peaks. (h) Capacitance contribution of Ge/rGO/CNTs anode at 0.6 mV/s. (i) The diffusion-controlled and capacitive capacities of Ge/rGO/CNTs anode at different scan rates. (j) EIS spectra. (k) The GITT curves for the Ge/rGO/CNTs anode at room temperature.


 DownLoad:

 下载:
下载:


 下载:
下载:
