
Scheme 1.
Synthesis and structures of DMPOC, USTB-29, and USTB-30.
A tetraaldehyde-derived porous organic cage and covalent organic frameworks: Syntheses, structures, and iodine vapor capture
Xinyi Cao , Yucheng Jin , Hailong Wang , Xu Ding , Xiaolin Liu , Baoqiu Yu , Xiaoning Zhan , Jianzhuang Jiang

Porous organic cages (POCs, since 2009) [1–17] and covalent organic frameworks (COFs, since 2005) [18–38] are two classes of emerging porous organic materials with distinct architectures and various properties and functionalities. The active sites, sizes, and environment of pores for POCs and COFs show the unique diffusion, penetration, and activation of either ions or small molecules for the applications in the field of separation [39–43], heterogeneous catalysis [44–50], sensing [51–55], and storage [56–61]. Although they are made up of carbon and other light elements, POCs are assembled from those well-defined void molecules through non-covalent interactions to form intercrossing internal and external cage pores [1–17], and COFs are one of the covalent organic polymers of discrete monomers [17–25], showing the extended two- and three-dimensional (2D/3D) porous structures. The intrinsic interactions and attributes of modules ensure the different materials advantages. Therefore, POCs have the excellent solution processability, helpful in chemically modifying cages [62,63] and forming porous alloys [64], core–shell crystals [65], and even liquids [66,67]. For COFs, they usually have rigid connection and good photo- and electron-responsive characteristics [27–29]. Dynamic covalent chemistry (DCvC) is able to converge POCs and COFs together through the similar modular synthetic strategies, and the reversible linkages enable the simultaneous occurrence of "proof-reading" and "error-checking" processes during reactions to prepare the void molecules and frameworks with pre-designed architectures and properties [68,69].
Thus far, imine-bonded species have achieved a dominant position among various POCs and COFs [1–38]. In a parallel direction of exploring new properties and practical functionalities, POCs have been demonstrated to be a new class of functional molecular synthons with excellent solubility and purity for the preparation of various networks including COFs [62,70–73], metal-organic frameworks (MOFs) [19], and hydrogen-bonded organic frameworks (HOFs) [20]. The powerful post-synthetic covalent modification further connects the fields of POCs and COFs with the help of DCvC-directed bonds breaking and reforming mechanism. For example, many imine-bonded POCs and COFs have been derived from the same aldehydes starting materials to react with different amines. The dynamic transformation from POCs to COFs have been demonstrated to be helpful in the enhancement of the crystallinity and thus properties for the latter materials due to the changed reaction thermodynamics and kinetics [74,75]. On the other hand, the investigations of structure-property relationship upon POCs from void molecules to non-covalent-bonded assemblies are necessarily complementary to that of covalent-bonded COFs.
Herein, a [3 + 6] topological POC (DMPOC) and two COFs (USTB-29 and USTB-30) have been constructed from the condensation between 2′,3′-dimethoxy-[1,1′:4′, 1″-terphenyl]−3,3″,5,5″-tetracarbaldehyde (DMTT) and either chiral R, R-cyclohexanediamine or rod-like p-phenylenedi-amine (PD) and benzidine (BD) (Scheme 1). The crystal structure of DMPOC has been clearly announced through single crystal X-ray diffraction (SCXRD) analysis. In contrast, the 2D monoporous structures of microcrystalline USTB-29 and USTB-30 in an eclipsed AA stacking manner have been determined by powder X-ray diffraction (PXRD) analysis and theoretical simulations with the help of various electron microscopy and spectroscopy methods. Interestingly, DMPOC is capable of efficiently absorbing I2 vapor by means of an outstanding uptake of 5.10 g/g, much higher than that of USTB-29 (3.07 g/g) and USTB-30 (3.16 g/g). Mechanism studies reveal that both nitrogen and oxygen atoms have the strong interactions with polyiodide ions in the formed charge transfer POC and COFs matters, and adaptive expanding property due to the loose interaction of POCs is responsible for the efficient iodine vapor capture.
Tetraaldehyde derivatives with two aldehyde groups located in a meta-positional benzene ring have been demonstrated as powerful building blocks to construct both POCs and COFs [45,74,76–82]. In this work, a new tetraaldehyde building block DMTT was designed and created via 1,4-dibromo-2,3-dimethoxybenzene coupling with 5-(4,4,5,5-tetramethyl-1,3,2-dioxaborolan-2-yl)isophthalaldehyde, Figs. S1 and S2 (Supporting information). DMTT was used to prepare a [3 + 6] POC with the help of cyclohexanediamine in the yield of 77% (based on DMTT) (Scheme 1). The molecule was fully investigated using nuclear magnetic resonance (NMR) and mass spectroscopy (Figs. S3-S5 in Supporting information). 1H NMR data reveals five sets of signals at 6.82, 7.43, 7.88, 7.98, and 8.20 ppm (Fig. S3 in Supporting information), which are assigned to the protons in benzene rings and imine bonds. In contrast to only three sets of 1H NMR signals in DMTT, the more proton signals observed for DMPOC are due to the molecular constraint in the cage. This is supported by the appearance of eight signals in 13C NMR spectrum (Fig. S4 in Supporting information), corresponding to the carbon atoms in benzene rings and imine bonds. Matrix-assisted laser desorption ionization time-of-flight mass spectrometry (MALDI-TOF MS) data discloses the successful generation of cage with the organic component derived from three DMTT and twelve cyclohexanediamine molecules by reducing twelve water molecules (Fig. S5 in Supporting information). In addition, a stretching vibration band of the C=N of DMPOC at ca. 1645 cm−1 was observed (Fig. S6 in Supporting information), further suggesting formation of imine cage molecule. Thermogravimetric analysis (TGA) determines that DMPOC compound keeps the high thermal stability above 400 ℃ (Fig. S7 in Supporting information).
In the other synthetic route, DMTT was employed to assemble with rod-like molecules, PD and BD, at 120 ℃ in the presence of o-dichlorobenzene (o-DCB) and n-butanol (n-BuOH) with the help of acetic acid (Scheme 1). The imine bonds should extend the corresponding monomers into polymeric materials, USTB-29 and USTB-30, respectively. These two fresh samples were washed repeatedly with acetone and tetrahydrofuran (THF) to remove the unreacted starting materials, and the obtained dry COFs are slightly yellow powder with a yield of 85%−87%. In contrast to DMTT with the Fourier transform infrared (FT-IR) band at ca. 1700 cm−1 due to aldehyde groups, such characteristic band was observed for USTB-29 and USTB-30 in a tiny intensity (Figs. S8 and S9 in Supporting information). The new band at 1633 and 1629 cm−1 appeared for USTB-29 and USTB-30, respectively. These results imply that the tetraaldehyde monomer was almost completely consumed to form imine bonds during the solvothermal reactions. The solid-state 13C cross-polarization magic-angle spinning nuclear magnetic resonance (CP/MAS NMR) spectra of USTB-29 and USTB-30 display the signal at 157 and 159 ppm, respectively, providing another evidence for the formation of imine linkages (Figs. S10 and S11 in Supporting information). TGA diagrams disclosed revealed that USTB-29 and USTB-30 behaved none weight loss upon heating until at 400 ℃ under N2 (Figs. S12 and S13 in Supporting information).
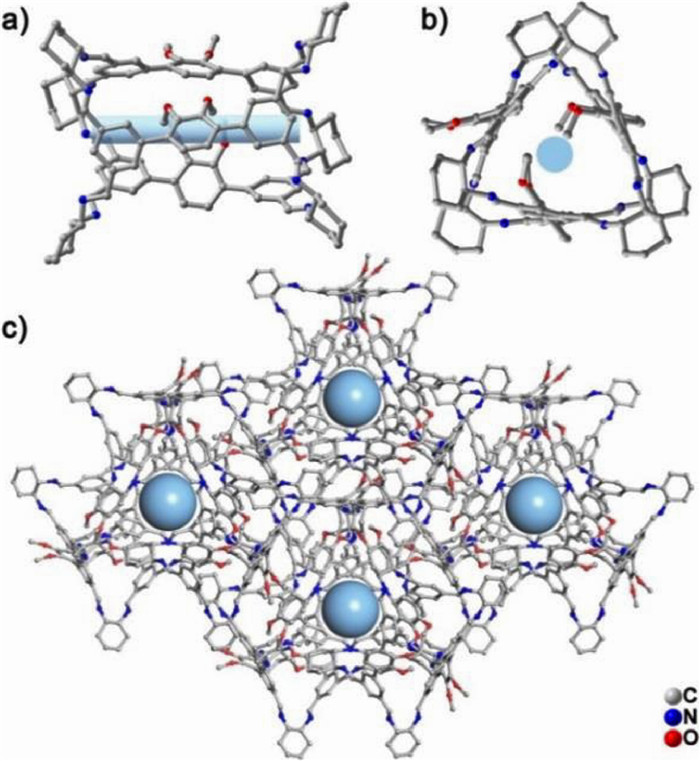
Colorless block-shaped crystals of DMPOC were crystallized from the slow diffusion of methanol into methylene chloride solution. As shown in Fig. 1 and Table S1 (Supporting information), the crystal structure of DMPOC was solved using SCXRD investigation. DMPOC belongs to the trigonal with a space group of P3221. DMPOC molecule shows a triangular prism configuration with height and side length of ca. 1.2 and 1.3 nm (Figs. 1a and b). This void molecule is surrounded by three DMTT units and six cyclohexanediamine segment linked by twelve imine bonds. The DMPOC molecule is disorder due to 1,2-dimethoxybenzene units in three DMTT segments occupying the different positions. One 1,2-dimethoxybenzene unit is buried in the cage void, and the other two were located in the outside cage. The discrete DMPOC molecules are packed together using the intermolecular van der Waals force interactions, forming a microporous structure (Fig. 1c). The purity of POC material was demonstrated by the observation of consistent PXRD data between experimental and simulated species (Fig. S14 in Supporting information). In addition, the PXRD pattern of the degassed POC is matched with that of the as-prepared sample (Fig. S14).
The newly-prepared USTB-29 was probed upon the PXRD analysis (Fig. 2a). USTB-29 possessed the strong diffraction peak at 4.96° as well as four moderate diffraction peaks at 6.34°, 9.94°, 12.70° and 26.14°, respectively, revealing the good crystallinity for this sample. On the basis the previous literatures [83–85], those examples derived tetraaldehyde derivatives and rod-like linker usually display 2D dual-pore networks. However, the experimental data of USTB-29 is seriously different from the simulated result on the AA and AB packing mode (Fig. S15 in Supporting information). As a result, a new imine-bonded monoporous structural mode was built for this COF (Figs. 2b and c). The collected PXRD data is comparable with the theoretical one based on single-pore structure with an AA stacking arrangement, denying the AB packing structure. As shown in Fig. 2a, Le Bail refinement was conducted upon PXRD data for USTB-29, showing a = 23.1998 Å, b = 27.8626 Å, c = 3.413 Å, α = β = γ = 90° The rational fitting parameters of Rp = 3.62% and Rwp = 4.62% support the reasonable structure for this COF. The above mentioned diffraction peaks were from (110), (020), (220), (040), and (001) crystal facet, respectively. For USTB-30 with the isostructure to USTB-29, the longer monomer BD drives the generation of larger porous network than that for the latter COF. This is suggested by the left-shift of diffraction peaks, namely 3.82°, 5.26°, 8.04°, 8.43°, and 27.20° (Fig. 2e). The above mentioned diffraction peaks were from (110), (200), (220), (310), and (001) crystal facet, respectively. These experimental PXRD datum for USTB-30 is also consistent with the monoporous structural mode in an AA packing mode (Figs. 2f and g, Fig. S16 in Supporting information). Le Bail refinement over USTB-30 gave a unit cell parameters of a = 33.4668 Å, b = 32.0912 Å, c = 3.2754 Å, α = β = γ = 90°, with Rp = 4.45% and Rwp = 4.64%. The scanning electron microscopy (SEM) pictures reveal both USTB-29 and USTB-30 are ca. 1–2 micrometer-sized spheres composed of crystallites (Fig. S17 in Supporting information). As can be found in Figs. 2d and h, high-resolution transmission electron microscopy (HRTEM) images monitor the lattice fringes derived from the (020) plane, showing the distance of ca. 1.34 and 1.78 nm for USTB-29 and USTB-30, respectively.

The pore information of degassed DMPOC was detected by N2 sorption isotherms analysis at 77 K. The isotherms show a very low N2 uptake for DMPOC adsorbent at high relative pressure, acquiring a very small Brunauer−Emmett-Teller (BET) surface area of 33 m2/g (Fig. 3a). In contrast, the change of N2 adsorbate with CO2 introduces the observation of a type-Ⅰ sorption curve at 196 K due to the different dynamics for these two gasses molecules (Fig. S18 in Supporting information). The BET surface area of DMPOC was 438 m2/g. Activated USTB-29 and USTB-30 exhibited a type-Ⅰ sorption diagram, suggesting their micropore nature (Figs. 3b and c). USTB-29 holds the BET surface area of 909 m2/g. In contrast, USTB-30 had a bigger BET surface area of 1316 m2/g due to the introduction of the longer rod-like monomer. The pore size distribution identifies the channel widths around 1.09 and 1.20 nm for USTB-29 and USTB-30, respectively, in good agreement with the pore size deduced from the structure model (Figs. 3b and c), respectively. As can be seen in CO2 sorption isotherms of DMPOC at 273 K and 298 K (Fig. 3d), the CO2 uptakes at 760 mmHg are 38 and 25 cm3/g respectively. For USTB-29 and USTB-30, they have the similar CO2 uptakes of 52 vs. 35 and 30 vs. 21 cm3/g to that of DMPOC at the similar conditions (Figs. 3e and f). As a result, the adsorption enthalpies (Qst) at zero coverage were calculated from the adsorption curves of CO2 at different temperature, amounting to 30, 21, and 20 kJ/mol for USTB-29, USTB-30 and DMPOC, respectively.

The traditional inorganic adsorbents including zeolites, Ag-doped silica aerogels, clay, and activated carbon have been developed for radioactive molecular iodine capture and storage with potential in the harmless management of nuclear waste in possible nuclear accidents [86–97]. Inspired by the high iodine capture uptake for organic adsorbents such as POCs and COFs with heteroatoms due to the production of charge-transfer species, the newly-fabricated DMPOC, USTB-29, and USTB-30 were explored towards iodine vapor capture to compare the roles of pore volume and heteroatom oxygen atoms in different species. During the iodine vapor adsorption process at 348 K, the color of the three samples gradually changed into dark brown (Fig. S19 in Supporting information). As shown in Fig. 3g, the iodine vapor adsorption uptake of DMPOC is linearly increased to 3.98 g/g at 23 h, then slowly increased to 5.10 g/g after 68 h. Notably, iodine vapor adsorption uptake for DMPOC has the second record among the various POCs, only smaller than that of BPPOC (5.64 g/g) (Fig. 3h and Table S2 in Supporting information) [74]. For USTB-29 and USTB-30, they behaved the similar iodine vapor adsorption curves to that of DMPOC whit moderate uptake of 3.07 and 3.16 g/g after even 95 h (Table S2). The difference in iodine vapor capture capacity for the present POC and COFs may be attributed to their different pore volumes and structures. For obtaining the excellent COFs adsorbents, through the method of previously reported literature [74], DMPOC was successfully converted into COFs with relatively better crystallinity and specific surface area, named USTB-29c and USTB-30c, respectively (Figs. S20-S22 in Supporting information). As expected, the results show that USTB-29c and USTB-30c have better iodine vapor capture performance, 3.80 and 4.10 g/g due to the increased BET surface areas.
The I2 adsorption rate for DMPOC was defined as K80%, equaling to the value of 80% total adsorption uptake divided by time [90,92]. In the present case, DMPOC has a moderate K80% value of 0.16 g−1 h−1 among reported POCs and COFs, but much larger than USTB-29 (ca. 0.05 g−1 h−1) and USTB-30 (ca. 0.10 g−1 h−1). In addition, the iodine element distribution was uniformly spread over the samples of I2@DMPOC, I2@USTB-29 and I2@USTB-30 observed in the element energy-dispersive spectroscopy (EDS) mapping photos (Fig. S23 in Supporting information), confirming that I2 was absorbed by POC and COFs. Moreover, none diffraction peak was determined in the PXRD patterns of DMPOC after iodine adsorption (Fig. S24 in Supporting information), indicating iodide in disorder state loaded in the pores of POC and COFs [91–93]. None diffraction signals were also appeared for two COFs samples after iodine adsorption in XRD analysis (Fig. S24). It is worth noting that the iodine adsorption volume for DMPOC is much bigger than that of theoretical pore volume simulated from crystal structure, indicating more adsorption voids due to the insertion of iodine molecules. In contrast, the iodine adsorption volume for USTB-29 and USTB-30 are comparable with that of theoretical pore volume simulated from corresponding model. High vacuum degassing at 125 ℃ desorbed ca. 85% iodine molecules from I2@DMPOC, I2@USTB-29 and I2@USTB-30 under for 4 h due possibly to the formation of the charge-transfer compound (Fig. S24) [96]. DMPOC, USTB-29 and USTB-30 can retain ca. 85% of initial adsorption capacity after five consecutive iodine sorption cycles (Fig. S25 in Supporting information).
FT-IR spectra observe a movement from 1645 cm−1 to 1651 cm−1 for the C=N stretching vibration band for DMPOC and I2@DMPOC, respectively. In addition, FT-IR spectra also test that the movement of the C=N stretching vibration bands for as-prepared COFs and iodine adsorbed species, as clearly indicated by 1633 to 1638 cm−1 for USTB-29 and I2@USTB-29, and 1629 to 1637 cm−1 for USTB-30 and I2@USTB-30 (Figs. S26-S28 in Supporting information). This may be caused by the generation of the charge-transfer species [91]. After iodine vapor capture, COFs and DMPOC samples exhibited two new bands at 107 and 171 cm−1 in comparison with that of pristine samples (Fig. 4a, Figs. S29 and S30 in Supporting information). The band at 107 cm−1 suggests the presence of I3−, corresponding to the symmetric vibration. The other band at 171 cm−1 indicates the formation of I5− with the symmetric stretching vibration mode [90,92–94]. The binding energy of 398.8 eV in the N 1s XPS spectrum of DMPOC, coming from imine N element (Fig. 4b). Iodine vapor capture split the binding energy into 399.4 and 401.4 eV Similar phenomenon was shown in the O 1s XPS spectra of DMPOC and I2@DMPOC (Fig. 4c) [98] These results suggest the generation of charge-transfer salt between iodine and DMPOC as well the preferred binding sites of nitrogen and oxygen atoms (Figs. 4b and c). The changed the binding energies of N 1s and O 1s signals have been determined in the XPS spectra of I2@USTB-29 and I2@USTB-30 relative to that of fresh USTB-29 and USTB-30 (Figs. S31 and S32 in Supporting information).

Moreover, density functional theory (DFT) calculations were conducted to further explore the mechanism of DMPOC and COFs on I2 adsorption. After ionization due to the I2 capture, the charge density distribution of fragments of DMPOC, USTB-29 and USTB-30 with positive charge is shown in Figs. 4d-f. To further shed light on the interactions between the polyiodide and the fragment in porous materials, the interaction of fragments in DMPOC, USTB-29 and USTB-30 with I3− and I5− were calculated (Fig. S33 in Supporting information). The imine nitrogen and central methoxy sites in DMPOC, USTB-29 and USTB-30 exhibit the similar binding energy of −5.25~−11.64 kcal/mol for capturing I3− and I5−, indicating the preferred binding sites for these heteroatoms.
In this work, the dynamic covalent imine reaction mechanism successfully assembles 2′,3′-dimethoxy-[1,1′:4′, 1″-terphenyl]−3,3″,5,5″-tetracarbaldehyde and different diamines into a porous organic cage and two 2D monoporous COFs. Their structures have been systematically characterized by spectroscopic methods, single crystal X-ray diffraction and powder X-ray diffraction techniques with the help of various spectroscopic methods. In particular, the porous organic cage exhibits very high I2 vapor uptake than that of two COFs, indicating the important role of loose interaction between void molecules in the outstanding I2 vapor capture behaviors. This work not only prepares the new POCs and COFs examples, but also provide a new mechanistic insight in the understanding the different materials superiority, further promoting the chemistry development of porous materials.
The authors declare that they have no known competing financial interests or personal relationships that could have appeared to influence the work reported in this paper.
This work was financially supported by the Natural Science Foundation of China (Nos. 22235001, 22175020, 22131005, and 22261132512), Xiaomi Young Scholar Program, the Fundamental Research Funds for the Central Universities, and University of Science and Technology Beijing.
Supplementary material associated with this article can be found, in the online version, at doi:
T. Tozawa, J.T.A. Jones, S.I. Swamy, et al., Nat. Mater. 8 (2009) 973–978. doi: 10.1038/nmat2545
G. Zhang, M. Mastalerz, Chem. Soc. Rev. 43 (2014) 1934–1947. doi: 10.1039/C3CS60358J
G. Montà-González, F. Sancenón, R. Martínez-Máñez, et al., Chem. Rev. 122 (2022) 13636–13708. doi: 10.1021/acs.chemrev.2c00198
X.C. Yang, Z. Ullah, J.F. Stoddart, et al., Chem. Rev. 123 (2023) 4602–4634. doi: 10.1021/acs.chemrev.2c00667
R.D. Mukhopadhyay, Y. Kim, J. Koo, et al., Acc. Chem. Res. 51 (2018) 2730–2738. doi: 10.1021/acs.accounts.8b00302
R. Saha, B. Mondal, P.S. Mukherjee, Chem. Rev. 122 (2022) 12244–12307. doi: 10.1021/acs.chemrev.1c00811
S. Bai, Y.F. Han, Acc. Chem. Res. 56 (2023) 1213–1227. doi: 10.1021/acs.accounts.3c00102
L. Wu, M. Tang, L. Jiang, et al., Nat. Synth. 2 (2023) 17–25.
P. Li, Z. Sun, J. Chen, et al., J. Am. Chem. Soc. 144 (2022) 1342–1350. doi: 10.1021/jacs.1c11452
D. He, L. Zhang, T. Liu, et al., Angew. Chem. Int. Ed. 61 (2022) e202202450. doi: 10.1002/anie.202202450
T. Jiao, H. Qu, L. Tong, et al., Angew. Chem. Int. Ed. 60 (2021) 9852–9858. doi: 10.1002/anie.202100655
Y. Lei, Z. Li, G. Wu, et al., Nat. Commun. 13 (2022) 3557. doi: 10.1038/s41467-022-31289-1
Y. Wu, C. Zhang, S. Fang, et al., Angew. Chem. Int. Ed. 61 (2022) e202209078. doi: 10.1002/anie.202209078
Q.P. Zhang, Z. Wang, Z.W. Zhang, et al., Angew. Chem. Int. Ed. 60 (2021) 12781–12785. doi: 10.1002/anie.202102350
X. Qi, R. Zhong, M. Chen, et al., ACS Catal. 11 (2021) 7241–7248. doi: 10.1021/acscatal.1c01974
D. Wang, Y. Zhao, Angew. Chem. Int. Ed. 62 (2023) e202217903. doi: 10.1002/anie.202217903
F. Qiu, X. Chen, W. Wang, et al., CCS Chem. 6 (2024) 149–156. doi: 10.31635/ccschem.023.202302903
A.P. Côté, A.I. Benin, N.W. Ockwig, et al., Science 310 (2005) 1166–1170. doi: 10.1126/science.1120411
W. Zhang, L. Chen, S. Dai, et al., Nature 604 (2022) 72–79. doi: 10.1038/s41586-022-04443-4
K. Geng, T. He, R. Liu, et al., Chem. Rev. 120 (2020) 8814–8933. doi: 10.1021/acs.chemrev.9b00550
B. Gui, G. Lin, H. Ding, et al., Acc. Chem. Res. 53 (2020) 2225–2234. doi: 10.1021/acs.accounts.0c00357
Z. Wang, S. Zhang, Y. Chen, et al., Chem. Soc. Rev. 49 (2020) 708–735. doi: 10.1039/c9cs00827f
R.R. Liang, S.Y. Jiang, R.H. A, et al., Chem. Soc. Rev. 49 (2020) 3920–3951. doi: 10.1039/d0cs00049c
T. Ma, E.A. Kapustin, S.X. Yin, et al., Science 361 (2018) 48–52. doi: 10.1126/science.aat7679
Q. Guan, L.L. Zhou, Y.B. Dong, J. Am. Chem. Soc. 145 (2023) 1475–1496. doi: 10.1021/jacs.2c11071
S. Bag, H.S. Sasmal, S.P. Chaudhary, et al., J. Am. Chem. Soc. 145 (2023) 1649–1659. doi: 10.1021/jacs.2c09838
M. Liu, Y.R. Wang, H.M. Ding, et al., Sci. Bull. 66 (2021) 1659–1668. doi: 10.1016/j.scib.2021.05.001
Y. Zang, D.Q. Lu, Y.Q. Lan, Sci. Bull. 67 (2022) 1621–1624. doi: 10.1016/j.scib.2022.07.014
Y.L. Yang, Y.R. Wang, G.K. Gao, et al., Chin. Chem. Lett. 33 (2022) 1439–1444. doi: 10.3390/nano12091439
L. Sun, M. Lu, Z. Yang, et al., Angew. Chem. Int. Ed. 61 (2022) e202204326. doi: 10.1002/anie.202204326
M. Lu, M. Zhang, J. Liu, et al., J. Am. Chem. Soc. 144 (2022) 1861–1871. doi: 10.1021/jacs.1c11987
J.N. Chang, Q. Li, J.W. Shi, et al., Angew. Chem. Int. Ed. 62 (2023) e202218868. doi: 10.1002/anie.202218868
J.L. Segura, S. Royuela, M. Mar Ramos, Chem. Soc. Rev. 48 (2019) 3903–3945. doi: 10.1039/c8cs00978c
Y. Yusran, X. Guan, H. Li, et al., Natl. Sci. Rev. 7 (2019) 170–190.
A.M. Evans, M.J. Strauss, A.R. Corcos, et al., Chem. Rev. 122 (2022) 442–564. doi: 10.1021/acs.chemrev.0c01184
Y. Jin, Y. Hu, M. Ortiz, et al., Chem. Soc. Rev. 49 (2020) 4637–4666. doi: 10.1039/c9cs00879a
W. Ma, C. Zhong, J. Lin, et al., Chin. Chem. Lett. 33 (2022) 5174–5179. doi: 10.1016/j.cclet.2022.01.047
H. Wang, H. Ding, X. Meng, et al., Chin. Chem. Lett. 27 (2016) 1376–1382. doi: 10.1016/j.cclet.2016.05.020
K. Su, W. Wang, S. Du, et al., J. Am. Chem. Soc. 142 (2020) 18060–18072. doi: 10.1021/jacs.0c07367
M. Liu, L. Zhang, M.A. Little, et al., Science 366 (2019) 613–620. doi: 10.1126/science.aax7427
Z. Zhang, C. Kang, S.B. Peh, et al., J. Am. Chem. Soc. 144 (2022) 14992–14996. doi: 10.1021/jacs.2c05309
H. Dou, M. Xu, B. Wang, et al., Chem. Soc. Rev. 50 (2021) 986–1029. doi: 10.1039/d0cs00552e
F. Jin, E. Lin, T. Wang, et al., J. Am. Chem. Soc. 144 (2022) 23081–23088. doi: 10.1021/jacs.2c10548
M. Hua, S. Wang, Y. Gong, et al., Angew. Chem. Int. Ed. 60 (2021) 12490–12497. doi: 10.1002/anie.202100849
N. Sun, C. Wang, H. Wang, et al., Angew. Chem. Int. Ed. 58 (2019) 18011–18016. doi: 10.1002/anie.201908703
K. Acharyya, P.S. Mukherjee, Angew. Chem. Int. Ed. 58 (2019) 8640–8653. doi: 10.1002/anie.201900163
Q.J. Wu, D.H. Si, Q. Wu, et al., Angew. Chem. Int. Ed. 62 (2023) e202215687. doi: 10.1002/anie.202215687
M. Lu, M. Zhang, C.G. Liu, et al., Angew. Chem. Int. Ed. 60 (2021) 4864–4871. doi: 10.1002/anie.202011722
Z. Li, T. Deng, S. Ma, et al., J. Am. Chem. Soc. 145 (2023) 8364–8374. doi: 10.1021/jacs.2c11893
Y. Qian, D. Li, Y. Han, et al., J. Am. Chem. Soc. 142 (2020) 20763–20771. doi: 10.1021/jacs.0c09727
C. Liu, Y. Jin, D. Qi, et al., Chem. Sci. 13 (2022) 7014–7020. doi: 10.1039/d2sc01876d
D.X. Cui, Y. Geng, J.N. Kou, et al., Nat. Commun. 13 (2022) 4011. doi: 10.1038/s41467-022-31785-4
L. Wei, T. Sun, Z. Shi, et al., Nat. Commun. 13 (2022) 7936. doi: 10.1038/s41467-022-35674-8
Y. Wen, G.E. Wang, X. Jiang, et al., Angew. Chem. Int. Ed. 60 (2021) 19710–19714. doi: 10.1002/anie.202107185
M. Liu, Y.J. Chen, X. Huang, et al., Angew. Chem. Int. Ed. 61 (2022) e202115308. doi: 10.1002/anie.202115308
E. Martínez-Ahumada, D. He, V. Berryman, et al., Angew. Chem. Int. Ed. 60 (2021) 17556–17563. doi: 10.1002/anie.202104555
G. Zhang, O. Presly, F. White, et al., Angew. Chem. Int. Ed. 53 (2014) 1516–1520. doi: 10.1002/anie.201308924
X. Guan, H. Li, Y. Ma, et al., Nat. Chem. 11 (2019) 587–594. doi: 10.1038/s41557-019-0238-5
H. Lyu, H. Li, N. Hanikel, et al., J. Am. Chem. Soc. 144 (2022) 12989–12995. doi: 10.1021/jacs.2c05382
V. Stavila, S. Li, C. Dun, et al., Angew. Chem. Int. Ed. 60 (2021) 25815–25824. doi: 10.1002/anie.202107507
X. Yan, Y. Yang, G. Li, et al., Chin. Chem. Lett. 34 (2023) 107201. doi: 10.1016/j.cclet.2022.02.007
H. Wang, Y. Jin, N. Sun, et al., Chem. Soc. Rev. 50 (2021) 8874–8886. doi: 10.1039/d0cs01142h
M.W. Schneider, I.M. Oppel, A. Griffin, et al., Angew. Chem. Int. Ed. 52 (2013) 3611–3615. doi: 10.1002/anie.201208156
S. Jiang, Y. Du, M. Marcello, et al., Angew. Chem. Int. Ed. 57 (2018) 11228–11232. doi: 10.1002/anie.201803244
T. Hasell, S.Y. Chong, M. Schmidtmann, et al., Angew. Chem. Int. Ed. 51 (2012) 7154–7157. doi: 10.1002/anie.201202849
N. Giri, M.G. Del Pópolo, G. Melaugh, et al., Nature 527 (2015) 216–220. doi: 10.1038/nature16072
K. Jie, N. Onishi, J.A. Schott, et al., Angew. Chem. Int. Ed. 59 (2020) 2268–2272. doi: 10.1002/anie.201912068
F. Beuerle, B. Gole, Angew. Chem. Int. Ed. 57 (2018) 4850–4878. doi: 10.1002/anie.201710190
Y. Jin, C. Yu, R.J. Denman, et al., Chem. Soc. Rev. 42 (2013) 6634–6654. doi: 10.1039/c3cs60044k
Q. Zhu, X. Wang, R. Clowes, et al., J. Am. Chem. Soc. 142 (2020) 16842–16848. doi: 10.1021/jacs.0c07732
J.X. Ma, J. Li, Y.F. Chen, et al., J. Am. Chem. Soc. 141 (2019) 3843–3848. doi: 10.1021/jacs.9b00665
C. Ji, K. Su, W. Wang, et al., CCS Chem. 4 (2022) 3095–3105. doi: 10.31635/ccschem.021.202101453
T. Liu, Y. Zhao, M. Song, et al., J. Am. Chem. Soc. 145 (2023) 2544–2552. doi: 10.1021/jacs.2c12284
C. Liu, Y. Jin, Z. Yu, et al., J. Am. Chem. Soc. 144 (2022) 12390–12399. doi: 10.1021/jacs.2c03959
A. Giri, G. Shreeraj, T.K. Dutta, et al., Angew. Chem. Int. Ed. 62 (2023) e202219083. doi: 10.1002/anie.202219083
W. Li, X. Ding, B. Yu, et al., Adv. Funct. Mater. 32 (2022) 2207394. doi: 10.1002/adfm.202207394
Y. Liu, W.K. Han, W. Chi, et al., Appl. Catal. B: Environ. 331 (2023) 122691. doi: 10.1016/j.apcatb.2023.122691
V. Abet, F.T. Szczypinski, M.A. Little, et al., Angew. Chem. Int. Ed. 59 (2020) 16755–16763. doi: 10.1002/anie.202007571
F. Jin, E. Lin, T. Wang, et al., J. Am. Chem. Soc. 144 (2022) 5643–5652. doi: 10.1021/jacs.2c01058
N. Sun, D. Qi, Y. Jin, et al., CCS Chem. 4 (2022) 2588–2596. doi: 10.31635/ccschem.021.202101202
H. Ren, C. Liu, X. Ding, et al., Chin. J. Chem. 40 (2022) 385–391. doi: 10.1002/cjoc.202100612
C. Liu, W. Li, Y. Liu, et al., Chem. Eng. J. 428 (2022) 131129. doi: 10.1016/j.cej.2021.131129
S.Y. Jiang, S.X. Gan, X. Zhang, et al., J. Am. Chem. Soc. 141 (2019) 14981–14986. doi: 10.1021/jacs.9b08017
Y. Jin, Y. Hu, W. Zhang, Nat. Rev. Chem. 1 (2017) 0056. doi: 10.1038/s41570-017-0056
Y. Zhu, S. Wan, Y. Jin, et al., J. Am. Chem. Soc. 137 (2015) 13772–13775. doi: 10.1021/jacs.5b09487
W. Xie, D. Cui, S.R. Zhang, et al., Mater. Horiz. 6 (2019) 1571–1595. doi: 10.1039/c8mh01656a
J. Wang, D. Fan, C. Jiang, et al., Nano Today 36 (2021) 101034. doi: 10.1016/j.nantod.2020.101034
B. Valizadeh, T.N. Nguyen, B. Smit, et al., Adv. Funct. Mater. 28 (2018) 1801596. doi: 10.1002/adfm.201801596
X. Zhang, J. Maddock, T.M. Nenoff, et al., Chem. Soc. Rev. 51 (2022) 3243–3262. doi: 10.1039/d0cs01192d
X. Guo, Y. Li, M. Zhang, et al., Angew. Chem. Int. Ed. 59 (2020) 22697–22705. doi: 10.1002/anie.202010829
L. He, L. Chen, X. Dong, et al., Chem 7 (2021) 699–714. doi: 10.1016/j.chempr.2020.11.024
Y. Xie, T. Pan, Q. Lei, et al., Angew. Chem. Int. Ed. 60 (2021) 22432–22440. doi: 10.1002/anie.202108522
J. Li, H. Zhang, L. Zhang, et al., J. Mater. Chem. A 8 (2020) 9523–9527. doi: 10.1039/c9ta13980j
P. Wang, Q. Xu, Z. Li, et al., Adv. Mater. 30 (2018) 1801991. doi: 10.1002/adma.201801991
L. Zhang, Y. Jin, G.H. Tao, et al., Angew. Chem. Int. Ed. 59 (2020) 20846–20851. doi: 10.1002/anie.202007454
D. Luo, Y. He, J. Tian, et al., J. Am. Chem. Soc. 144 (2022) 113–117. doi: 10.1021/jacs.1c11731
T. Hasell, M. Schmidtmann, A.I. Cooper, J. Am. Chem. Soc. 133 (2011) 14920–14923. doi: 10.1021/ja205969q
D. Chen, D. Luo, Y. He, et al., J. Am. Chem. Soc. 144 (2022) 16755–16760. doi: 10.1021/jacs.2c08327

Figure 1 Single-crystal molecular structure of DMPOC: (a) Side and (b) top views. (c) Porous supramolecular architecture for DMPOC (blue tubes and balls represent the one-dimensional channel and window, respectively; all selected hydrogen atoms are omitted for clarity).

Figure 2 (a) PXRD pattern of USTB-29: experimental PXRD profile (black), refined profile (red), the difference between the experimental and refined PXRD (gray), Bragg positions (green) and simulation pattern (cyan). (b, c) The simulated AA stacking diagrams of USTB-29 and (d) HRTEM image of USTB-29. (e) PXRD pattern of USTB-30: Experimental PXRD profile (black), refined profile (red), the difference between the experimental and refined PXRD (gray), Bragg positions (green) and simulation pattern (cyan). (f, g) The simulated AA stacking diagrams of USTB-30, and (h) HRTEM image of USTB-30.

Figure 3 N2 adsorption and desorption curves at 77 K of (a) DMPOC, (b) USTB-29 and (c) USTB-30 (inset: pore size distribution based on DFT calculation). CO2 sorption isotherms of (d) DMPOC, (e) USTB-29 and (f) USTB-30 at 273 K (red) and 298 K (blue) (solid symbols: adsorption; hollow symbols: desorption). (g) Time-dependent I2 vapor uptake by DMPOC, USTB-29, USTB-30, USTB-29c and USTB-30c at 348 K. (h) Comparison of iodine adsorption capacities in different adsorbents.

 扫一扫看文章

扫一扫关注我们
 DownLoad:

 下载:
下载:

 下载:
下载: