Citation:
Lian Sun, Honglei Wang, Ming Ma, Tingting Cao, Leilei Zhang, Xingui Zhou. Shape and composition evolution of Pt and Pt3M nanocrystals under HCl chemical etching[J]. Chinese Chemical Letters,
2024, 35(9): 109188.
doi:
10.1016/j.cclet.2023.109188
Shape and composition evolution of Pt and Pt3M nanocrystals under HCl chemical etching
English
Shape and composition evolution of Pt and Pt3M nanocrystals under HCl chemical etching
State Key Laboratory of NBC Protection for Civilian, Beijing 102205, China
b.
Science and Technology on Advanced Ceramic Fibers and Composites Laboratory, College of Aerospace Science and Engineering, National University of Defense Technology, Changsha 410073, China
c.
School of Materials Science and Engineering, Beijing Institute of Technology, Beijing 100081, China
d.
State Key Laboratory of Crystal Materials and Institute of Crystal Materials, Shandong University, Ji'nan 250100, China
Received Date:
01 September 2023 Accepted Date:
09 October 2023 Revised Date:
25 September 2023 Available Online:
15 September 2024
Abstract:
Controlling the shape and composition of Pt-based nanocrystals is essential to improve electrocatalytic performance. In this work, we have carefully investigated the evolution process of morphology and composition for Pt and Pt3M (M = Ni, Co) nanocrystals by hydrochloric acid (HCl) etching. As a result, only Pt3Ni nanocrystals successfully formed unsaturated step-like atoms on the surface and then constructed high-index facets (HIFs), while Pt and Pt3Co preserved a good octahedron shape. Density functional theory (DFT) calculation suggests that Cl− ions can be tightly adsorbed on the surface of Pt3Ni rather than other nanocrystals, which hinders the deposition of newly-reduced atoms and thus regulating the surface morphology. Besides, the etching of surface transitional metals further accelerates the formation of HIFs. Boosted by the active sites on the surface, HCl-Pt-Ni exhibited a ~10.8 and ~11.3 times higher oxygen reduction reaction (ORR) mass and specific activities than commercial Pt/C catalyst, and possessed a good durability after 10,000 cycles test. This work gives a deep insight into the design of high-performance Pt-based ORR catalysts.
Platinum (Pt) is the most widely used electrode catalyst in eco-friendly energy devices, especially the oxygen reduction reaction (ORR) catalysts in the cathode of fuel cells [1,2]. To control the overall cost of the devices, optimizing the utilization of the precious Pt metal in the electrode is highly important [3]. High-index facets (HIFs) contain abundant low-coordinated noble metal atoms which significantly reduce the oxygen adsorption, and then enhance the ORR activity [4–6]. Thus, it is reasonable to create HIFs on the surface Pt and Pt-transitional metal alloy (Pt3M) nanocrystals to boost their ORR performance with low Pt usage. However, the size of HIFs-contained Pt and Pt3M nanocrystals can be relatively large due to the high surface energy of those active facets, which may decrease their ORR activity because of low surface area [7–9].
Generally, the methods for creating HIFs can be concluded to wet-chemical method [10–12], electrochemical method [13–16], and high-temperature alloying/dealloying method [17–19]. Among them, wet-chemical method is the most widely used route because of its simplicity. To tackle the issue of the overgrowth of the HIFs-contained nanocrystals synthesized by traditional wet-chemical method, new approaches have been developed such as selectively etching surface atoms and capping specific facets by choosing appropriate surfactant [20,21]. Several studies have verified that halide ions/oxygen (e.g., Cl−/O2 and Br−/O2) and metal ions (e.g., Cu+/Cu2+ and Fe2+/Fe3+) are proper candidates for the corrosion of surface atoms and forming HIFs [22–24]. Meanwhile, halide ions in etching agents as well as surfactants also play an important role on creating HIFs since they can be selectively adsorbed onto the {100}, {110} and {111} facets of Pt or Pd nanocrystals [25]. Those halide ions directly hinder the deposition of newly-reduced metal atoms from precursors, thereby controlling the growth rate and mode of crystal surface and tuning its morphology [26,27]. In our previous work, we have developed a facile chemical etching route to successfully create {311} facets on Pt3Ni nanocrystals within several nanometers by introducing hydrochloric acid (HCl) into the reaction [28]. The primary results reveal that the etching effect of Cl−/O2 to the metal nanocrystals and the capping effects of Cl− on specific facets (such as [111]) together determine the formation of those HIFs [29,30]. Nonetheless, a deep insight into the formation mechanism of this special structure needs to be further studied.
Besides Pt3Ni, other fcc-type Pt3M nanocrystals are also widely used on advanced electrocatalysts. For example, Pt3Co is considered as the most stable and active ORR catalysts in proton-exchange membrane fuel cells [31,32]. Inspired by the successful applications of HCl chemical-etching to create HIFs on Pt3Ni nanocrystals, it is worth investigating the effectiveness of this method towards other Pt3M alloys. Nevertheless, the etching rate of surface atoms by Cl−/O2, and the adsorption of Cl− on the surface can be diverse towards different metal nanocrystals, therefore producing unique morphology and composition. Based on our previous study about HCl-etched Pt3Ni nanocrystals (HCl-Pt-Ni NCs), we further expanded this system to Pt (HCl-Pt NCs) and Pt3Co (HCl-Pt-Co NCs) following a similar wet chemical method (Fig. 1a). Theoretical calculation, combining with a series of elaborate characterizations, was employed to explore the different structure and composition evolution process of these nanocrystals under HCl etching. Owing to the highly active sites and the proper amount of transitional metal, HCl-Pt-Ni NCs exhibit the highest ORR activity among all the samples. Meanwhile, HCl-Pt-Ni NCs also possess extraordinary ORR durability.
Figure 1
Figure 1.
(a) Schematic illustration of the preparation process of samples. Structural characterizations of HCl-Pt and HCl-Pt-M NCs. (b) TEM and (c) HAADF-STEM image of HCl-Pt NCs. (d) TEM and (e) HAADF-STEM images of HCl-Pt-Ni NCs. (f) TEM and (g) HRTEM images of HCl-Pt-Co NCs. The inset of (e) shows the formation of unsaturated atoms on HCl-Pt-Ni NCs. EDS-mapping profile of (h) HCl-Pt-Co and (i) HCl-Pt-Ni NCs.
Typically, the HCl-Pt and HCl-Pt3M nanocrystals were obtained by heating the N,N-dimethylformamide (DMF) and metal precursor solution containing polyvinylpyrrolidone (PVP) and HCl at 160 ℃ for 6 h. The representative transmission electron microscopy (TEM) images of these samples (Figs. 1b, d and f) illustrate the uniform formation of nanocrystal structure. The high-angle annular dark-field scanning transmission electron microscopy (HAADF-STEM) image of HCl-Pt NCs (Fig. 1c) shows that a complete octahedron shape is almost well preserved. However, the octahedron morphology of HCl-Pt-Ni NCs is somewhat irregular (Fig. 1e). Meanwhile, various unsaturated atoms (edges, steps and corners) can be observed on the surface of HCl-Pt-Ni NCs (inset of 1e), demonstrating the successful formation of HIFs. As for HCl-Pt-Co NCs, the high-resolution TEM (HRTEM) image in Fig. 1g reveals that the shape of most of the nanocrystals is close to oval-shaped nanorods rather than nanoparticles, and no obvious unsaturated atoms can be found. Obviously, the interaction between HCl and different Pt-based nanocrystals can be dissimilar, resulting in the distinctive morphology among each sample. The average sizes of HCl-Pt NCs and HCl-Pt-Ni NCs were measured as 2.74 and 5.77 nm, respectively (Fig. S1 in Supporting information). The enlargement of the size of HCl-Pt-Ni NCs can be attributed to the increase of surface energy brought by HIFs. For HCl-Pt-Co NCs, their sizes were ~7.69 nm in length and ~3.68 nm in diameter (Fig. S2 in Supporting information). The elemental mapping profiles (Figs. 1h and i) display that both Pt and the transitional metal can be uniformly distributed throughout HCl-Pt-Ni NCs and HCl-Pt-Co NCs. Besides, the energy-dispersive spectrometer (EDS, Fig. S3 in Supporting information) profile indicates that the composition of HCl-Pt-Ni NCs is Pt/Ni = 98.5/1.5, while that of HCl-Pt-Co NCs is Pt/Co = 99.3/0.7, which is close to the results of ICP-OES measurement (Pt/Ni = 98.5/1.5 for HCl-Pt-Ni, and Pt/Co = 99.4/0.6 for HCl-Pt-Co). In order to highlight the effect of HCl, the Pt, Pt3Ni and Pt3Co nanocrystals were also synthesized without adding HCl into DMF. Fig. S4 (Supporting information) depicts that all of those nanocrystals have a homogeneous octahedron-like structure, with an average edge length of 6.76 nm for Pt NCs, 4.97 nm for Pt3Ni NCs, and 4.95 nm for Pt3Co NCs (Fig. S5 in Supporting information). The EDS profile in Fig. S6 (Supporting information) further suggests that the composition of Pt3Ni and Pt3Co NCs is Pt/Ni = 76.3/23.7 and Pt/Co = 77.2/22.8, respectively, nearly consistent with ICP-OES data (Pt/Ni = 76.1/23.9 for Pt3Ni NCs, and Pt/Co = 77.0/23.0 for Pt3Co NCs). Compared with their HCl-etched counterparts, the transitional element contents are apparently decreased due to the leaching effect of acid.
The phase structure of the aforementioned samples was studied by X-ray diffraction (XRD) technique. As shown in Fig. 2a, all of the HCl-etched nanocrystals possess three main diffraction peaks corresponding to highly crystalline fcc structure. Compared with the standard pure Pt pattern (JCPDS No. 04–0802), the right shift of the diffraction peaks of HCl-Pt-Co and HCl-Pt-Ni indicates the incorporation of transitional metals into the lattice (Fig. S7 in Supporting information). XRD patterns of Pt, Pt3Ni and Pt3Co NCs also depict the successful formation of fcc-phase nanostructure (Fig. S8a in Supporting information). The leaching of transitional metals in HCl-Pt-Ni and HCl-Pt-Co NCs can be confirmed by the left-shift of the main diffraction peaks compared with their pure structure (Fig. S8b in Supporting information). In addition, such left-shift effect may suggest the construction of a Pt-rich surface on the nanocrystals [33,34]. To investigate the possible change of electronic state, the X-ray photoelectron spectroscopy data were recorded. The Pt 4f spectra of both pure (Fig. S9 in Supporting information) and HCl-etched (Fig. 2b) nanocrystals reveal the dominant presence of zerovalent Pt in these samples. The shift of main Pt peaks to the low electron energy range discovered from Pt3Ni NCs, Pt3Co NCs, HCl-Pt-Ni NCs, and HCl-Pt-Co NCs is due to the strong interaction between Pt and other transitional metals. On the other hand, the Co 2p XPS spectra (Fig. 2c) of Pt3Co NCs mainly consist of oxidized Coδ+ peak resulted from strong Co-Pt or Co-O interaction [35–37]. The signal of Co 2p can be hardly detected in HCl-Pt-Co NCs possibly because most of Co on the surface is leached by HCl. In Fig. 2d, the Ni 2p spectra of Pt3Ni contain both metallic Ni0 and oxidized Niδ+ signs, while the signal of Ni0 is dramatically suppressed in HCl-Pt-Ni NCs due to the dealloying of Ni [38].
Figure 2
Figure 2.
Structural characterizations of the nanocrystals. (a) XRD patterns and (b) Pt 4f XPS spectra of HCl-Pt NCs, HCl-Pt-Co NCs and HCl-Pt-Ni NCs. (c) Co 2p spectra of Pt3Co NCs and HCl-Pt-Co NCs. (d) Ni 2p XPS spectra of Pt3Ni NCs and HCl-Pt-Ni NCs.
To understand the mechanism of the morphology and composition evolution, we have performed density functional theory (DFT) calculation using Pt(111) and various Pt3M(111) surfaces. Based on the structural characterizations, Pt3M(111) surfaces with a layer of Pt-skin (Pt3M_Ptskin) were also constructed (for details, see DFT calculations part in Supporting information). The adsorption of chlorine was firstly investigated to understand its hindering effect on the formation of HIFs. It is widely known that on clean Pt surface, four possible adsorption sites are available for heteroatoms, namely top site, bridge site, fcc site and hcp site. Nevertheless, Pt3M alloys, along with their segregated structures, can provide more possible nonequivalent adsorption sites due to their different local atom arrangement [39]. Totally, 9 nonequivalent sites (two top sites, three bridge sites, two fcc sites and two hcp sites) can be provided by Pt3M surface, while Pt3M_Ptskin surface contains 14 distinct adsorption sites (three top sites, five bridge sites, three fcc sites and three hcp sites), as illustrated in Fig. S10 (Supporting information). The adsorption energy of chloride ion (ΔECl) on those possible sites are calculated, and the results are summarized in Tables S1 and S2 (Supporting information). The theoretical models of the most stable adsorption structure on different surfaces are illustrated in Fig. 3a. For Pt(111) surface, the most favorable adsorption site is fcc. In the case of non-segregated Pt3Ni, the Cl− tends to be adsorbed on bridge-1 site, i.e., right above the Pt-Ni bond on the surface. Similar results are discovered in the Pt3Ni(111) surface with Pt-skin (bridge-5 site). As for non-segregated Pt3Co, the Cl− is favored to be tightly attracted by the hcp-Pt2M site, i.e., coordinated with two Pt atoms and one transitional metal atom, while chlorine adsorbs preferentially at fcc-1 site on Pt3Co_Ptskin(111), in which Cl− is coordinated with three Pt atoms. Among different surfaces, Pt3Ni(111) shows the highest ability to adsorb chlorine on its surface. It should be noted that the surface with ideal stoichiometric proportion tends to bind Cl− stronger than skin-type surfaces, which is in agreement with previous reports [39,40]. The ΔECl variation among different sites on the surface is also compared (Fig. 3b). Significant differences can be found among adsorption sites on Pt(111) and Pt3Ni(111), along with skin-type surface, indicating that the mobility of chlorine is hindered on them. Compared with Pt(111), Pt3Ni(111) has a wider ΔECl distribution, which suggests that Cl− can be attached more tightly. On the other hand, the adsorption energy of chlorine on Pt3Co is rather smooth, especially for the non-segregated Pt3Co(111) whose ΔECl is almost the same among different sites. The results demonstrate that chlorine has a good mobility on Pt3Co surface. In addition, the analysis of projected density of states (PDOS) further reveals the interaction between chlorine and metal substrates. Specifically, the p-states electrons in Cl− can almost fully overlap with the d-states electrons in Pt(111) and Pt3Ni(111), especially between −7.5 eV and −3.8 eV (relevant to the Fermi level, Ef), indicating that chlorine can be strongly bound by these two metal nanocrystals (Fig. 3c). On the other hand, the overlapped area of Cl-p states electrons with the d-states electrons of Pt3Co(111) is relatively small, suggesting a weak interaction between them. For the case of metal nanocrystals with a Pt-skin (Fig. 3d), most of the Cl-p states electrons can interact with metal-d states electrons on Pt3Ni(111)_Ptskin, while only partial Cl-p states electrons have a similar behavior on Pt3Co(111)_Ptskin. Based on the calculation results, we can conclude that Pt3Ni(111) has the strongest ability to adsorb chlorine, and the chlorine is hardly to move on its surface, thereby producing the largest obstruction for the deposition of new atoms. The smallest average Pt-Cl bond length of Pt3Ni(111)-Cl measured from the stable adsorption models (Table S3 in Supporting information) also reflects this overwhelming adsorption effect.
Figure 3
Figure 3.
DFT calculations. (a) Theoretical structures of the Cl−-adsorbed nanocrystal surface. (b) The range of Cl− adsorption energies on different nanocrystal surfaces. PDOS analysis for nanocrystals (c) without and (d) with a Pt-skin on the surface. (e) Vacancy formation energies (Pt, Ni and Co) for Pt NCs, Pt3Ni NCs, and Pt3Co NCs.
Another key point for the construction of HIFs is the etching of surface atoms. In addition, it also influences the final composition of nanocrystals. Therefore, we have calculated the vacancy formation energy (ΔEV) of surface Pt and M atoms on different structures. As summarized in Fig. 3e, the vacancy formation energy of Pt (ΔEV-Pt) is obviously higher than Ni and Co atoms, suggesting that the transitional metal is mainly etched rather than Pt when HCl is added. Besides, the Co vacancy formation energy on Pt3Co(111) is extremely lower than that of Ni on Pt3Ni(111). This result can explain the low transitional metal content of HCl-Pt-Co compared with HCl-Pt-Ni.
From the above analysis, we can deduce the difference of the structure and composition evolution in Pt, Pt3Ni and Pt3Co nanocrystals under HCl etching: (1) Pt3Ni has the strongest chlorine ion adsorption on its surface, which prevent the deposition and the reduction of newly-generated metal atoms, thus regulating the morphology of surface. Besides, Ni is effectively etched by HCl, which further facilitates the growth of HIFs. (2) Although Cl− can also be attached by Pt(111) surface, the high ΔEV-Pt hinders the remove of surface atoms. Therefore, it is difficult to effectively create HIFs on pure Pt surface by HCl etching. (3) The existence of HCl can effectively remove Co atoms in Pt3Co, but the chlorine ions are relatively mobile on the surface. In this case, the hindering effect of new metal atoms deposition cannot be well developed. Hence, the construction of HIFs is also hard for HCl-Pt-Co NCs.
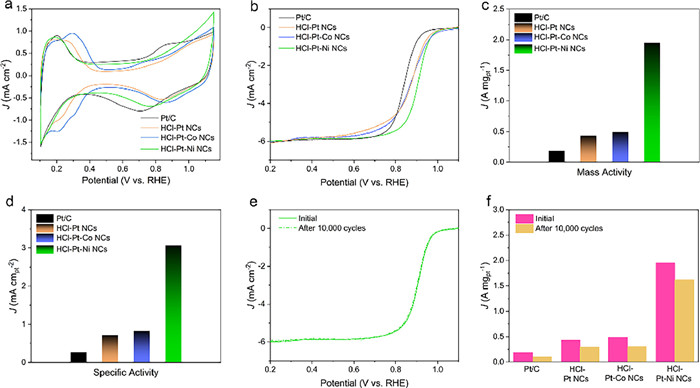
The promotion of the electrocatalytic performance by HIFs was further verified by a series of electrochemical ORR tests. Before the electrochemical test, the as-prepared nanocatalysts were homogeneously deposited onto Vulcan XC-72 carbon and pre-activated. Their electrocatalytic performance was compared with commercial Pt/C catalysts. The loading amount of Pt was 2.6, 2.5, 2.7, and 4.0 µg for HCl-Pt-Ni NCs, HCl-Pt-Co NCs, HCl-Pt NCs, and commercial Pt/C catalysts, respectively (based on ICP-OES). As shown in the cyclic voltammetry (CV) curves (Fig. 4a), the electrochemical active surface area (ECSA) of Pt/C, HCl-Pt NCs, HCl-Pt-Co NCs and HCl-Pt-Ni NCs is 60.0, 61.6, 59.5 and 63.8 m2/gPt. Compared with pure nanocrystals (Fig. S11a and Table S4 in Supporting information), the ECSA value of HCl-etched samples is improved. To further evaluate the ORR performance, the linear sweep voltammetry (LSV) ORR polarization curves were recorded in Fig. 4b. It can be seen that the half-wave potential (E1/2) of different catalysts follows a trend as: HCl-Pt-Ni (0.91 V) > HCl-Pt-Co (0.87 V) > HCl-Pt (0.87 V) > Pt/C (0.84 V). The kinetic currents of the catalysts were calculated based on the Koutecky-Levich equation. Then, the kinetic currents were further normalized with ECSAs and the loading amount of Pt to obtain the mass activity and specific activity of each catalyst. As illustrated in Fig. 4c, HCl-Pt-Ni NCs exhibits a high mass activity of 1.95 A/mgPt at 0.9 V, which is significantly higher than that of Pt/C (0.18 A/mgPt), HCl-Pt NCs (0.43 A/mgPt) and HCl-Pt-Co NCs (0.49 A/mgPt). As for the specific activity (at 0.9 V, Fig. 4d), HCl-Pt-Ni NCs also shows a better enhancement (3.07 mA/cmpt2) than Pt/C (0.27 mA/cmpt2), HCl-Pt NCs (0.71 mA/cmpt2) and HCl-Pt-Co NCs (0.82 mA/cmpt2). The ORR activities of pure Pt and Pt3M NCs were also investigated (Figs. S11b-d and Table S4 in Supporting information). The mass and specific activities of HCl-Pt-Ni NCs are significantly improved compared with pure Pt3Ni NCs, while HCl-Pt NCs and HCl-Pt-Co NCs exhibit no apparent increase in ORR activity. The remarkable ORR activity of HCl-Pt-Ni NCs is resulted from the HIFs and the unique electronic structure [28]. Meanwhile, the ORR durability of HCl-Pt-Ni were also studied by employing an accelerated durability test (ADT) at room temperature. Fig. 4e demonstrates that only an 8 mV negative shifts can be found from the LSV curves of HCl-Pt-Ni NCs, while that for Pt/C, HCl-Pt and HCl-Pt-Co is 90 mV, 30 mV and 29 mV, respectively (Fig. S12 in Supporting information). The mass activity of HCl-Pt-Ni NCs after ADTs is 1.62 A/mgPt (Fig. 4f), with a 16.9% loss compared with its original value. However, its durability still exceeds Pt/C, HCl-Pt NCs and HCl-Pt-Co NCs, with a mass activity loss of 44.7%, 32.5% and 38.1% after ADT. Since ΔEV-Pt is an effective descriptor of the durability of Pt-based nanocrystals, the excellent stability of HCl-Pt-Ni NCs can be reflected by the high ΔEV-Pt of Pt3Ni, especially when the Pt skin is formed on the surface (Fig. 3e) [41].
Figure 4
Figure 4.
Electrocatalytic ORR performance. (a) CV curves, (b) LSV curves, (c) mass activity (@0.9 V), and (d) specific activity (@0.9 V) of Pt/C, HCl-Pt NCs, HCl-Pt-Co NCs and HCl-Pt-Ni NCs. (e) LSV curve evolution of HCl-Pt-Ni after ADTs of 10,000 cycles. (f) mass activity (@0.9 V) variations of Pt/C, HCl-Pt NCs, HCl-Pt-Co NCs and HCl-Pt-Ni NCs after ADTs of 10,000 cycles.
In conclusion, we have demonstrated the effect of HCl etching on different Pt and Pt3M nanocrystals. Under HCl chemical etching, only Pt3Ni NCs can successfully form surface steps (HIFs) compared with Pt and Pt3Co NCs. The difference of structure and composition evolution among those nanocrystals can be concluded to the variation of Cl− adsorption energy as well as the etching rate of surface atoms. Owing to its highly active sites, HCl-Pt-Ni NCs exhibits superior ORR activity with a ~10.8 and ~11.3 times higher mass and specific activities than commercial Pt/C catalyst. Besides, HCl-Pt-Ni also possesses good ORR durability due to the high Pt vacancy formation energy. This study provides a general guidance for the structural and compositional design of high-performance ORR catalysts.
Declaration of competing interest
The authors declare that they have no known competing financial interests or personal relationships that could have appeared to influence the work reported in this paper.
Acknowledgments
This work was financially supported by Nature Science Foundation of Hunan Province (No. 51502343) and the National Key R & D Program of China (No. 2018YFB1900603).
Supplementary materials
Supplementary material associated with this article can be found, in the online version, at doi:10.1016/j.cclet.2023.109188.
[1]
G. Fisseha, Y. Hu, Y. Yu, et al., Chin. Chem. Lett. (2023) 108445.
K. Li, X. Li, H. Huang, et al., J. Am. Chem. Soc. 140 (2018) 16159–16167. doi: 10.1021/jacs.8b08836
Figure 1
(a) Schematic illustration of the preparation process of samples. Structural characterizations of HCl-Pt and HCl-Pt-M NCs. (b) TEM and (c) HAADF-STEM image of HCl-Pt NCs. (d) TEM and (e) HAADF-STEM images of HCl-Pt-Ni NCs. (f) TEM and (g) HRTEM images of HCl-Pt-Co NCs. The inset of (e) shows the formation of unsaturated atoms on HCl-Pt-Ni NCs. EDS-mapping profile of (h) HCl-Pt-Co and (i) HCl-Pt-Ni NCs.
Figure 2
Structural characterizations of the nanocrystals. (a) XRD patterns and (b) Pt 4f XPS spectra of HCl-Pt NCs, HCl-Pt-Co NCs and HCl-Pt-Ni NCs. (c) Co 2p spectra of Pt3Co NCs and HCl-Pt-Co NCs. (d) Ni 2p XPS spectra of Pt3Ni NCs and HCl-Pt-Ni NCs.
Figure 3
DFT calculations. (a) Theoretical structures of the Cl−-adsorbed nanocrystal surface. (b) The range of Cl− adsorption energies on different nanocrystal surfaces. PDOS analysis for nanocrystals (c) without and (d) with a Pt-skin on the surface. (e) Vacancy formation energies (Pt, Ni and Co) for Pt NCs, Pt3Ni NCs, and Pt3Co NCs.
Figure 4
Electrocatalytic ORR performance. (a) CV curves, (b) LSV curves, (c) mass activity (@0.9 V), and (d) specific activity (@0.9 V) of Pt/C, HCl-Pt NCs, HCl-Pt-Co NCs and HCl-Pt-Ni NCs. (e) LSV curve evolution of HCl-Pt-Ni after ADTs of 10,000 cycles. (f) mass activity (@0.9 V) variations of Pt/C, HCl-Pt NCs, HCl-Pt-Co NCs and HCl-Pt-Ni NCs after ADTs of 10,000 cycles.


 DownLoad:


 下载:
下载:


 下载:
下载:
