
Figure 1.
Crystal structure of 1 viewed along (a) the b-axis and (b) a-axis at 293 K. Green dotted lines represent hydrogen bonds. Some of hydrogen atoms are omitted for clarity.
Self-powered stimuli responsive material for dual stimulation of heat and guest molecules
Jintao Men , Ke Xu , Taiting Sha , Lei He , Yan Xu , Jie Mu , Tijian Yin , Qiong Ye

Stimuli-responsive smart materials are materials that can sense and respond to the environment and have the ability to discover functions [1]. When stimulated by environmental factors (such as temperature, pH, ionic strength, chemical properties, electric field, magnetic field, light or chemical components), certain physical or chemical properties (such as phase state, shape, surface energy, reaction rate, permeation rate or recognition performance) of the material itself will change accordingly [2]. They have received widespread attention in the fields of medical engineering, sensors, and information storage [3,4]. Despite the rapid development of this field, research on stimulus-responsive smart perovskite materials with self-powered properties is still uncultivated ground. The three mainstream self-powered methods are piezoelectricity, frictional electricity and thermoelectricity [5]. The research in the field of piezoelectricity was carried out at the earliest, and many research results have been achieved in materials, properties and devices [6]. When a piezoelectric material is stimulated by external stress, the internal deformation process occurs due to external pressure, and the polarization phenomenon occurs to generate electrical signals [7]. Piezoelectric materials can generate electric fields due to mechanical deformation, which theoretically helps to elicit multiple responses from stimuli-responsive smart materials. Therefore, it is valuable to design smart materials with piezoelectric effect for stimuli response.
In various stimuli, temperature is the most commonly used trigger factor [8–10]. Notably, the introduction of water guests is also an effective way to design stimuli-responsive smart materials since hydrogen bonding interactions are weaker than chemical bonds and more prone to breakage and disorder in response to external stimuli [11,12]. In recent years, some stimuli-responsive smart materials by modulating water molecules exhibit phase transition behavior and exhibit dielectric switching, where the water molecules in the pores act as controllers [13–15]. However, there are few reports on second harmonic generation (SHG) switching of molecular water-controlled phase transition materials. This is because the SHG signal is only present in non-centrosymmetric materials [16]. It remains challenging for stimuli-responsive materials to exhibit SHG switching phenomena by losing/adding water molecules.
In this context, we report a self-powered stimuli-responsive material that can exhibit SHG-switching behavior in response to dual stimulation by heat and guest molecules. [HMEP]PbI3·(H2O) (1; HMEP is a hydroxytris(1-methylethyl)phosphorus cation) has excellent piezoelectric properties (d33 = 10 pC/N and output voltage = 1 V). 1 has better piezoelectricity than the conventional inorganic piezoelectric material ZnO (d33 = 3 pC/N). Meanwhile, 1 has an optical band gap of 2.73 eV and exhibits semiconductor properties. Piezoelectric materials can generate energy by mechanical stress, while heating up the material, 1 can lose water to obtain [HMEP]PbI3 (2). 2 undergoes two reversible phase transitions and shows SHG switch at around 315/348 K upon heating and cooling respectively. Interestingly, 2 can return to compound 1 after absorbing water, with the disappearance or return of related physical properties. The different physical properties of such materials under the dual stimulation of heat and guest molecules reveal the great influence of guest water molecules on the SHG properties of organic-inorganic hybrid perovskite materials. The introduction of self-powered features will inspire new designs for stimuli-responsive materials.
The chemicals and reagents needed for the experiment are purchased directly without additional purification. PbI2 (4 mmol, 1.844 g) and HMEP·I (4 mmol, 1.217 g) were dissolved in HI solutions to offer hydrated crystal 1. By slow evaporation at room temperature, the yellow transparent block crystals of [HMEP]PbI3·(H2O) were obtained after several days. As demonstrated in Fig. S1 (Supporting information), the phase purity of compound 1 was verified by comparing the powder X-ray diffraction (PXRD) pattern with the simulation results. The dehydration temperature and decomposition temperature of 1 were determined by thermal gravimetric analysis (TGA). The mass spectra and IR spectra of compounds 1 and 2 are showed in Figs. S2 and S3 (Supporting information). The space group of dehydrated 2 can be confirmed by variable-temperature PXRD. The crystal structure of 1 was detected by single-crystal X-ray diffraction (SCXRD) at 293 K. Differential scanning calorimetry (DSC) and dielectric measurements can determine the phase transition behavior. The measurement methods mentioned above are described in detail in Supporting information.
The crystal structure of 1 is obtained at 293 K. Compound 1 crystallizes in P21 (chiral space group) of monoclinic space group and the cell parameters are shown below: a = 11.511(3) Å, b = 7.8929(14) Å, c = 12.180(4) Å, β = 116.07(4)°, and V = 994.0(5) Å3 (Table S1 in Supporting information). It is seen in Fig. S4 (Supporting information) that he asymmetric unit of 1 contains one HMEP cation, one [PbI3] anion and one water molecule. Notably, one water molecule is bonded to one organic cation by hydrogen bond. The distance of O1···O2 in the O1–H1A···O2 hydrogen bond is 2.439 Å and the angles of the hydrogen bond is 157°. Each [PbI6]4− octahedron shares all six corners with two other neighbors, forming the infinite one-dimensional [(PbI3)−]n chains arranged along the b direction (Figs. 1a and b). Meanwhile, the cations HMEP and the water molecules are located between the inorganic chains. The bond lengths of Pb–I range from 3.2031 Å to 3.2724 Å and the adjacent I-atom angles (I−Pb−I) range from 85.04° to 96.20°, deviating from the ideal octahedral value of 90 ° (Table S2 in Supporting information). To quantify the distortion of the [PbI6]4− octahedron relative to the ideal octahedron, the distorted parameters are calculated by the following mathematical equations: 

When the crystal is pressed by external mechanical force, the displacement of positive charge centers and negative charge center leads to polarization changes. The change of polarization generates detectable current in the circuit between the two relative surfaces of the crystal. This phenomenon is called the piezoelectric effect. Fig. S5a (Supporting information) presents the conceptual model of piezoelectric energy harvesting. The as-grown crystal of 1 has the largest natural (010)-face, and thus the piezoelectric constant d33 along the b-axis needs to be measured. The b-axis of the crystal can be determined by comparing the morphology of the crystal simulated by Materials Studio with the corresponding crystal (Fig. S5b in Supporting information). The quasi-static Berlincourt method was used to measure the piezoelectric coefficient d33. As depicted in Fig. S5c (Supporting information), the average d33 of 1 was as high as 10 pC/N at room temperature. This value is greater than that of many well-known classical piezoelectric materials, for instance, 2 pC/N for SiO2, 3 pC/N for ZnO, and 7 pC/N for Rochelle salt.
Based on the piezoelectric effect of 1, a device with electrode-1-electrode sandwich structure is constructed to detect its energy harvesting ability (Fig. S5d in Supporting information). As illustrated in Fig. 2a, the output voltage is obtained by continuously striking the device with an external mechanical force. While the output voltage of the prepared piezoelectric device is about 1.0 V. This value is higher than traditional inorganic piezoelectric materials ZnO nanowires (0.586 V), ZnO films (0.746 V) [19]. This result envisions the use of compound 1 in self-powered energy harvester devices.

Lead halide hybrid materials are good candidates for semiconductor materials [20]. Therefore, the UV absorption spectrum of 1 was collected at room temperature. Depicted in the spectrum of 1 (Fig. 2b), an absorption onset shift is located at around 486 nm. Based on the Tauc equation, the optical band gap value was determined to be 2.73 eV. This is lower than traditional inorganic semiconductor materials ZnO (3.37 eV) [21]. For all we know, the moderate band gap indicates that it is also a candidate for light-absorbing materials and has great potential for the development of broadband photodetectors [16].
The whole process of the transformation from 1 to 2 was demonstrated by variable-temperature powder X-ray diffraction (PXRD) and TGA measurements. The TGA curve reveals that 1 loses the water molecule per formula unit at around 352 K and starts to decompose at about 465 K (Fig. S6a in Supporting information). Between 352 K and 465 K, [HMEP]PbI3·(H2O) (1) loses its guest water molecules and retains stability in form [HMEP]PbI3 (2). The melting point of compound 2 is about 443 K. However, the dehydrated form 2 is opaque after heating (Fig. S6b in Supporting information). The PXRD patterns of 2 were determined at 220 K, 293 K and 360 K due to the difficulty in obtaining high-quality single crystal structures (Fig. S1). The PXRD pattern of 2 at 293 K is quite different from that found in 1, suggesting a transition to the dehydrated form. 2 also fully reverts to its hydrated form 1 within three days after exposure to water vapor at room temperature. The reversibility of the structural transition between hydrated 1 and dehydrated 2 is verified by PXRD measurements (Fig. S1). This indicates that the stacking framework of compound 1 does not change during the process of high temperature water loss. As the temperature rises, the guest water molecules leave and the skeleton cavities remains. In humid environment, guest water molecules can enter the organic-inorganic hybrid supramolecular framework system again. The number of diffraction peaks observed is significantly reduced after dehydration. According to the result obtained using the Material Studio software, the unit cell parameters for Simulation 2 indicate that it crystallizes in an orthonormal space group Ccc2 in all different temperature phases, different from monoclinic space group P21 of 1 (Fig. S7 in Supporting information). The noncentrosymmetric structure is consistent with the SHG-active signal (Fig. S8 in Supporting information).
DSC can be used to confirm the phase transition of a solid material. From the DSC curve of 1, there is no phase transition behavior between 220 K and 300 K (Fig. S9a in Supporting information). As the temperature goes up, there is a strong endothermic peak between 320 K and 360 K (Fig. S9b in Supporting information). After further cooling, a corresponding exothermic peak appeared at 315 K. The difference between endothermic and exothermic peaks indicates that the phase change from 1 to 2 coexist with the phase transitions of 2. Meanwhile, a pair of peaks appeared in the low-temperature region around 255 K after 1 transforms to 2 (Fig. S9b). For dehydrated 2, two pairs of invertible heat anomalies were observed at 243/255 K and 315/348 K upon cooling and heating respectively (Fig. 3a). Obviously, 2 undergoes two reversible phase transitions at T1 = 255 K, and T2 = 348 K. Fig. S10 (Supporting information) illustrates the stability of the reversible phase transition of 2. As mentioned above, 2 has the same crystal structure at three temperatures. Thus, compound 2 experienced two isostructural phase transition at high and low temperatures respectively. The reason for the phase transition that accompanies the loss of water is as follows: The loss of the guest molecule water causes disappearance of the hydrogen bond and decreases the van der Waals force with the large interionic void. Then the organic cationic or anionic skeleton has more room to move, and two temperature-driven phase transitions occur [1,15,22].
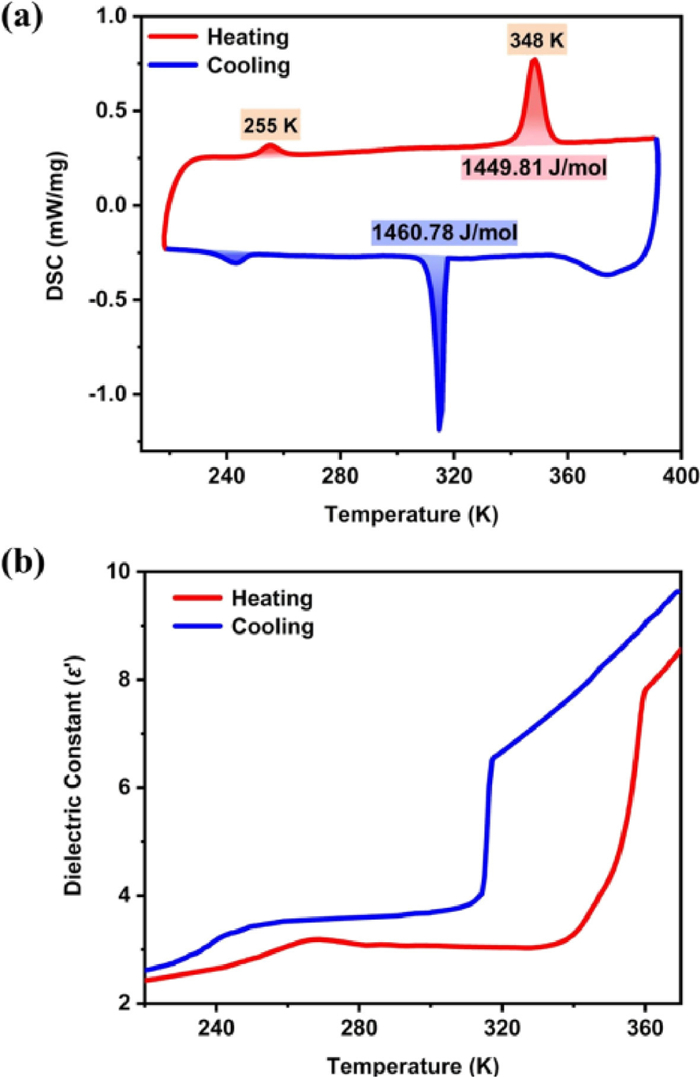
Dielectric response is one of the important indicators of structural transition, and there are usually obvious anomalies at the phase transition point [23–25]. Fig. S11 (Supporting information) shows the temperature dependent real part of the dielectric permittivity (ε′) of 1 at 1 MHz. Between 230 K to 300 K, the dielectric constant of 1 increases slowly with the increase of temperature without dielectric abnormal. For compound 2, the diagram fluctuates slightly with the real part (ε′) increasing from 2.66 to 3.17 when the temperature rises around 255 K (Fig. 3b). With the gradual increase of external temperature, the dielectric constant of 2 increases drastically from 3.15 at 337 K to 7.77 at 358 K. During the cooling process, the ε′ value decreases from 6.52 at 318 K to 3.72 at 306 K and shows a fluctuation at about 243 K. The result shows a steep step-like dielectric anomaly and the possibility of compound 2 as a promising dielectric switching material (Fig. S12 in Supporting information) [26,27]. The value of the dielectric constant mainly depends on the polar components of the molecularity in the structure. Changes in the molecular dynamics of HMEP cations have made significant contributions to the transformation of the ε′ value in compound 2. Fig. S13 (Supporting information) shows the dielectric diagram for different frequencies from 5 kHz to 1 MHz, and the temperature-dependent curve for each frequency showed obvious dielectric anomalies. In addition, ε′ shows distinct frequency dependence and the value of ε′ changes more significantly at low frequencies than those at high frequencies. The possible reason is that the orientation polarization of the molecular inherent electric moment gradually lags behind the change of the external electric field as the frequency increases [16].
Second harmonic measurement is an important method to study quadratic nonlinear optical properties and only non-centrosymmetric crystals have the SHG response. Since 1 crystallized in the chiral space group P21 and 2 crystallized in non-centrosymmetric space group Ccc2, the SHG signals of 1 and 2 at room temperature are measured based on the Kurtz-Perry method. As shown in Fig. S8, KDP (Potassium dihydrogen phosphate) is also measured for comparison. The intensity of SHG response of 1 at room temperature is about 0.22 times that of KDP, while 2 is about 0.26 times. Meanwhile, the SHG response of 2 was measured during the heating and cooling cycles (Fig. 4a). The SHG signal below 333 K is 0.26 times that of KDP (SHG-high state). Between 333 K and 358 K, the intensity of SHG signal decreases to about 0.20 times that of KDP (SHG-low state). Compound 2 can be switched at corresponding highs and lows, showing SHG switching potential. Since 2 belongs to the non-centrosymmetric space group (Ccc2) in all phases, it always has SHG activity. The SHG signal of compound 2 was in good agreement with DSC curve and structure analysis results.
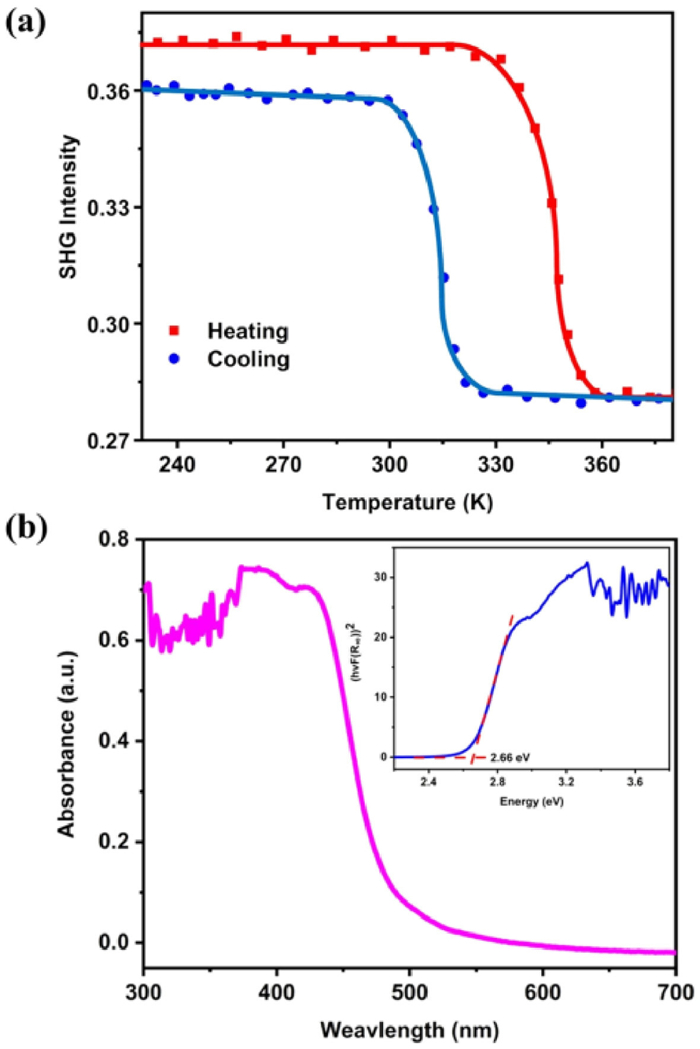
For compound 2, the piezoelectric properties of crystal cannot be obtained because of the loose crystal structure after dehydration. Fig. 4b shows the UV−vis absorption spectra of compound 2. The initial absorption displacement is about 484 nm and the optical band gap value is 2.66 eV (slightly less than 2.73 eV). The loss of water causes the intermolecular forces to weaken. As a result, the valence electrons in the semiconductor valence band are less bound and the minimum energy required to generate an intrinsic excitation is reduced.
In summary, we successfully obtained a self-powered stimuli-responsive material [HMEP]PbI3·(H2O) (1; HMEP is a hydroxytris(1-methylethyl)phosphorus cation), which crystallizes in chiral space groups P21 and has an optical band gap of 2.73 eV. 1 exhibits self-powered performance by piezoelectric effect and has excellent piezoelectric performance (d33 = 10 pC/N and output voltage = 1 V), which is better than the traditional piezoelectric material ZnO. 1 can be dehydrated to obtain [HMEP]PbI3 (2) under the action of energy generated by deformation and heating. There are two reversible phase transitions of 2 at 243/255 K and 315/348 K when heating and cooling, respectively. In addition, SHG switching is found in 2, and it has an optical band gap of 2.66 eV. This result will shed light on the construction of the novel organic-inorganic hybrid perovskite phase transition materials under physical or chemical multi-stimulation and opens the way for exploring new types of smart materials with self-powered properties.
The authors declare that they have no known competing financial interests or personal relationships that could have appeared to influence the work reported in this paper.
This work was financially supported by the National Natural Science Foundation of China (No. 22275033).
Supplementary material associated with this article can be found, in the online version, at doi:
C. Shi, X. Zhang, Y. Cai, et al., Angew. Chem. Int. Ed. 54 (2015) 6206–6210. doi: 10.1002/anie.201501344
D. Yan, Z. Wang, Z. Zhang, Acc. Chem. Res. 55 (2022) 1047–1058. doi: 10.1021/acs.accounts.2c00027
W.J. Chen, Y.L. Pan, J.H. Chen, et al., Chin. Chem. Lett. 29 (2018) 1429–1435. doi: 10.1016/j.cclet.2018.08.011
L. Sun, W.M. Huang, Z. Ding, et al., Mater. Des. 33 (2012) 577–640. doi: 10.1016/j.matdes.2011.04.065
M.A. Hasan, H.T. Wu, Y. Yang, J. Mater. Chem. A 9 (2021) 19116–19148. doi: 10.1039/D1TA02287C
A.H. Rajabi, M. Jaffe, T.L. Arinzeh, Acta Biomater. 24 (2015) 12–23. doi: 10.1016/j.actbio.2015.07.010
L. He, Y.T. Liu, P.P. Shi, et al., ACS Appl. Mater. Interfaces 12 (2020) 53799–53806. doi: 10.1021/acsami.0c16180
W.Q. Liao, Q.Q. Zhou, P.F. Li, Y. Zhang, Chin. Chem. Lett. 25 (2014) 723–726. doi: 10.1016/j.cclet.2014.01.025
Y.Z. Wang, P.P. Shi, K. Xu, et al., Inorg. Chem. Front. 8 (2021) 4858–4863. doi: 10.1039/D1QI01017D
Y.S. Xue, Z.X. Zhang, P.P. Shi, et al., Chin. Chem. Lett. 32 (2021) 539–542. doi: 10.1016/j.cclet.2020.02.005
X.B. Han, P. Hu, C. Shi, W. Zhang, CrystEngComm 18 (2016) 1563–1569. doi: 10.1039/C5CE02066B
X.B. Han, J.M. Xiao, CrystEngComm 18 (2016) 6195–6199. doi: 10.1039/C6CE00854B
X.Y. Dong, B. Li, B.B. Ma, et al., J. Am. Chem. Soc. 135 (2013) 10214–10217. doi: 10.1021/ja403449k
D. Pinkowicz, H.I. Southerland, C. Avendano, et al., J. Am. Chem. Soc. 137 (2015) 14406–14422. doi: 10.1021/jacs.5b09378
Y.L. Liu, W. Zhang, Chem. Commun. 53 (2017) 6077–6080. doi: 10.1039/C7CC00812K
H.Y. Shen, L. He, P.P. Shi, Q. Ye, J. Mater. Chem. C 9 (2021) 4338–4343. doi: 10.1039/D1TC00278C
M.K. Jana, R.Y. Song, H.L. Liu, et al., Nat. Commun. 11 (2020) 10. doi: 10.1038/s41467-019-13807-w
Z.K. Qi, Y.L. Chen, Y. Guo, et al., Chem. Commun. 57 (2021) 2495–2498. doi: 10.1039/D0CC08218J
M. Laurenti, S. Stassi, M. Lorenzoni, et al., Nanotechnology 26 (2015) 9. doi: 10.1088/0957-4484/26/21/215704
Y. Kanemitsu, T. Yamada, T. Handa, M. Nagai, Semicond. Sci. Technol. 35 (2020) 13. doi: 10.1088/1361-6641/ab95b1
B. Kumar, S.W. Kim, Nano Energy 1 (2012) 342–355. doi: 10.1016/j.nanoen.2012.02.001
C. Xue, H. Xu, R.Y. Huang, X.M. Ren, CrystEngComm 16 (2014) 9857–9865. doi: 10.1039/C4CE00997E
Y.Y. Yu, P.Z. Huang, Y.Z. Wang, et al., Chin. Chem. Lett. 32 (2021) 3558–3561. doi: 10.1016/j.cclet.2021.02.040
B.D. Liang, T. Jin, L.P. Miao, et al., Chin. Chem. Lett. 33 (2022) 1422–1424. doi: 10.1016/j.cclet.2021.08.032
Z.B. Liu, L. He, P.P. Shi, Q. Ye, D.W. Fu, J. Phys. Chem. Lett. 11 (2020) 7960–7965. doi: 10.1021/acs.jpclett.0c02235
K. Xu, L. He, Y.Z. Wang, et al., Inorg. Chem. 60 (2021) 10642–10647. doi: 10.1021/acs.inorgchem.1c01292
S.M. Liu, L. He, Y.Z. Wang, P.P. Shi, Q. Ye, Chin. Chem. Lett. 33 (2022) 1032–1036. doi: 10.1016/j.cclet.2021.07.039

Figure 1 Crystal structure of 1 viewed along (a) the b-axis and (b) a-axis at 293 K. Green dotted lines represent hydrogen bonds. Some of hydrogen atoms are omitted for clarity.

Figure 2 (a) Generated output voltages displayed by the digital oscilloscope for a single-crystal sample of 1. (b) UV−vis absorption spectrum of 1 (Inset: the band gap deduced from the absorption spectrum).

Figure 3 (a) DSC curves of 2. (b) Real part (ε′) of the dielectric constant of 2 obtained on heating and cooling at 1 MHz.

 扫一扫看文章

扫一扫关注我们
 DownLoad:
 下载:
下载:

 下载:
下载: