
Figure 1.
(a) XRD patterns and the magnified 2θ range of 18°−20°, and (b) Refined lattice parameters of Ti-0, Ti-2.5%, Ti-5% and Ti-7.5%. The SEM images of (c) Ti-0, (d) Ti-2.5%, (e) Ti-5%, and (f) Ti-7.5%.
Mitigated lattice distortion and oxygen loss of Li-rich layered cathode materials through anion/cation regulation by Ti4+-substitution
Kaicheng Zhang , Yu Tian , Xuanjin Chen , Shan Hu , Zelang Jian

The exploitation of new energy storage application and the development of electric vehicle industry have led to an imperative demand for advanced-performance lithium-ion batteries (LIBs) [1–5]. The development of cathode materials stands pivotal position in accelerating the growth of state-of-the-art LIBs [6]. At present, commercial layered cathode materials, mainly including LiCoO2 and Li[NixCoy(Mn or Al)1‑x‑y]O2 (NCM or NCA) ternary materials, provide less than 200 mAh/g practical specific capacity [7]. Lithium-rich layered cathode materials (LLMs), xLi2MnO3·(1-x)LiTMO2 (TM = Mn, Ni, Co, etc.) have attracted significant attention due to their high redox potential, high specific capacity (>250 mAh/g) and affordable price, which regards as the preferred cathode materials for LIBs [8–11].
The high specific capacity of LLMs is derived from the extraction of Li+ and oxidation of lattice oxygen in monoclinic Li2MnO3 phase [12]. Generally, the de/intercalation of Li+ from LiTMO2 contributes to the capacity at the voltage region lower than 4.4 V, and the Li2MnO3 component is “inactive” in this process [13,14]. When voltage is charged above 4.4 V, the lattice oxygen is released and Li+ is extracted simultaneously from Li2MnO3, resulting in the extra capacity for LLMs [15–17]. However, the loss of O2− will induce TM ions to migrate to Li+ vacancies, causing phase transformation from layer to spinel structure, which occurs on the surface of LLMs [18,19]. The irreversible oxygen evolution and TM ions conversion occur from surface to bulk as cycling, accelerating the capacity degradation, voltage decay and poor rate performance [20–23]. Therefore, the challenge for high-performance LLMs is to consolidate the structure and alleviate the oxygen evolution.
Recently, various attempts have been designed to tackle the unwanted phase transformation and lattice oxygen release to realize practical use of the high-performance LLMs [11–14]. Among them, elemental substitution or ion doping has been one of the effective remedies to boost the electrochemical performance of LLMs. These approaches can mitigate voltage decay, stabilize cycling performance and improve rate properties of LLMs by introducing elements into Li or TM layer, such as Na+ [24], K+ [25], Nb5+ [26], Al3+ [27], Cr3+ [28]. Yang et al. synthesized K-doped Li1.232Mn0.615Ni0.154O2 material with high rate performance and cycling stability, K+ could increase Li layer space to promote the de/intercalation of Li+ and constrict the formation of spinel phase [25]. Cao et al. synthesized Li1.2-xNax(Co0.13Ni0.13Mn0.54)O2 through polymer-pyrolysis strategy, the 3% Na-doped sample provided a higher reversible specific capacity (307 mAh/g), more excellent rate performance (139 mAh/g at 8 C) and cycling property (89% capacity retention after 100 cycles) than the undoped sample [29]. In addition, the substitution in TM slab space could increase bonding energy of metal-oxygen and average chemical valence state of Mn ions, resulting in restraining the Jahn-Teller effect, stabilizing the structure of LLMs and improving the electrochemical performance [30,31]. Wang et al. found Ti could improve structural stability to suppress voltage fading and improve cycling performance in LLMs, the first-principles analyses indicated Ti-substitution could prevent Mn4+ from migrating to Li layer and stabilize the layered structure in materials [32]. However, the recent studies mainly focus on the Ti-substitution of Mn or O ions [28–31], the effect of Ti-substitution on the accommodation to the phase transformation and structure integration still lacks further investigation. Therefore, an optimized Ti-substitution should be designed to mitigate the oxygen evolution and maintain the structure integrity, which will be profit to the improved reversible cycling performance and rate properties.
In this work, we prepared the Ti-substitution LLMs, Li1.2(Mn0.54Ni0.13Co0.13)(1-x)TixO2 through simple high-temperature solid-phase method to consolidate structure and mitigate lattice oxygen release, the Ti-substitution addresses the issues of the LLMs and thus enhances the reversible cycling performance and rate properties. In particularly, XPS was carried out to investigate the Ti-substitution effect on the anion-cation regulation and structure stability. The optimized Ti-substitution regulated the structure integrity by increasing the Ti-O bonding to coordinate transition metal ions. The presence of Ti in the LLMs increases the interplanar spacing and suppresses irreversible oxygen evolution, leading to an improved reversible cycling property and rate performance.
Fig. 1 illustrates XRD patterns of four samples. All strong diffraction peaks can be indexed to the layered α-NaFeO2 structure, which belongs to R-3m space group (Fig. 1a), and the weak peaks between 20° and 30° correspond to the LiMn6 superlattice structure in monoclinic Li2MnO3 phase with C2/m space group [33,34]. No extra peaks are detected in all samples, which indicates the Ti-substitution does not change the lattice structure. The sharp diffraction peaks show good crystallinity of samples [35]. The magnified area of 18°−20° shows that the diffraction peak belonging to (003) plane shifts to lower angles with the increase of Ti content, explaining the larger interplanar spacing [32]. The calculated lattice parameters corresponding to the pristine and Ti-substitution samples are summarized in Fig. 1b through XRD Rietveld refinements by the one-phase model. The results of Rietveld refinements are shown in Fig. S1 and Table S1 (Supporting information), where LiCo1/3Ni1/3Mn1/3O2 is used as reference. The lattice parameters increase with the raise of Ti-substitution, which is consist with XRD patterns (Fig. 1a). The value of c/a (Table S1) can reflect the degree of layered ordering. The values of c/a exceed 4.9, indicating good layered ordering structures in all samples [36,37]. Figs. 1c-f display the corresponding SEM images of Ti-substitution samples. The four samples are composed of the non-homogeneous particles in the size range of 200–400 nm, indicating the large surface area. There are large secondary particles formed by agglomeration of nano particles. With the increase of the Ti-substitution, the morphology maintains round shaped nano grains, which demonstrates that Ti-substitution has not significant effect on the surface morphology and grain size. However, excessive Ti-substitution (Ti-7.5%) leads the grains agglomeration with non-uniform distributed.
In order to investigate the structure of Ti-substitution samples, Ti-0 and Ti-5% samples were compared by HRTEM. As shown in Figs. 2a and b, the d-spacings in HRTEM images are 0.24 and 0.25 nm, corresponding to (101) planes of Ti-0 and Ti-5%, respectively. The enlarged d-spacing implies that Ti4+ exists in the structure of Ti-5% sample. The TEM image and corresponding mapping/energy dispersive X-ray spectrometer (EDS) of Ti-5% are displayed in Figs. 2c-h, the grain size is ranged from 200 nm to 400 nm with blurred boundaries, which confirms the SEM results. Furthermore, Ti4+ is uniformly dispersed in Ti-substitution samples. Fig. S2 (Supporting information) shows the inductively coupled plasma (ICP) results of Ti-5%, the quantitative results are almost consistent with the designed values.

To evaluate the chemical valence variation of anions and cations in Ti-0, Ti-2.5%, Ti-5% and Ti-7.5%, X-ray photoelectron spectroscopy (XPS) was employed. Fig. S4 (Supporting information) shows the XPS spectra of Ti 2p, the 2p3/2 peak of Ti located at 457.9 eV represents Ti4+ [32], which can be detected in all Ti-substitution samples (the results are also presented in Fig. S3 in Supporting information). The peak positions of Ti 2p do not shift and the intensities raise with the increase of Ti-substitution, indicating the stable chemical valence and successful substitution of Ti4+ in Ti-substitution LLMs. In the O 1s spectra (Fig. 3a), a pair of peaks located at about 529.4 eV and 531.2 eV represent metal-oxygen and residual by-products in the process of materials preparation, respectively [38–42]. With the increasing of Ti4+ content, the amount of metal-oxygen gradually increases and the by-products (Li2CO3) decreases. Meanwhile, the characteristic peaks of O 1s slightly shift to the lower energy, which may be derived from the change of metal-oxygen bonding or local environment after Ti-substitution. And the C 1s spectra (Fig. 3b) display the peaks of C-C, C-O-C and O-C=O. The characteristic peak of C-C (284.8 eV) is attributed to hydrocarbon contaminants, which usually appears in the analysis chamber [43,44], the other two peaks are derived from carbonate compound impurities [39]. From Ti-0 to Ti-7.5%, the relative content of hydrocarbon compounds raises, while the amount of carbonate compound impurities decreases from 50.69% to 42.31%. These results demonstrate that Ti-substitution enhances the strength of metal-oxygen bonding and reduces the content of by-products. It is reported that the 3d0 electronic configuration of Ti can coordinate O ligands ionically [45], the enhanced metal-oxygen bonding can improve reversibility of lattice oxygen redox. According to the XPS results, Ti-substitution has accelerated bonding effect on TM ions. In Fig. 3c, the peaks at 642.9 eV and 641.8 eV are close to the binding energy values of Mn4+ and Mn3+ [46], the relative amount of Mn3+ in Ti-0 (16.52%) is least and that in Ti-7.5% (28.57%) is most. The intensity of Mn4+ 2p3/2 decreases and the intensity of Mn3+ 2p3/2 increases, meaning the average valence of Mn ions decreases, which is related to the charge compensation after Ti-substitution. Although the exist of Mn3+ tends to cause Jahn-Teller effect, resulting in the irreversible decrease of Mn ions and the formation of spinel phase [32], Ti4+ can stabilize the structure of Ti-substitution materials, not only making it a supporting role in the Mn site, but also maintaining the structure integrity [45]. Fig. 3d illustrates that the spectra of Ni 2p3/2 are fitted with two characteristic peaks, located around 854.8 eV and 856.7 eV, which can be attributed to Ni2+ and Ni3+ [38–47]. It is obvious that the relative content of Ni2+ decreases and the content of Ni3+ increases after Ti-substitution, and the amount of Ni2+ in Ti-7.5% is 18.19% less than that in Ti-0. In addition, the Ni2+ peak intensity decreases and the shape broadens after Ti4+ enters the structure of materials, which further reveals the low relative amount of Ni2+ in Ti-substitution samples. Because the ionic radius of Ni2+ (0.69 Å) is close to that of Li+ (0.76 Å), Ni2+ can enter Li layer and occupy vacant sites after Li+ extraction. It will hinder the migration channel of Li+, making a low specific capacity and poor cycling performance [48–51]. Ti-substitution can effectively reduce the degree of Li+/Ni2+ mixing to realize high electrochemical performance for LLMs. The spectra of Co 2p3/2 (Fig. S5 in Supporting information) present two peaks of Co2+ and Co3+, respectively [52], the main valence state of Co ions in all samples is +3 and Co3+ shows an increasing trend with the increase of Ti4+ content [53].

Fig. 4 illustrates the electrochemical performances of Ti-0, Ti-2.5%, Ti-5% and Ti-7.5%. Figs. 4a and b show the charge-discharge voltage curves of Ti-0 and Ti-5% at the current density of 50 mA/g, respectively. The charge-discharge curve diagram of Ti-2.5% and Ti-7.5% are displayed in Fig. S6 (Supporting information). The first charge/discharge curves of all samples present two distinct charging plateaus. The smooth slope at around 4 V is the result of the oxidation of Ni2+ and Co3+ in LiTMO2 phase, and the long voltage plateau above 4.5 V is attributed to the migration of Li+ and accompanying oxidation of lattice oxygen [54]. The redox process for lattice oxygen at 4.5 V is considered in two sections: the reversible oxygen redox (O2−/On−) and the irreversible oxygen release from the surface in LLMs. The irreversible oxygen release will cause the capacity decay in subsequent cycles [11]. Since Ti4+ keeps constant in the device operation, the initial discharge capacity of the samples is slightly reduced because of Ti-substitution. The initial discharge capacity of Ti-0, Ti-2.5%, Ti-5% and Ti-7.5% is 251.6, 238.2, 244.2 and 234.6 mAh/g, respectively. It is worth noting that a short plateau (at 2.5 V) exists in the subsequent charge/discharge curves of Ti-0, which attributes to the redox of Mn4+/Mn3+ in the vicinity of the spinel phase region [55]. This means that the structure of Ti-0 is easily changed and the electrochemical performance will be diminished during the cycling process. The short discharge plateau corresponding to Mn4+/Mn3+ couple is not displayed in the charge/discharge curves of Ti-substitution samples (Fig. 4b and Fig. S6). In comparison, Ti-5% sample maintains a stable capacity retention as large as 99.76% after 10 cycles.
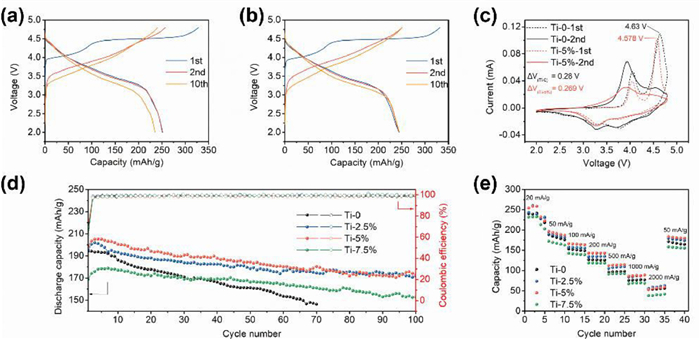
To analyze the influence of Ti-substitution on the electrochemical behavior of Li1.2Mn0.54Ni0.13Co0.13O2, the dQ/dV curves of the initial charge/discharge plots for all samples are displayed in Fig. S7 (Supporting information). The two anodic peaks located around 4 V and 4.5 V correspond to the oxidation of TM ions and lattice oxygen [56]. During the first discharge process, there is a weak reduction peak around 4.3 V, which is considered to the reduction of Ni4+. The reduction peak of Co3+/Co4+ couple is located at 3.7 V [26]. The distinct reduction peak below 3.5 V is derived from the reduction of Mn4+, which compensates for the charge loss due to the irreversible oxidation of lattice oxygen [57]. The intensities of the anodic peak of lattice oxygen and the reduction peak of Mn4+/Mn3+ redox gradually decrease with the increase of Ti4+ amount, indicating that the strong Ti-O bonding alleviates the oxygen release and decreases the reduction of Mn4+, which contributes to the stable structure in Li1.2Mn0.54Ni0.13Co0.13O2. The cyclic voltammetry (CV) was employed to further determine the influence of Ti-substitution for electrochemical performance. As shown in Fig. 4c, the CV plots in the initial cycle for Ti-0 and Ti-5% possess the same electrochemical trend (Fig. S7). The oxidation peak of lattice oxygen for Ti-5% is located at 4.58 V, and the peak for Ti-0 is at 4.63 V. The oxidation peak shifts to the lower voltage position after introducing Ti-substitution, which implies that the redox of oxygen becomes easier [45]. The oxidation peak above 4.5 V disappears and a new oxidation peak (3.7–4.2 V) appears in the second cycle, which is related to the oxidation for Ni2+ and Co3+. In the second CV for Ti-0, the slight reduction peak (~2.5 V) corresponds to the short plateau in the second discharge curve (Fig. 4a), revealing that the layered structure of Ti-0 changes during cycling progresses. This result can also be evidenced by the CV plots in Fig. S8 (Supporting information). The potential interval value (ΔV) between oxidation and reduction peaks can reflect the polarization and electrochemical reversibility of samples [58]. In Fig. 4c and Fig. S8 (Supporting information), the values of ΔV for Ti-0 and Ti-5% are 0.28 V and 0.269 V, respectively. The smaller ΔV reflects the lower polarization associated with the Li+ diffusion. Thereby, Ti-5% shows a better electrochemical reversibility and smaller polarizability.
Fig. 4d shows the cycling performance of four samples at the current density of 200 mA/g. Ti-0 delivers the initial discharge capacity of 194.1 mAh/g with a decreased capacity retention rate of 75.37%. Compared with Ti-0, the discharge capacity of Ti-2.5%, Ti-5% and Ti-7.5% is 172.0, 175.7 and 152.9 mAh/g after 100 cycles, corresponding to the capacity retention rate of 85.82%, 87.28% and 85.39%, respectively. The Ti-5% sample exhibits the best cycling stability, which corresponds to the analysis result of CV plots. Fig. 4e displays the rate performance of four samples at the current density of 20, 50, 100, 200, 500, 1000, 2000, 50 mA/g. Ti-0 delivers the discharge capacity of 233.4, 181.9, 150.8, 126.3, 97.3, 76.8, 54.3, 167.6 mAh/g. Ti-5% exhibits an improved rate performance than Ti-0 with a capacity of 245.3, 191.5, 165.2, 143.1, 113.7, 87.5, 56.5, 181.3 mAh/g, respectively. However, Ti-7.5% achieves a decreased discharge capacity from 222.8 mAh/g to 39.9 mAh/g. The results suggest that the appropriate amount of Ti-substitution can expand the layer spacing to facilitate Li+ diffusion, maintain the structure stability to alleviate the phase transformation, contributing to the improved cycling and rate performance. However, excess Ti4+ will hinder the reversible migration of Li+ and cause the large capacity loss.
In order to validate that Ti-substitution is beneficial to stabilize lattice structure and improve cycling property. Fig. 5 compares the structure and chemical valence changes of the pristine and Ti-substitution materials after 100 cycles. As shown in Fig. 5a, the characteristic peaks of XRD patterns are attributed to the layered structure. A value of I(003)/I(104) above 1.2 can reflect the well-ordered layered structure as reported [26]. The value of I(003)/I(104) is 1.72, 1.86, 2.09 and 2.01 for Ti-0, Ti-2.5%, Ti-5% and Ti-7.5%, respectively, which implies that the good layered structure is maintained after 100 cycles. In addition, the value of I(003)/I(104) determines the degree of TM ions mixing in Li slabs [59]. The value of I003)/I(104) in Ti-5% (2.09) becomes higher compared to Ti-0, indicating that Ti-substitution can reduce ion mixing of materials after cycle. While the I(003)/I(104) of Ti-7.5% is lower than that of Ti-5% due to the excess Ti increasing the degree of ion mixing. The XRD patterns before and after 100 cycles are shown in Fig. S9 (Supporting information). It is obvious that the characteristic peaks shift to smaller 2θ becomes sluggish after 100 cycles with the increase of Ti4+, suggesting that Ti-substitution can weaken the distortion of lattice structure in the cycling process. In addition, XPS was used to investigate the composition for Ti-5% and Ti-0 samples after 100 cycles (Figs. 5b-d). The characteristic peaks (533.3 eV) of O 1s for Ti-0 and Ti-5% after 100 cycles are attributed to organic species of oxygen containing groups in SEI (Fig. 5b) [60]. The characteristic peak of metal-oxygen weakens and the peak of Li2CO3 becomes greater after 100 cycles (Figs. 5b and 3a). The relative content of metal-oxygen in Ti-5% is higher than that in Ti-0, implying stronger metal-oxygen in Ti-substitution samples. Fig. 5c shows that the Mn3+ content of Ti-5% is less than Ti-0, and the Mn3+ relative content of Ti-5% and Ti-0 before 100 cycles (Fig. 3c) is 25.42% and 16.52%, respectively. The difference of Mn 2p1/2 and 2p3/2 peaks for Ti-5% and Ti-0 samples illustrates decreased Mn3+ during cycling process, which is associated with the Ti4+ substitution. These findings confirm that Ti4+ inhibits the release of lattice oxygen and avoids the reduction of more Mn4+. Comparing with Ni 2p spectra before 100 cycles (Fig. 3d), the characteristic peaks of Ni 2p3/2 and Ni 2p1/2 for Ti-5% and Ti-0 slightly drift to higher binding energy (Fig. 5d), suggesting that Ni is not completely reduced during discharge process [61]. The Ni3+ relative content for Ti-5% is greater and the degree of Li+/Ni2+ mixing is lower, which is fitted well with the XRD results. The characteristic peaks of Ti 2p barely shift after 100 cycles (Fig. S10 in Supporting information) due to the stability of Ti in material structure. Fig. S11 (Supporting information) shows the morphology and structure of all the samples after 100 cycles. The grains severely crushed and the particles agglomerated in Ti-0 sample. The grains of Ti-2.5% and Ti-5% samples remain intact, while the particle flatness decreases for Ti-7.5%. These results demonstrate that the appropriate amount of Ti-substitution effectively maintains the structure integrity, therefore contributing to the improved cycle life of materials.

In summary, the Ti-substitution LLMs Li1.2(Mn0.54Ni0.13Co0.13)(1-x)TixO2 (x = 0, 2.5%, 5%, 7.5%) are successfully synthesized by a simple solid-state sintering method. The effects of Ti-substitution on structure stability, inhibition of lattice oxygen release, and improvement of electrochemical performance of LLMs are verified in depth by a series of characterization and test methods. The designed Ti-substitution can expand layer spacing and maintain a stable structure. Moreover, Ti-substitution increases the Ni3+/Ni2+ ratio, inhibits the reduction of Mn4+ in cycling process and mitigates the release of lattice oxygen through the regulation of cations and anions (Fig. 6). The well-ordered layered cathode materials demonstrate a high discharge specific capacity and good capacity retention of 244.2 mAh/g at 50 mA/g and 87.28% after 100 cycles at 200 mA/g, indicating that the appropriate amount of Ti-substitution accelerates the diffusion rate of Li+ and stabilizes the material layered structure, thereby improving the electrochemical performance in LLMs. This study provides a new idea to design a Ti-substitution Li-rich layered cathode materials with an enhanced life span and good reversible capacity retention.

The authors declare that they have no conflict of interest.
This work was financially supported by the National Natural Science Foundation of China (Nos. 51972258, 22109186).
Supplementary material associated with this article can be found, in the online version, at doi:
Z. Yu, J. Song, M.L. Gordin, et al., Adv. Sci. 2 (2015) 1400020. doi: 10.1002/advs.201400020
J.P. Huang, P.C. Zhong, Y. Ha, et al., Nat. Energy 6 (2021) 706–714. doi: 10.1038/s41560-021-00817-6
V. Etacheri, R. Marom, R. Elazari, et al., Energy Environ. Sci. 4 (2011) 3243–3262. doi: 10.1039/c1ee01598b
X.B. Ding, H.Y. Huang, Q.H. Huang, et al., J. Energy Chem. 77 (2023) 280–289. doi: 10.1016/j.jechem.2022.10.049
X.B. Ding, Q.H. Huang, X.H. Xiong, Acta Phys. Chim. Sin. 38 (2022) 2204057. doi: 10.3866/pku.whxb202204057
M. Li, J. Lu, Z.W. Chen, et al., Adv. Mater. 30 (2018) 1800561. doi: 10.1002/adma.201800561
B. Qiu, J. Wang, Y.G. Xia, et al., ACS Appl. Mater. Interfaces 6 (2014) 9185–9193. doi: 10.1021/am501293y
J.W. Choi, D. Aurbach, Nat. Rev. Mater. 1 (2016) 16013. doi: 10.1038/natrevmats.2016.13
S.J. Hu, A.S. Pillai, G.M. Liang, et al., Electrochem. Energy Rev. 2 (2019) 277–311. doi: 10.1007/s41918-019-00032-8
S.M. Zhang, H.T. Gu, H.G. Pan, et al., Adv. Energy Mater. 7 (2017) 1601066. doi: 10.1002/aenm.201601066
X.Q. Ji, Q. Xia, Y.X. Xu, et al., J. Power Sources 487 (2021) 229362. doi: 10.1016/j.jpowsour.2020.229362
H.J. Yu, H.J. Kim, Y.R. Wang, et al., Phys. Chem. Chem. Phys. 14 (2012) 6584–6595. doi: 10.1039/c2cp40745k
G. Assat, D. Foix, C. Delacourt, et al., Nat. Commun. 8 (2017) 2219. doi: 10.1038/s41467-017-02291-9
W. He, W.B. Guo, H.L. Wu, et al., Adv. Mater. 33 (2021) 2005937. doi: 10.1002/adma.202005937
J.R. Croy, K.G. Gallagher, M. Balasubramanian, et al., J. Electrochem. Soc. 161 (2013) A318–A325.
Z.H. Lu, J.R. Dahn, J. Electrochem. Soc. 149 (2002) A815–A822. doi: 10.1149/1.1480014
D.L. Ye, G. Zeng, K. Nogita, et al., Adv. Funct. Mater. 25 (2015) 7488–7496. doi: 10.1002/adfm.201503276
J. Ma, Y.N. Zhou, Y.R. Gao, et al., Chem. Mater. 26 (2014) 3256–3262. doi: 10.1021/cm501025r
S.Q. Zhao, K. Yan, J.Q. Zhang, et al., Angew. Chem. Int. Ed. 60 (2021) 2208–2220. doi: 10.1002/anie.202000262
L. de Biasi, B. Schwarz, T. Brezesinski, et al., Adv. Mater. 31 (2019) 1900985. doi: 10.1002/adma.201900985
B. Xu, C.R. Fell, M.F. Chi, et al., Energy Environ. Sci. 4 (2011) 2223–2233. doi: 10.1039/c1ee01131f
K. Jarvis, C.C. Wang, M. Varela, et al., Chem. Mater. 29 (2017) 7668–7674. doi: 10.1021/acs.chemmater.7b00120
S. Liu, Z.P. Liu, X. Shen, et al., Adv. Energy Mater. 8 (2018) 1802105. doi: 10.1002/aenm.201802105
K. Du, F. Yang, G.R. Hu, et al., J. Power Sources 244 (2013) 29–34. doi: 10.1016/j.jpowsour.2013.04.152
Z. Zheng, X.D. Guo, Y.J. Zhong, et al., Electrochim. Acta 188 (2016) 336–343. doi: 10.1016/j.electacta.2015.12.021
S.D. Dong, Y. Zhou, C.X. Hai, et al., J. Power Sources 462 (2020) 228185. doi: 10.1016/j.jpowsour.2020.228185
P.K. Nayak, J. Grinblat, M. Levi, et al., Adv. Energy Mater. 6 (2016) 1502398. doi: 10.1002/aenm.201502398
C.C. Wang, A. Manthiram, J. Mater. Chem. A 1 (2013) 10209–10217. doi: 10.1039/c3ta11703k
W. He, D.D. Yuan, J.F. Qian, et al., J. Mater. Chem. A 1 (2013) 11397–11403. doi: 10.1039/c3ta12296d
S.H. Wang, J. Yang, X.B. Wu, et al., J. Power Sources 245 (2014) 570–578. doi: 10.1016/j.jpowsour.2013.07.021
Z.Q. Deng, A. Manthiram, J. Phys. Chem. C 115 (2011) 7097–7103. doi: 10.1021/jp200375d
Z.X. Yu, S.L. Shang, M.L. Gordin, et al., J. Mater. Chem. A 3 (2015) 17376–17384. doi: 10.1039/C5TA03764F
W. Pan, W.J. Peng, G.C. Yan, et al., Energy Technol. 6 (2018) 2139–2145. doi: 10.1002/ente.201800253
B.H. Song, H.W. Liu, Z.W. Liu, et al., Sci. Rep. 3 (2013) 3094. doi: 10.1038/srep03094
X.W. Lai, G.R. Hu, Z.D. Peng, et al., J. Power Sources 431 (2019) 144–152. doi: 10.1016/j.jpowsour.2019.05.044
Q. Sa, E. Gratz, M.N. He, et al., J. Power Sources 282 (2015) 140–145. doi: 10.1016/j.jpowsour.2015.02.046
B.Z. Chen, B.C. Zhao, J.F. Zhou, et al., J. Mater. Sci. Technol. 35 (2019) 994–1002. doi: 10.1016/j.jmst.2018.12.021
X.B. Zheng, X.H. Li, Z.X. Wang, et al., Electrochim. Acta 191 (2016) 832–840. doi: 10.1016/j.electacta.2016.01.142
H.S. Liu, Y. Yang, J.J. Zhang, J. Power Sources 162 (2006) 644–650. doi: 10.1016/j.jpowsour.2006.07.028
X.H. Xiong, Z.X. Wang, P. Yue, et al., J. Power Sources 222 (2013) 318–325. doi: 10.1016/j.jpowsour.2012.08.029
Y.J. Zhao, S.J. Wang, W.F. Ren, et al., J. Electrochem. Soc. 160 (2012) A82–A86.
G.C. Yan, X.H. Li, Z.X. Wang, et al., J. Power Sources 263 (2014) 231–238. doi: 10.1016/j.jpowsour.2014.04.060
A.M. Andersson, D.P. Abraham, R. Haasch, et al., J. Electrochem. Soc. 149 (2002) A1358–A1369. doi: 10.1149/1.1505636
X.D. Ma, C. Ji, X.K. Li, et al., Mater. Today 59 (2022) 36–45. doi: 10.1016/j.mattod.2022.08.013
S. Liu, Z.P. Liu, X. Shen, et al., Adv. Energy Mater. 9 (2019) 1901530. doi: 10.1002/aenm.201901530
S. Ivanova, E. Zhecheva, R. Stoyanova, et al., J. Phys. Chem. C 115 (2011) 25170–25182. doi: 10.1021/jp208976h
A.W. Moses, H.G.G. Flores, J.G. Kim, et al., Appl. Surf. Sci. 253 (2007) 4782–4791. doi: 10.1016/j.apsusc.2006.10.044
J.X. Chen, Z. Huang, W.H. Zeng, et al., ACS Appl. Mater. Inter. 14 (2022) 6649–6657. doi: 10.1021/acsami.1c21182
C.C. Fu, G.S. Li, D. Luo, et al., ACS Appl. Mater. Inter. 6 (2014) 15822–15831. doi: 10.1021/am5030726
H.J. Yu, Y.M. Qian, M.R. Otani, et al., Energy Environ. Sci. 7 (2014) 1068–1078. doi: 10.1039/c3ee42398k
X.Y. Zhang, W.J. Jiang, A. Mauger, et al., J. Power Sources 195 (2010) 1292–1301. doi: 10.1016/j.jpowsour.2009.09.029
F.H. Zheng, X. Ou, Q.C. Pan, et al., Chem. Eng. J. 334 (2018) 497–507. doi: 10.1016/j.cej.2017.10.050
Y.F. Chen, Y.C. Liu, J.C. Zhang, et al., Energy Storage Mater. 51 (2022) 756–763. doi: 10.1016/j.ensm.2022.07.016
X.Q. Yu, Y.C. Lyu, L. Gu, et al., Adv. Energy Mater. 4 (2014) 1300950. doi: 10.1002/aenm.201300950
D. Luo, J.X. Cui, B.K. Zhang, et al., Adv. Funct. Mater. 31 (2021) 2009310. doi: 10.1002/adfm.202009310
T.G. Lin, T.U. Schulli, Y.X. Hu, et al., Adv. Funct. Mater. 30 (2020) 1909192. doi: 10.1002/adfm.201909192
Y.X. Sun, Y. Zhou, L.J. Zhang, et al., J. Alloys Compd. 723 (2017) 1142–1149. doi: 10.1016/j.jallcom.2017.06.114
Y. Li, H. Huang, J.G. Yu, et al., J. Alloys Compd. 783 (2019) 349–356. doi: 10.1016/j.jallcom.2018.12.357
T.H. Wu, X. Liu, X. Zhang, et al., Adv. Mater. 33 (2021) 2001358. doi: 10.1002/adma.202001358
B. Philippe, R. Dedryvère, M. Gorgoi, et al., Chem. Mater. 25 (2013) 394–404. doi: 10.1021/cm303399v
M.G. Verde, H.D. Liu, K.J. Carroll, et al., ACS Appl. Mater. Interfaces 6 (2014) 18868–18877. doi: 10.1021/am504701s

Figure 1 (a) XRD patterns and the magnified 2θ range of 18°−20°, and (b) Refined lattice parameters of Ti-0, Ti-2.5%, Ti-5% and Ti-7.5%. The SEM images of (c) Ti-0, (d) Ti-2.5%, (e) Ti-5%, and (f) Ti-7.5%.

Figure 2 The HRTEM images alone the [101] zone axis for (a) Ti-0, and (b) Ti-5%. The low magnification (c) and the mapping of Ni (d), Co (e), Mn (f), O (g) and Ti (h) for Ti-5%.

Figure 3 High-resolution XPS spectra for (a) O 1s, (b) C 1s, (c) Mn 2p, and (d) Ni 2p of Ti-0, Ti-2.5%, Ti-5% and Ti-7.5%.

Figure 4 The 1st, 2nd and 10th charge-discharge voltage profiles of (a) Ti-0, and (b) Ti-5% at 50 mA/g. (c) CV curves of Ti-0 and Ti-5% in the first two cycles at the scan rate of 0.1 mV/s. The cycling performance (d) at 200 mA/g and rate properties (e) for all samples.

Figure 5 (a) The XRD patterns of Ti-0, Ti-2.5%, Ti-5% and Ti-7.5% after 100 cycles. The high-resolution XPS spectra of (b) O 1s, (c) Mn 2p, and (d) Ni 2p for Ti-0 and Ti-5% after 100 cycles.

 扫一扫看文章

扫一扫关注我们
 DownLoad:
 下载:
下载:

 下载:
下载: