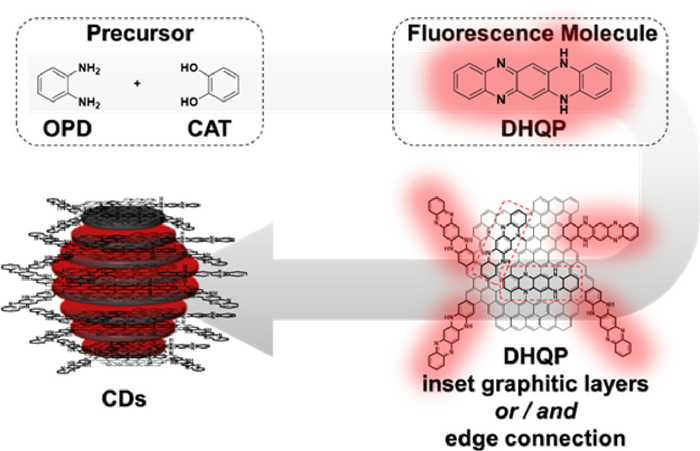
Scheme 1.
Mechanisms of photoluminescence in the molecular state of carbon dots prepared by o-phenylenediamine.
Mechanisms of photoluminescence in the molecular state of carbon dots prepared from o-phenylenediamine
Feishi Shan , Jing Zhang , Chengshuang Liao , Zhouyu Wang , Leyong Wang

Carbon dots (CDs) is an emerging photoluminescent (PL) carbon nanomaterial. Since its discovery in 2004 [1], CDs have been used in a wide range of applications such as sensing, optical devices, in-vitro imaging, in-vivo imaging and phototherapy due to their excellent PL properties [2,3]. However, the intrinsic PL mechanism of CDs remains unclear, and a unified mechanism has not been achieved due to the different structures of various CDs. Therefore, the investigation of the PL mechanism of CDs is necessary and urgent to reveal the structure of CDs, to better guide the synthesis and to promote the deeper applications of CDs.
Currently, there are three accepted mechanisms for PL of CDs: nuclear state emission, surface state emission, and molecular state emission [4]. The discovery and identification of small molecule fluorophores has provided strong evidence for the molecular state emission mechanism [5]. An increasing number of research groups have devoted to the investigation of the molecular state emission mechanism of CDs. In 2015, imidazo[1,2-a]pyridine-7-carboxylic acid (IPCA) small molecules has been isolated and purified in the preparation of CDs based on citric acid (CA) and ethylenediamine (EDA) by Yang's group [6]. In 2018, Kasprzyk's group obtained 4–hydroxy-1H-pyrrolo[3,4-c]pyridine-1,3,6(2H,5H)-trione (HPPT) which is green photoluminescent molecule by solid-phase preparation of CA with urea (U) [7]. In 2022, Haynes' group similarly isolated the unconventional fluorophore 5-oxopyrrolidine-3-carboxylic acid in a CA-U CDs system [8]. These works have used aliphatic molecules to prepare CDs and isolate fluorophores from them. Fluorophores in CDs prepared from aromatic molecules have rarely been reported.
Sun's group from Beijing University of Technology, China, developed a high yield synthesis of red-emission CDs from o-phenylenediamine (OPD) and catechol (CAT) (Scheme 1). High-resolution transmission electron microscopy (HRTEM) images show that CDs were successfully prepared with excellent crystallinity. 5,14-Dihydroquinoxalino[2,3-b]phenazine (DHQP) was isolated and proved to be a fluorophore for CDs by detailed characterization. Moreover, the differences in optical properties between CDs and DHQP are investigated in detail. These results provide a clearer idea for understanding the structure of CDs from optical perspective.
The authors initially realized that the mixed solution gradually turned from colorless to reddish and exhibits emission behaviors similar to CDs, when OPD and CAT ethanol solution are mixed at room temperature by the molar ratio of 1:1. As a result, they speculate that the PL mechanism of such CDs should belong to the molecular state of fluorescence. To confirm the fluorophores of CDs, the relations between CDs and DHQP were considered by the authors when the fluorophore of CDs was clarified.
Firstly, the effects of solvent, pH and time-resolved PL on the optical properties of CDs and DHQP were compared to corroborate the fluorophore of CDs as DHQP. DHQP and CDs have very similar optical properties, however, their thermal behaviors are quite different (Fig. 1a), implying no free DHQP is contained in the CDs.
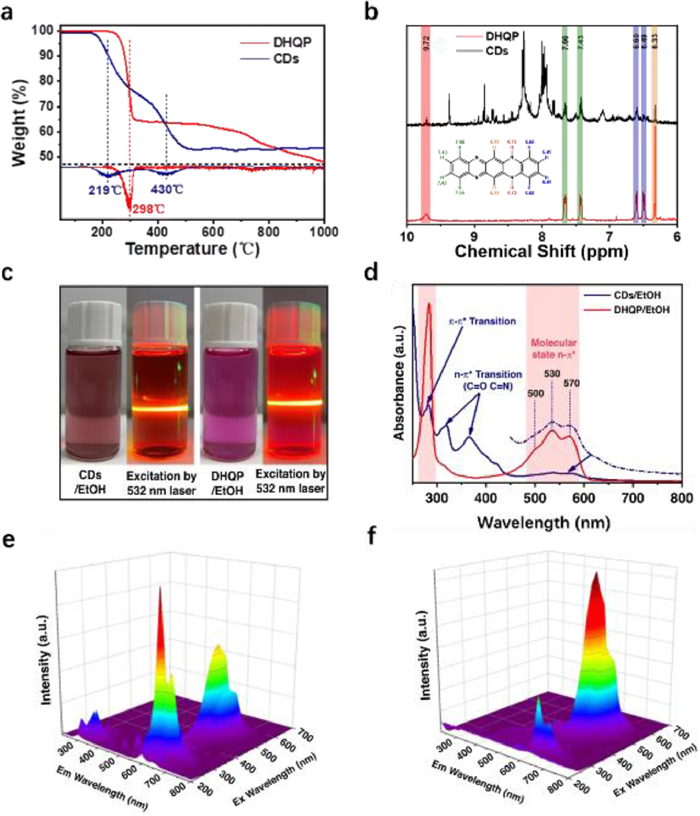
Secondly, the 1H NMR spectra of CDs and DHQP were investigated in comparison (Fig. 1b). The H of the benzene ring at the DHQP molecular edge significantly disappeared and became weaker as seen in the CDs' 1H NMR spectra. This suggests that the benzene ring at the edge of the DHQP molecule can be incorporated into the structure of the core of the conjugated CDs.
Thirdly, the CDs and DHQP were dissolved in EtOH respectively, with the CDs solution in ethanol showing a dark red color and the DHQP solution showing a purple color (Fig. 1c), implying that they have different UV–vis absorption spectra (Fig. 1d). Notably, CDs exhibit unique absorption bands at 318 and 366 nm, which are absent in DHQP. This may be assigned to the n-π* transition of the C=N on the CDs surface. Furthermore, the absorption bands of CDs are the same as those of DHQP at 480–600 nm and 285 nm, which can be attributed to the n-π* and π-π* transitions of the molecular units, respectively. For the DHQP, as shown in Fig. 1e, the excitation wavelength of 285 nm gives more contribution to the emission at 600 nm. In contrast, the absorption at 520 nm is the largest contributor to red emission for CDs (Fig. 1f).
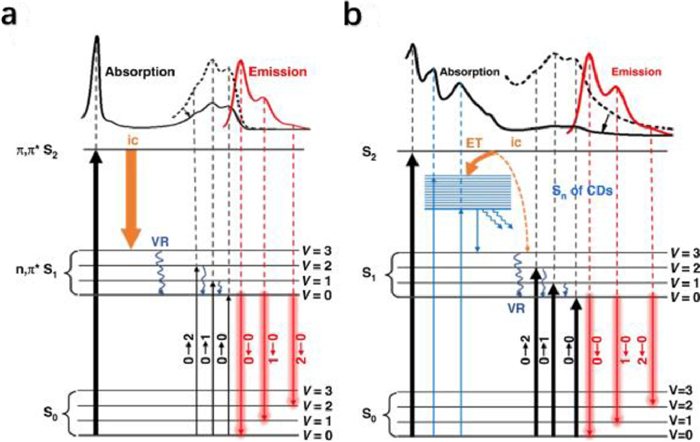
Finally, the PL mechanisms of DHQP and CDs are carefully analyzed as shown in Fig. 2. The reason for the greater contribution of 285 nm excitation to red emission for DHQP is that the π-π* transition here corresponds to an energy level transition between S0 and S2, where the excited electrons decay to the lowest vibrational energy level of S1 via internal conversion (ic) and vibrational relaxation, and then return to S0 via 0–0, 0–1, and 0–2 radiative emission transitions (Fig. 2a). In the case of CDs, DHQP is connected or embedded with the carbon core via the sp3 substrate, and DHQP on CDs dominates the photoluminescent behavior. However, the absorption peak at 285 nm contributes less to the red emission, probably due to the transfer of excited electrons to the energy level of CDs (Sn), which is mainly a non-radiative transition. The new excitation energy level Sn is associated with an absorption band at 318 nm and 366 nm, between S1 and S2. Electrons from S2 can be transferred to the Sn of CDs, competing with the internal transition between S2 and S1, resulting in a decrease in the intensity of PL excited by the 285 nm band (Fig. 2b).
The exploration of the structure of CDs and the revelation of the PL mechanism have contributed to the understanding of CDs and contributed to the targeted design and precise synthesis of CDs. CDs with molecular state emission retains both the excellent optical properties of fluorescent molecules and the excellent properties of CDs, such as good water solubility, low toxicity and biocompatibility. It promises to be an emerging alternative to traditional organic optical materials. Sun's work will be beneficial for the further development of molecular state emission CDs and the schematic of the DHQP molecule cross-linked with the CDs described provides extremely useful insight.
X. Xu, R. Ray, Y. Gu, et al., J. Am. Chem. Soc. 126 (2004) 12736–12737. doi: 10.1021/ja040082h
J. Liu, R. Li, B. Yang, ACS. Cent. Sci., 6 (2020) 2179–2195. doi: 10.1021/acscentsci.0c01306
F. Shan, L. Fu, X. Chen, et al., Chin. Chem. Lett. 33 (2022) 2942–2948. doi: 10.1016/j.cclet.2021.12.094
B.Y. Wang, S.Y. Lu, Matter. 5 (2022) 110–149. doi: 10.1016/j.matt.2021.10.016
Y. Xiong, J. Schneider, E.V. Ushakova, A.L. Rogach, Nano Today 23 (2018) 124–139. doi: 10.1016/j.nantod.2018.10.010
Y. Song, S. Zhu, S. Zhang, et al., J. Mater. Chem. C 3 (2015) 5976–5984. doi: 10.1039/C5TC00813A
W. Kasprzyk, T. Swiergosz, S. Bednarz, et al., Nanoscale 10 (2018) 13889–13894. doi: 10.1039/C8NR03602K
X. Yao, Y. Wang, F. Li, et al., Nanoscale 14 (2022) 9516–9525. doi: 10.1039/d2nr02361j
P. Li, S. Xue, L. Sun, et al., Light Sci. Appl. 11 (2022) 298. doi: 10.1038/s41377-022-00984-5

Scheme 1 Mechanisms of photoluminescence in the molecular state of carbon dots prepared by o-phenylenediamine.

Figure 1 (a) TGA spectrum of CDs and DHQP (the illustration below is the weight loss peaks of CDs and DHQP through the derivation of the TGA data). (b) The large version of 1H NMR spectra of CDs at 6 ppm-10 ppm. (c) Photo of the CDs and DHQP dissolved in EtOH, and the solutions were excited by a 532 nm laser. (d) The UV–vis contrast spectra of the DHQP and CDs. (e, f) EEM spectra of DHQP & CDs dissolved in ethanol. Reproduced and adapted with permission [9]. Copyright 2022, Springer Nature.


扫一扫关注我们
 DownLoad:
 下载:
下载:

 下载:
下载: