
Figure 1.
Performance of the SBR at different stages. (a) COD removal. (b) NH4+-N removal. (c) Nitrite accumulation rate (NAR). (d) TN removal.
Evaluation of the stability of shortcut nitrification-denitrification process based on online specific oxygen uptake rate monitoring
Zhouliang Tan , Yue Guan , Yajun Luo , Lin Wang , Houzhen Zhou , Chong Yang , Dan Meng , Yangwu Chen

Biological treatment is the mainstream method for nitrogen removal in wastewater treatment plants (WWTPs), and biological nitrogen removal plays a vital role in global nitrogen cycle [1]. At present, the traditional nitrogen removal process, namely complete nitrification-denitrification (CND), is the most widely adopted one in WWTPs. However, this kind of nitrogen removal process also faces some problems such as complicated operation, requirement of large area and high operation cost [2]. In contrast, for the advantages of saving 25% aeration, 40% carbon source, and shorter reaction time, shortcut nitrification and denitrification (SCND) has attracted extensive attention in recent years [3,4]. In WWTPs, microbes are the main participants for pollutants removal, and the microbial activity tends to determine the performance of the system [5]. Due to the lack of effective dynamic monitoring means, it is difficult to timely guide the optimization of microbial activity, then leads to the fluctuation of system performance. The successful operation of SCND mainly lies in the enrichment of ammonia oxidizing bacteria (AOB) and the inhibition or elimination of nitrite oxidizing bacteria (NOB). Although some strategies have been adopted to realize SCND based on the response differences of AOB and NOB to various factors, NOB is difficult to be completely suppressed without fine control means. To date, the rapid start-up and stable operation of SCND still face challenges [6]. From this point of view, dynamic monitoring is helpful to the fast start and stable operation of SCND process.
Currently, the indexes that characterize microbial activity include mixes liquor suspended solids (MLSS) [7], adenosine triphosphate (ATP) [8], electron transport system (ETS) [9], dehydrogenases (DHA) [10], etc. MLSS does not directly reflect the real-time activity of microorganisms, and the detection steps of ATP, ETS and DHA are complex and difficult to implement in practical application. In contrast, specific oxygen uptake rate (SOUR) refers to the amount of oxygen consumed by activated sludge per unit time, reflecting the physiological state and matrix metabolism of activated sludge [11], which is widely used owing to the relatively simple and fast measurement of this kind of index. In a previous study, an anaerobic-aerobic sequencing batch reactor (SBR) was used to treat saline wastewater with different COD/N ratios. When COD/N ratio was decreased from 20 to 6, the COD and NH4+-N removal rates were decreased from 87.46%, 79.74% to 64.87%, 64.55% respectively, and the SOUR increased from 34.71 to 39.24mgO2 gMLSS−1 h−1 [12].
In view of the technical limitations in the past, the SOUR detection was an offline measurement with hysteria and cannot be timely regulated. In recent years, with the continuous development and maturity of online detection technology, automated control and online detector have been successfully integrated to achieve continuous monitoring of the reaction system [13-15]. For instance, Third et al. intended to enhanced nitrogen removal with poly-hydroxybutyrate that preserved in activated sludge, and online SOUR monitoring was conducted to detect the end point of nitrification. The SOUR values were 36 mgO2 gMLSS−1 h−1 and 23 mgO2 gMLSS−1 h−1 when fed with the concentrated medium and standard feed. Accordingly, simultaneous nitrification and denitrification were 70% and 59%, respectively [16]. Long et al. documented that with the influent carbon to nitrogen (C/N) ratio increased from 15 to 29, the SOUR ratio of heterotrophic bacteria to nitrifying bacteria (include AOB and NOB) increased from 3.98 to 5.29, indicating the significant decrease of nitrifying bacteria along with the increasing C/N ratio [17]. However, it should be noted that previous studies on SOUR detection are mainly implemented in the CND process, and there are few reports on the dynamics of SOUR in SCND process. To maintain stable SCND performance, the information on how to regulate the SCND process based on SOUR curves is limited. In addition, SCND mainly relies on the AOB enrichment and NOB elimination [18,19], and whether the stability of SCND process can be judged by dynamically tracking the respiratory activity of AOB and NOB has almost hardly been discussed.
In this study, with high FA concentration, high pH, and low DO regulation, the nitrogen removal pathway is successfully changed from traditional CND to SCND in an SBR. A set of self-developed online SOUR monitoring equipment is used to monitor the variation of SOUR curves in the whole process, and parameters including SOURAOB and SOURNOB are detected. Meanwhile, the substrate (ammonia and nitrite) oxidation rate, and microbial community are investigated. The purpose of this study is to evaluate the stability of SCND process based on online SOUR measurement and provide theoretical basis for the precise control and stable operation of SCND process.
Fig. 1 shows the organic matter and nitrogen removal performance of SBR at different stages. In stage 1, the volumetric loading rate (VLR) of COD and NH4+-N were 277.2 mg L−1 d−1 and 39.6 mg L−1 d−1, and the average COD and NH4+-N removal rates were 94.0% and 99.9% (Figs. 1a and b) respectively, indicating that a stable operation of complete nitrification was achieved, which might be related to the higher DO and nitrogen removal microbes in the SBR [20]. Since the TN removal rate in this stage is less than 30%, the data are not shown. The tolerance of AOB and NOB show different response patterns to various parameters [19,21,22]. Previous studies have shown that NOB rather than AOB was inhibited at 5–10 mg/L FA [23], while both the activity and quantity of AOB were decreased by 50% when FA concentration was up to 40 mg/L [24]. Hence, in stage 2, a sudden increase of influent NH4+-N concentration to 400 mg/L (VLRN is 528 39.6 mg L−1 d−1) for about 24 h and then a decrease to 100 mg/L for another 4 days were performed to restrain the activity of NOB. With high FA inhibition (5.55–73.98 mg/L) and low DO stress (less than 0.5 mg/L), a sharp decrease of ammonia removal rate (ARR) and great fluctuation of nitrite accumulation rate (NAR) occurred, suggesting that AOB activity was also inhibited to some extent. As reported, the minimum doubling time of AOB is 7–8 h, and the minimum doubling time of NOB is 10–13 h [25]. Based on the longer proliferation time needed for NOB than that of AOB [26], about 15% of the activated sludge in SBR was discharged to further eliminate NOB at the end of stage 2. Generally, the oxygen half saturation constant for AOB and NOB are 0.2–1.5 mg/L and 1.2–1.5 mg/L, respectively. The DO concentration can be kept between 0.3–1.1 mg/L to enrich AOB and washout NOB [27]. Then, influent NH4+-N and DO concentration was restored to 30 mg/L (VLRN is 39.6 mg L−1 d−1) and less than 1 mg/L respectively in stage 3. The aeration rate was regulated in real time according to the ammonia peak obtained by a SOUR on-line monitoring equipment. After 12 days of adaptation, the average NAR was reached to 73.3%, the removal rates of NH4+-N and TN reached to 72.9%−100%, 17.9%−59.9% respectively, indicating that the process has achieved stable SCND performance.
Oxygen uptake rate (OUR) is a direct parameter to estimate the physiological state of microbes. Because DO plays an important role in microbial metabolism, OUR is very useful in estimating nutrient (carbon and nitrogen source) consumption [28]. The dynamics of SOUR in stage 1 (12 days, 13 days, 17 days) and stage 3 (46 days, 50 days, 53 days) were presented at Fig. 2. As shown in Figs. 2a-c, the substrate is sufficient and H+are continuously released in the beginning of nitrification reaction [29], causing continuous decline of pH value. Due to the continuous DO supply, the DO and SOUR values in SBR experienced a steady rise. With the progress of nitrification, the ammonia oxidation rate (AOR) was almost unchanged, and SOUR varied from 12.0 to 17.45 mgO2 gMLSS−1 h−1. The ammonia valley was obtained at the point of rapid SOUR decrease and pH values increase. As reported, when the ammonia conversion level reaches more than 90%, the pH curve is characterized by ammonia valley, while the OUR curve is characterized by a sudden drop. After the ammonia is exhausted, the OUR value is kept at a constant value, which can be used to determine the end of nitrification [30]. Ammonium depletion is a conservative signal, independent of aeration conditions and wastewater type. At this time, aeration should be stopped immediately to avoid the destroy of nitrite accumulation [16].

Figs. 2d-f show the variation pattern of SOUR curve in the SCND process (Stage 3). The initial SOUR values were zero because of the low DO concentration applied in this stage. The obvious drop of pH values indicated that NH4+-N was continuously consumed (Figs. 2d and e), and then buffer solution was added to keep enough alkalinity in the reactor. Usually, pH ranging from 7.5 to 8.5 benefits for nitrite accumulation [27]. On the 53th day, the low pH in the reactor showed adverse effects on nitrification-denitrification, thus NaOH (0.1 mol/L) was added to adjust the pH values. It found that the SOUR values suddenly increased when NH4+-N was completely removed, leading to the oxygen and alkalinity consumption reduction in SBR. According to this rapidly rising value, lowering the DO concentration in SBR was adopted to avoid excessive aeration, thus forming a peak due to the decline of SOUR value. Hence, NH4+-N removal can be characterized by a breakthrough point of SOUR with a dynamic monitoring equipment in the SCND process. Obviously, regulating the aeration rate based on the breakthrough point of SOUR helps to maintain stable SCND performance.
Microbial activity is used to express the ability of biomass to metabolize specific substrates, thus describing the biocatalytic potential of biomass [31]. For the tricarboxylic acid cycle (TCA) and oxidative phosphorylation pathway (OXPHOS), OUR determines the oxidative capacity of cells. In other words, it represents the ability to generate energy, cells, and products in TCA [28]. Lowering DO concentration favors the SCND performance, but it may also reduce nitrogen removal rates, decrease COD removal efficiencies, and even lead to sludge bulking [6]. As can be seen from Fig. 2, the SOUR values in stage 3 are lower than that in stage 1, which may be attributed to the restrictive effect of low DO operating condition [32]. Similarly, a previous study also reported that the SOUR observed in the aerobic phase was much higher than that in the anoxic phase [33]. The positions of ammonia peaks or valleys show dynamic changes with the variation of operating parameters. As shown in Fig. 2f, the time point of ammonia peak appears later than that in Fig. 2e, it may be that low pH values display a certain inhibitory effect on AOB activity. Certainly, the acquisition of these information can provide a timely reference for the optimization and control of nitrogen removal pathway.
SOUR cannot only characterize metabolic activity of activated sludge from the perspective of microbial respiration rate, but also reflect the relationship among nitrifying bacteria [34]. During the entire experiment process, the ratio of SOURAOB/SOURNOB was increased from 1.40 (day 11) to 2.94 (day 44) and 2.93 (day 48) respectively (Fig. 3a), suggesting the enrichment of AOB and elimination of NOB [35]. Moreover, based on the results of SOURNOB values, the complete elimination of NOB in SCND process was not achieved. It is of practical value to dynamically regulate and control the SCND process according to the dynamics of SOURAOB/SOURNOB ratio.
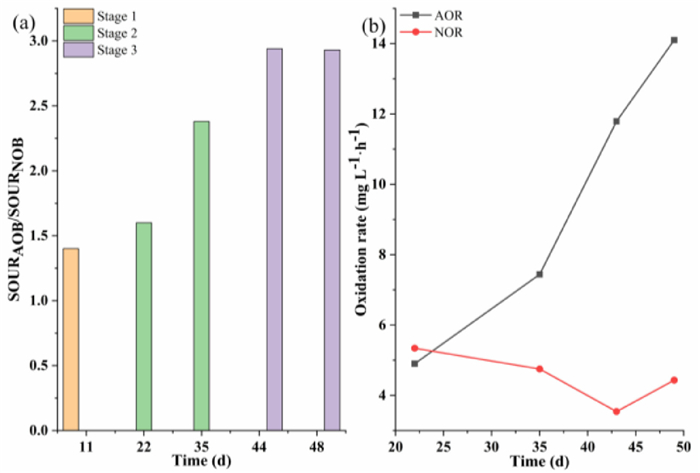
Meanwhile, the AOR and nitrite oxidation rate (NOR) of the activated sludge in SBR were investigated through shake flask experiments. As shown in Fig. 3b, the AOR displayed an obvious upward trend, which was increased from 4.9 mg L−1 h−1 (day 22) to 14.1 mg L−1 h−1 (day 48). In contrast, a slightly decrease of NOR was observed. From CND to SCND process, the ratio of AOR/NOR was increased from 0.92 to 3.18, also indicating an enrichment of AOB [36]. At low DO concentration, the limited availability of adenosine triphosphate (ATP) prevents significant biomass growth [37], especially for such microbes with higher oxygen half saturation constant, such as NOB.
Pearson correlation analysis was carried out to explore the relationships between SOURAOB/SOURNOB (SA/SN) and AOR, NOR, ARR, NAR (Fig. S2 in Supporting information). Results showed that SOURAOB/SOURNOB significantly correlated with ARR, NAR and AOR/NOR. Thus, the ratio of SOURAOB/SOURNOB can effectively indicate the NH4+-N removal performance and NAR in the SCND process. It can be roughly judged whether the SCND process operates stably based on the ratio of SOURAOB/SOURNOB.
During the whole operation process, the dynamics of microbial community at genus level is presented in Fig. 4a. Obviously, Saccharimonadales (norank) and unclassified_o_Saccharimonadales are found to be the dominant genus in the SBR. There are few reports related to Saccharimonadales, while it has a synergistic effect with the gene amoA, which encodes ammonia monooxygenase [38]. Besides, Rhodobacter is also detected in the reactor, a genus of denitrifying bacteria belonging to Proteobacteria [39]. The relative abundance of Rhodobacter increased by 17.7 times in SCND process (Stage 3) compared with CND process (Stage 1), indicating that Rhodobacter may exert great influence on denitrification performance.

As shown in Fig. 4b, Nitrosomonas and Ellin6067 that belong to AOB [40,41] were detected in SBR. Specifically, the relative abundance of Nitrosomonas showed a gradual downward trend from CND to SCND process, while Ellin6067 decreased first and then increased in the SCND process. Previous study documented that slow-growing organisms Ellin6067 can be selective enriched in anaerobic-aerobic-anoxic SBR [42]. Meanwhile, NOB including Nitrotoga [43] and Nitrospira [44] were also detected. There was no Nitrotoga existed in CND process, but it enriched in SCND process. Different from Nitrotoga, Nitrospira displayed a gradual decrease during the whole operational period. As a result, the relative abundance ratio of AOB/NOB was increased from 1.03 to 3.12, which demonstrated the predominance of AOB to NOB [20] in the SCND process. Then, the relationship between SOURAOB/SOURNOB and relative abundance of AOB/NOB was conducted. A significant positive correlation (P < 0.05) was observed, suggesting that SOURAOB/SOURNOB can effectively characterize the proportion of AOB to NOB, thus reflect the stability of SCND process.
Nitrospira is generally reported to be the K-strategists (with high substrate affinities and low maximum activity) for nitrite and oxygen [27] and may be able to survive at low DO conditions. The possible reason for the decrease of Nitrospira in SCND process may be due to the higher affinity of AOB over NOB to DO. Nitrotoga are nitrite-dependent autotrophic carbon fixation NOB, which found to be coexisted with AOB in WWTPs [45]. Because of their low affinity for DO, Nitrotoga are less competitive than Nitrospira at DO deficiency conditions. Based on the changes of relative abundance of Nitrotoga and Nitrospira, the DO level in stage should be further reduced to inhibit the proliferation of Nitrotoga. Moreover, Nitrotoga shows relatively higher resistance than other NOB to free Nitrous Acid (FNA) and FA stresses, which may facilitate their proliferation [46]. To avoid large enrichment of NOB in the SCND process, it is extremely important to track the ratio of AOB/NOB in time. As an effective alternative to accurately track the proportion of AOB/NOB, it is necessary and applicable to dynamically monitor SOURAOB/SOURNOB, which provides a theoretical basis for the regulation and stable maintenance of SCND performance.
As is known, SOUR can not only accurately reflect the pollutants removal performance [35], but also effectively indicate the metabolic activity of nitrifying microbes [11], which provides a powerful means for monitoring the status of WWTPs dynamically. According to the dynamics of SOUR, SOURAOB and SOURNOB, we propose a strategy to quickly determine the stability of SCND process. That is, when NH4+-N removal is complete, SOUR values would suddenly jump to form a wave peak; and meanwhile the SOURAOB/SOURNOB ratio is constantly greater than 2.93, which means that the process is in stable operation.
The purpose of judging the stability of SCND process based on the SOUR variation rule is mainly to provide guidance for the subsequent optimal regulation. On the one hand, the DO probe in the SOUR online detection equipment needs to be timely calibrated and replaced to ensure the accurate acquisition of online data. On the other hand, the application of machine learning algorithm is necessary to achieve the precise control of WWTPs [47]. Importantly, microbial activity data should be considered during the machine learning model construction. However, there are few reports on relevant research at present, which may restrict the large-scale application of SOUR equipment and SCND process in wastewater treatment.
In this study, regulation strategy integrating high FA, high pH and low DO is demonstrated to be practicable for the rapid start-up of SCND process. The ammonia peak point can be determined according to the dynamics of online SOUR to avoid the damage of SCND by excessive aeration. High correlations between SOURAOB/SOURNOB ratio and substrate oxidation activity, AOB/NOB proportion indicating that SOURAOB/SOURNOB ratio can dynamically characterize the nitrifying microbes' activity and composition in the SCND process. Adjusting the aeration rate timely according to the breakthrough point of SOUR and making the SOURAOB/SOURNOB ratio constant greater than 2.93 can ensure stable SCND performance. It is a fast and accurate method to evaluate the stability of SCND process based on the online SOUR monitoring.
The authors declare that they have no known competing financial interests or personal relationships that could have appeared to influence the work reported in this paper.
This research was supported by Sichuan Key Point Research and Invention Program (Nos. 2019YFS0502, 2020YFS0026), Instrument Developing Project of the Chinese Academy of Sciences (No. YJKYYQ20180002), Project funded by China Postdoctoral Science Foundation (No. 2020M673293).
Supplementary material associated with this article can be found, in the online version, at doi:
H. Hauduc, L. Rieger, A. Oehmen, et al., Biotechnol. Bioeng. 110 (2013) 24–46. doi: 10.1002/bit.24624
Y.X. Li, J.Y. Ling, P.C. Chen, et al., Front. Environ. Sci. Eng. 15 (2021) 1–10. doi: 10.1007/s11783-020-1293-2
Y.Z. Peng, G.B. Zhu, Appl. Microbiol. Biotechnol. 73 (2006) 15–26. doi: 10.1007/s00253-006-0534-z
T. Liu, Y.J. Mao, Y.P. Shi, X. Quan, Appl. Microbiol. Biotechnol. 101 (2017) 2563–2574. doi: 10.1007/s00253-016-8003-9
M. Fernandez-Gatell, C. Corbella, X. Sanchez-Vila, J. Puigagut, Chemosphere 287 (2022) 132383. doi: 10.1016/j.chemosphere.2021.132383
Z. Wang, B. Wang, X. Gong, X. Qiao, Y. Peng, Bioresour. Technol. 285 (2019) 121358. doi: 10.1016/j.biortech.2019.121358
Z. Wang, B. Wang, X. Gong, et al., Bioresour. Technol. 285 (2019) 121358. doi: 10.1016/j.biortech.2019.121358
M.W. Yim, N.F.Y. Tam, Mar. Pollut. Bull. 39 (1999) 179–186. doi: 10.1016/S0025-326X(99)00067-3
Q. Wang, L. Ye, G. Jiang, et al., Environ. Sci. Technol. 47 (2013) 11897–11904. doi: 10.1021/es402933b
X.F. Hu, Y. Jiang, Y. Shu, et al., J. Geochem. Explor. 147 (2014) 139–150. doi: 10.1016/j.gexplo.2014.08.001
K.J. Sears, J.E. Alleman, W.L. Gong, J. Biotechnol. 119 (2005) 389–399. doi: 10.1016/j.jbiotec.2005.04.025
S. Wang, M. Gao, Z. Wang, et al., Environ. Eng. Manag. J. 17 (2018) 1161–1168. doi: 10.30638/eemj.2018.115
V. Pambrun, E. Paul, M. Sperandio, Chem. Eng. Process. 47 (2008) 323–329. doi: 10.1016/j.cep.2007.01.028
F. Pajoum-Shariati, M.H. Sarrafzadeh, M.R. Mehrnia, et al., Environ. Technol. 35 (2014) 425–431. doi: 10.1080/09593330.2013.831459
Y. Xiao, C. De Araujo, C.C. Sze, D.C. Stuckey, J. Hazard. Mater. 286 (2015) 15–29. doi: 10.1016/j.jhazmat.2014.12.033
K.A. Third, S. Sepramaniam, Z. Tonkovic, M. Newland, R. Cord-Ruwisch, Water. Sci. Technol. 50 (2004) 171–180.
B. Long, C.Z. Yang, W.H. Pu, et al., J. Water. Health. 13 (2015) 746–757. doi: 10.2166/wh.2015.247
Y.Y. Yang, Z.G. Chen, X.J. Wang, L. Zheng, X.Y. Gu, Bioresour. Technol. 241 (2017) 473–481. doi: 10.1016/j.biortech.2017.05.151
X.W. Huang, P.H. Lee, Chem. Eng. J. 404 (2021) 126511. doi: 10.1016/j.cej.2020.126511
S.L. Lu, Q.Z. Wang, M.C. Gao, et al., Bioresour. Technol. 333 (2021) 125198. doi: 10.1016/j.biortech.2021.125198
A.C. Anthonisen, R.C. Loehr, T.B.S. Prakasam, E.G. Srinath, J. Water. Pollut. Con. F. 48 (1976) 835–852. doi: 10.2307/25038971
D. Wei, X.D. Xue, L.G. Yan, et al., Chem. Eng. J. 235 (2014) 19–26. doi: 10.1016/j.cej.2013.09.005
J. Chung, H. Shim, S.J. Park, S.J. Kim, W. Bae, Bioprocess. Biosyst. Eng. 28 (2006) 275–282. doi: 10.1007/s00449-005-0035-y
Q. Yao, D. Peng, B. Wang, et al., J. Biosci. Bioeng. 124 (2017) 319–326. doi: 10.1016/j.jbiosc.2017.03.015
G.B. Zhu, Y.Z. Peng, J.H. Guo, et al., Rev. Environ. Contam. Toxicol. 192 (2008) 159–195. doi: 10.1007/978-0-387-71724-1_5
X.D. Gu, Y. Huang, Y.T. Hu, J.Q. Gao, M. Zhang, Bioresour. Technol. 342 (2021) 125935. doi: 10.1016/j.biortech.2021.125935
S. Ge, S. Wang, X. Yang, et al., Chemosphere 140 (2015) 85–98. doi: 10.1016/j.chemosphere.2015.02.004
I.M. Monge, R. Roman, P. Comas, et al., Appl. Microbiol. Biotechnol. 103 (2019) 6903–6917. doi: 10.1007/s00253-019-09989-4
J.Y. Shamas, A.J. Englande, Water. Sci. Technol. 25 (1992) 123–132. doi: 10.2166/wst.1992.0019
S. Puig, L. Corominas, A. Traore, et al., Water. Sci. Technol. 53 (2006) 171–178. doi: 10.2166/wst.2006.121
P. Gikas, A. Livingston, Enzyme. Microb. Tech. 22 (1998) 500–510. doi: 10.1016/S0141-0229(97)00242-1
Y.Y. Wang, Z.X. Zhang, M. Yan, et al., J. Environ. Sci. Heal. A 45 (2010) 370–376. doi: 10.1080/10934520903467964
A. Khursheed, Sharma M. K, Tyagi V. K, Chem. Eng. J. 281 (2015) 613–622. doi: 10.1016/j.cej.2015.06.105
H. Wang, G.J. Xu, Z. Qiu, Y. Zhou, Y. Liu, Chemosphere 216 (2019) 633–639. doi: 10.1016/j.chemosphere.2018.10.187
H. Dong, K.Y. Zhang, X. Han, et al., Chemosphere 183 (2017) 212–218. doi: 10.1016/j.chemosphere.2017.05.119
Y.J. Shi, L. Yang, S.F. Liao, et al., J. Hazard. Mater. 414 (2021) 125527. doi: 10.1016/j.jhazmat.2021.125527
K.A. Third, M. Newland, R.C. Ruwisch, Biotechnol. Bioeng. 82 (2003) 238–250. doi: 10.1002/bit.10564
L.L. Shi, P. Zhang, Y.H. He, et al., Sci. Total. Environ. 771 (2021) 144831. doi: 10.1016/j.scitotenv.2020.144831
T.R. Thomsen, Y. Kong, P.H. Nielsen, Fems. Microbiol. Ecol. 60 (2007) 370–382. doi: 10.1111/j.1574-6941.2007.00309.x
L.F. Wang, S. Qiu, J.H. Guo, S.J. Ge, Environ. Sci. Technol. 55 (2021) 13297–13305.
Y. Chen, Y. Zhang, L. Zhang, S.J. Zhang, Y.Z. Peng, Chemosphere 287 (2022) 132053. doi: 10.1016/j.chemosphere.2021.132053
D. Liang, W. Guo, D. Li, et al., Environ. Res. 205 (2022) 112547. doi: 10.1016/j.envres.2021.112547
E. Spieck, S. Wegen, S. Keuter, Appl. Microbiol. Biotechnol. 105 (2021) 7123–7139. doi: 10.1007/s00253-021-11487-5
Z.Q. Wang, J.F. Gao, D. Zhang, et al., Bioresour. Technol. 342 (2021) 125999. doi: 10.1016/j.biortech.2021.125999
S. Lücker, J. Schwarz, C. Gruber-Dorninger, et al., ISME J. 9 (2015) 708–720. doi: 10.1038/ismej.2014.158
M. Zheng, S.Q. Li, G.F. Ni, et al., Environ. Sci. Technol. 54 (2020) 15414–15423. doi: 10.1021/acs.est.0c04192
S. Zhong, K. Zhang, M. Bagheri, J.G. Burken, H. Zhang, Environ. Sci. Technol. 55 (2021) 12741–12754. doi: 10.1021/acs.est.1c01339

Figure 1 Performance of the SBR at different stages. (a) COD removal. (b) NH4+-N removal. (c) Nitrite accumulation rate (NAR). (d) TN removal.

Figure 2 The variation curves of SOUR and pH in different stages. (a-c) SOUR and pH values in stage 1 on days 12, 13 and 17. (d-f) SOUR and pH values in stage 3 on days 46, 50 and 53.

Figure 3 Variation of SOURAOB/SOURNOB and substrates (ammonia and nitrite) oxidation rate of activated sludge at different stages. (a) SOURAOB, SOURNOB were measured using the SOUR online-monitoring device. (b) Ammonia oxidation rate and nitrite oxidation rate were measured with shaking flask experiment.

Figure 4 Dynamics of microbial community of SBR at different stages. (a) The relative abundance of microbial community at genus level. (b) The relative abundance of nitrifying bacteria (AOB and NOB) and ratio of AOB (Nitrosomonas and Ellin6067) /NOB (Nitrotoga and Nitrospira) at genus level.

 扫一扫看文章

扫一扫关注我们
 DownLoad:
 下载:
下载:
 下载:
下载: