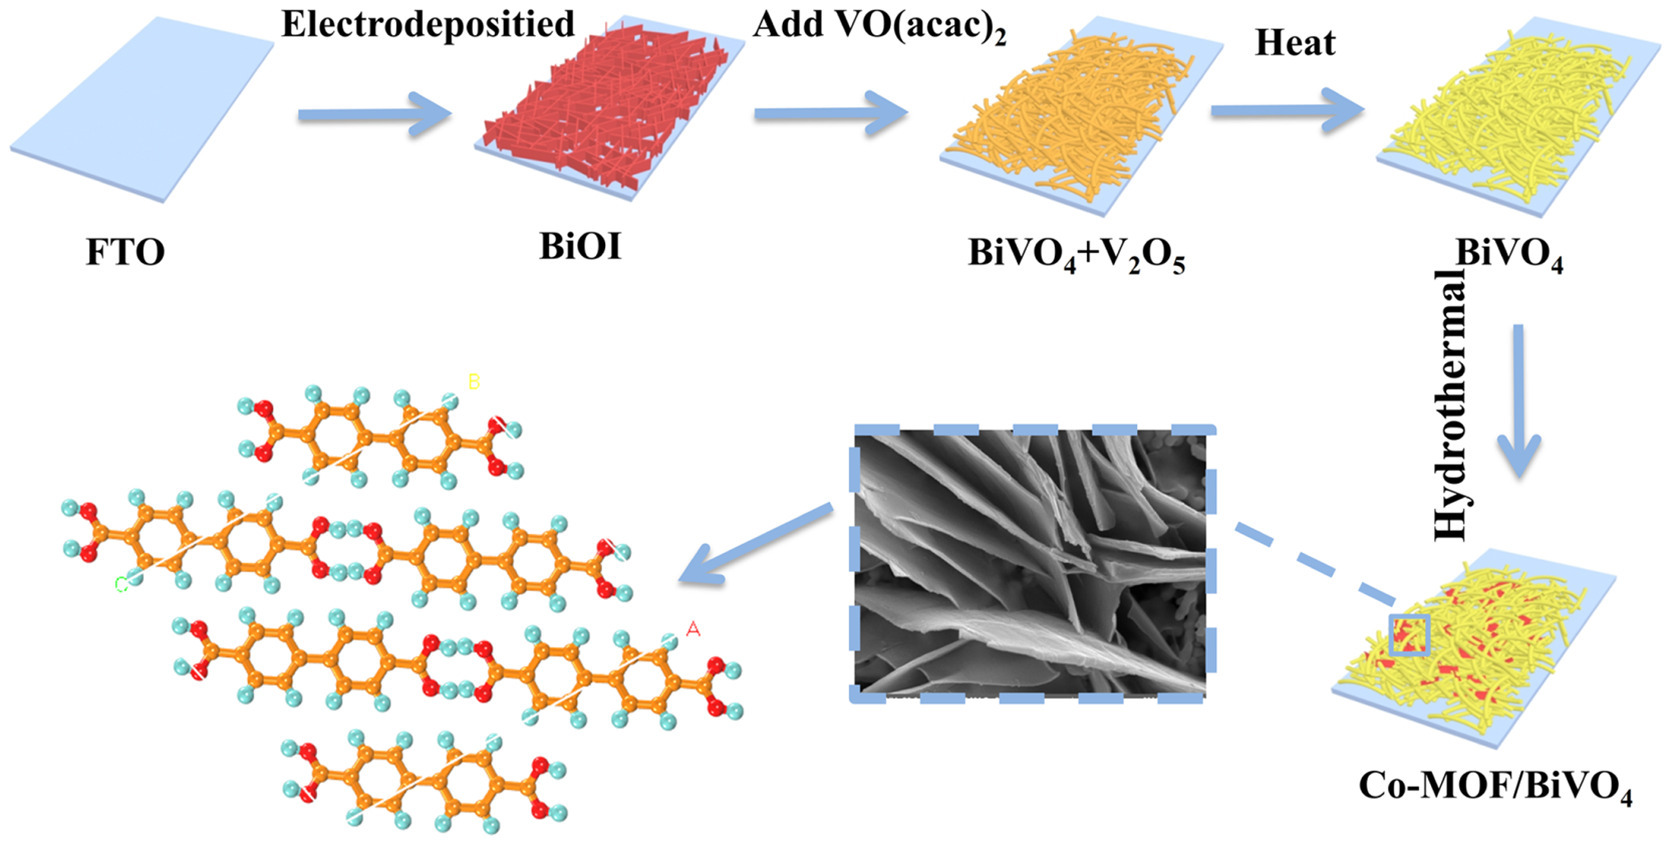
Scheme 1.
Synthesis schematic diagram of pure BiVO4, Co-MOF/BiVO4 electrodes.
Boosting charge separation of BiVO4 photoanode modified with 2D metal-organic frameworks nanosheets for high-performance photoelectrochemical water splitting
Lina Wang , Zejun Liu , Jinming Zhang , Yuefa Jia , Jingwei Huang , Qiong Mei , Qizhao Wang

The development of clean renewable energy and cost-effective large-scale energy storage conversion system has become one of the research hotspots [1-5]. Solar energy itself can be directly converted into chemical energy with photoelectrochemical (PEC), such as water splitting to form hydrogen (H2), making it one of the most ideal and environmentally friendly energy production routes in the future [6,7]. So far, there are many semiconductor materials as photocatalysts for water oxidation, for instance, WO3 [8,9], BiVO4 [10], Fe2O3 [11], SrTiO3 [12], among which BiVO4 has attracted much attention because of its unique advantages. BiVO4 has a suitable band gap of 2.4 eV and is an n-type photocatalytic material, which can absorb a large amount of visible light with a favorable band edge position [13-15]. Nevertheless, severe charge recombination in the bulk BiVO4 films usually results in a relatively low charge separation and transfer efficiency. To tackle the aforementioned drawbacks, an effective strategy based on surface modification have been developed to retard back electron/hole recombination for improved photocurrent densities [16,17]. For example, the inhibition of carriers' recombination of BiVO4 by the surface passivation effect of ferrihydrite results in an increased PEC activity of BiVO4 [18]. Li et al. demonstrated that ZIF-8 overlayer acts as surface passivation layer, which improves the hole utilization of ZnO [19]. However, the synthesis methods of most surface passivation materials are complicated, the production time is long, and a vacuum atmosphere is required. Therefore, a simple synthesis route is desired for preparing the surface passivation photoanodes.
Metal-organic frameworks (MOFs), as a novel family of 2D materials, are considered to be an important candidate in the field of PEC water oxidation due to their high carrier mobility, simple preparation, low cost and easy low-temperature film formation [20]. MOF has been proven to be an effective modified layer for ZnO [19,21], BiVO4 [22,23], and Fe2O3 [24-26] photoanodes. However, as far as we know, MOFs have not been adequately studied as passivation layers for PEC water oxidation.
Herein, the 2D Co-MOF nanosheets (Co(bpdc)(H2O)4 (bpdc = biphenyl-4, 4′-dicarboxylic acid), Co-MOF) were decorated on the surface of BiVO4 photoanode via a hydrothermal method. Meanwhile, with the introduction of Co-MOF, an active PEC water splitting reaction site is realized and the PEC water-splitting activity of BiVO4 is further enhanced, which reveals that the photocurrent density can reach 6.0 mA/cm2 at 1.23 V vs. RHE. At last, the excellent PEC performance of Co-MOF/BiVO4 film is attributed to the introduction Co-MOF nanosheets passivation layer, which improves the charge separation efficiency in the pure BiVO4 film.
The synthesis of Co-MOF/BiVO4 consists of the following three steps: firstly, BiVO4 films were synthesized by the previously reported method (Support information) [27]. Co-MOF/BiVO4 electrode is synthesized by in situ loading Co-MOF nanosheets on BiVO4 using a hydrothermal method [28]. In order to prepare Co-MOF layer, the 30 mL mixed solution contained 26 mL DMF, 2 mL water and 2 mL ethanol was prepared. Subsequently, 0.05 mmol CoCl2·6H2O and 0.05 mmol biphenyl-4, 4′-dicarboxylic acid (bpdc) were added to the above solution under stirring. Then the above solution was transferred to a stainless steel autoclave and reacted for 8 h at 120℃. A scaffold was placed in the autoclave to allow the BiVO4 electrode to stand upright in the autoclave. The dark pink precipitate was washed three times with distilled water and ethanol and dried overnight at 60℃. The steps of the fabrication of a Co-MOF/BiVO4 are schematically presented in Scheme 1.
Fig. 1 provides images of the synthesized photoanodes taken with a scanning electron microscope (SEM). The pristine BiOI are comprised of uniformly deposited nanosheets that are 30–40 nm thick (Fig. 1a). According to Figs. 1b and c, the original BiVO4 film has a thickness of about 2 µm and consist of small connecting ellipsoid particles. As shown in Fig. 1d, the Co-MOF nanosheets were vertically distributed throughout the whole BiVO4 substrate, revealing that the Co-MOF nanosheets have been successfully introduced. In general, the resulting 2D Co-MOF nanosheets are associated with more active metal sites, which promotes more contact between the sample and oxygen, resulting in better PEC activity [29]. The corresponding analysis of the mapping image shows an even distribution of the elements Co, Bi, V and O elements in the Co-MOF/BiVO4 sample (Figs. 1e–h). The microstructure of Co-MOF/BiVO4 photoanode was revealed by the TEM. The image in Fig. 1i clearly shown that Co-MOF nanosheets are in close contact with BiVO4. As presented in Fig. 1j, an interplanar spacing of 0.30 nm was identified, consistent with (121) lattice plane of BiVO4. The interlayer lattice spacing of Co-MOF is observed to be 0.24 nm in Fig. 1j, which is consistent with previous reports [30].

The crystal structure patterns of BiVO4 and Co-MOF/BiVO4 photoanode are shown in Fig. 2a. In the case of BiVO4 film, all peaks were indexed to the monoclinic scheelite BiVO4 (JCPDS No. 14-0688) [31]. The diffraction peaks at 26.6°, 37.9°, 51.7°, 65.9° corresponded to tetragonal phase SnO2 (JCPDS No. 46-1088) [32]. The XRD peaks of Co-MOF/BiVO4 electrode are similar to that of BiVO4 film. However, no diffraction peaks assigned to Co-MOF can be observed, due to the small quantity of Co-MOF on the BiVO4 surface. The structural components of the as-prepared BiVO4, Co-MOF/BiVO4 and MOF powder were further analyze via Fourier transform infrared spectroscopy (FT-IR). This peak is the result of the stretching vibration of C=O which is mostly caused by the presence of C=O functional groups within the bpdc bond in Fig. 2b. The antisymmetric stretching vibration peak of the carboxyl group in the ligand appeared at 1589 cm−1 and the peak of the symmetrical stretching vibration occurred at 1367 cm−1 [33]. The absorption peak with a wavelength of 1180 cm−1 can be caused by the expansion and contraction vibration of C-H [34]. Furthermore, the bending vibration of C=C−H bond of benzene ring was observed at 796 cm−1. Compared with pure MOF powder and BiVO4, the FT-IR of Co-MOF/BiVO4 not only showed the characteristic vibration peak of MOF ligand, but also the absorption peak of BiVO4, which proved the successful modification of Co-MOF nanosheets.

Valence and surface chemical elements of BiVO4 and Co-MOF/BiVO4 electrode were detected by XPS. The measured spectra in Fig. S1 (Supporting information) indicated that the Bi, V, O and a small amount of Co elements are present in Co-MOF/BiVO4 sample. In Fig. 2c, the peak at 781.3 eV is associated with Co 2p3/2 and 797.3 eV with Co 2p1/2, respectively [35]. Besides, the peaks of 786.4 and 802.8 eV are the signals of Co satellite peaks. In Fig. 2d, both the 159.2 and 164.5 eV peaks were observed to be associated with Bi 4f7/2 and Bi 4f5/2, respectively, which were identified as Bi3+ in Co-MOF/BiVO4. Accordingly, the binding peaks were at 516.8 eV and 524.4 eV for V 2p3/2 and V 2p1/2, respectively. (Fig. 2e). In O 1s mode from Fig. 2f, the peaks of 531.7 and 532.4 eV correspond to lattice oxygen and hydroxyl groups [36]. In conclusion, the XPS results indicated that the Co-MOF nanosheet were deposited on the BiVO4 anode through in situ hydrothermal way.
As-fabricated anodes are shown in Fig. S2 (Supporting information) as diffuse reflectance spectra (UV-vis DRS). The BiVO4 film has shown extended light absorption up to 500 nm, which is attributable to inherent bandgap energy of BiVO4. After introduction of Co-MOF nanosheets on BiVO4 surface, the light absorption band edge of Co-MOF/BiVO4 anode exhibited a slight red shift compared to pure BiVO4. The band gap of BiVO4 electrode and Co-MOF/BiVO4 samples were evaluated from their UV-vis DRS using the Kubelka-Munk formula in Fig. S3 (Supporting information). It is obvious that the band gap value of Co-MOF/BiVO4 sample (2.38 eV) is narrower than that of BiVO4 (2.43 eV), implying that Co-MOF nanosheets can slightly affect the band gap value of BiVO4.
To fundamentally explain the excellent PEC water performance of Co-MOF/BiVO4 sample, linear sweep voltammograms (LSV) were carried out. In order to exclude the effect of FTO on the PEC properties of other samples, the LSV test of FTO was carried out under the same conditions. As shown in the Fig. S4 (Supporting information), the photocurrent density of the FTO is almost zero, indicating that the FTO acts as a support material in the composite. To determine the optimal thickness of 2D Co-MOF nanosheets, the different concentrations of CoCl2·6H2O and bpdc (0.2, 0.1, 0.05 and 0.025 mmol) have been investigated. As displayed in Fig. S5 (Supporting information), the optimal loading of Co-MOF nanosheets is 0.05 mmol. As shown in Fig. 3a, the photocurrent density of BiVO4 (1.5 mA/cm2) at 1.23 V vs. RHE is low. However, the highest photocurrent density of 6.0 mA/cm2 at 1.23 V vs. RHE is obtained for Co-MOF/BiVO4 sample, obviously higher than pure BiVO4, as a result of the improvement of charge carries transfer. It is reported that the higher the negative overpotential, the higher the PEC water oxidation capacity [37]. Co-MOF/BiVO4 photoanode delivered a higher current density at the same potential and obtained a water splitting initial potential of ca. 0.18 V vs. RHE, negatively shifted relative to BiVO4, indicating suppression of back carries recombination and improved carries migration kinetics [17]. This observation is consistent with that reported for Al2O3-passivated hematite photoanodes [37]. Interestingly, Co-MOF/BiVO4 is superior to the other samples as far as we concerned (Table S1 in Supporting information). Fig. 3b compares the LSV measurements of Co-MOF/BiVO4 photoanode and BiVO4 film without illumination. Notably, after introducing Co-MOF nanosheets, the LSV curve of Co-MOF/BiVO4 moved significantly to the negative potential direction, indicating that reduction of the reaction energy barriers is to be achieved. Besides, the chopped light irradiation of all photoanodes were determined at 0.6 V vs. Ag/AgCl. The photocurrent value of Co-MOF/BiVO4 is higher than that of BiVO4 in Fig. 3c, which means that the transmission of photogenerated electrons in Co-MOF/BiVO4 is more unimpeded. To investigate the interfacial charge separation behavior of all electrodes, a study of electrochemical impedance spectroscopy was performed, as illustrated in Fig. 3d. It is easy to distinguish two different semicircles at low frequencies and high frequencies. The latter is a characteristic of the event impedance in the bulk of the film, while the former is a characteristic of the impedance generated by the surface process [38,39]. Obviously, the semicircle of Co-MOF/BiVO4 at low frequencies is much smaller than that of BiVO4, indicating that Co-MOF nanosheets passivate the surface state of BiVO4 then reduce electron-hole recombination in the surface state.

At 1.23 V vs. RHE, the PEC H2 evolution activity on BiVO4 alone and Co-MOF/BiVO4 composite were evaluated under xenon arc lamp illumination (Figs. 3e and f). Using bare BiVO4, development of H2 and O2 was very low, with 12 µmol h−1 cm−2 and 6 µmol h−1 cm−2, respectively, due to rapid electron and hole recombination (Fig. 3e). When a small amount of Co-MOF nanosheets is modified on the BiVO4 surface in Fig. 3f, it shows a very high PEC H2 and O2 evolution activity of 233 µmol/cm2 and 115 µmol/cm2 and passed charge during the decomposition of water (Fig. S6 in Supporting information), which fully illustrates that the use of Co-MOF nanosheets to modify BiVO4 is a very effective mean to improve the BiVO4 PEC hydrogen production activity. The ratio of evolved O2 and H2 is equivalent to stoichiometric ratio of 1:2. Moreover, H2 and O2 have a Faraday efficiency greater than 90%. The Co-MOF/BiVO4 electrode shows good reproducibility in Fig. S7 (Supporting information) with a photocurrent density of 4.8 mA/cm2 at 1.23 V vs. RHE after PEC water oxidation reaction. It is worth noting that the Co-MOF/BiVO4 photoanode exhibited excellent photocurrent and structural stability throughout the PEC water oxidation reaction test (Figs. S8–S10 in Supporting information), indicating that the introduction of the Co-MOF layer not only significantly increased the photocurrent density but also effectively contributed to the PEC stability of the BiVO4 photoanode. The XRD pattern of the Co-MOF/BiVO4 film shows a high match with fresh XRD and no other diffraction peaks appears, demonstrating the good stability of the Co-MOF/BiVO4 photoanode (Fig. S11 in Supporting information).
The incident photon-to-current efficiency (IPCE) is also performed to measure the Co-MOF/BiVO4 and BiVO4 photoanodes PEC performance. From Fig. 4a, the Co-MOF/BiVO4 anode achieved the highest IPCE value in the entire spectrum. Especially at 440 nm, the IPCE value was significantly increased to 93%, which is 6.2 times that of BiVO4 (15% at 430 nm). According to Fig. 4b, the BiVO4 photoanode has a low applied bias photon to current efficiency (ABPE) value. After modification of the BiVO4 photoelectrode with the Co-MOF nanosheets, the ABPE is estimated as 2.12% at 0.64 V vs. RHE, corresponding to an eight-fold boost over for BiVO4 (0.26% at 0.92 V vs. RHE). In order to reveal the mechanism of action by quantitative analysis, the charge injection efficiency (ηsurface) of the synthetic film is provided in Fig. S12 (Supporting information). Less than 32% of the charge injection efficiency occurs at the bare BiVO4 anode in the overall potential window over the entire potential range, implying that the pores generated by photons to participate in the oxidation reaction of water partially recombine with electrons instead of reaching the surface of the photoanode. However, the charge injection efficiency of Co-MOF/BiVO4 photoelectrode showed significant improvement over the entire potential window, with the maximum value reaching up to 77.0% max at 1.23 V vs. RHE, indicating the addition of Co-MOF nanosheets greatly inhibited electron-hole recombination in BiVO4. To further explore PEC behavior, the separation efficiency of the charges (ηbulk) was also studied in Fig. 4c. The charge separation efficiency of the Co-MOF/BiVO4 photoanode was 96%, which was approximately about 1.62 times that of the BiVO4 photoanode (59%), indicating that the electron-hole recombination was more severe in the original BiVO4, while the Co-MOF mainly reduced the occurrence of this phenomenon. This result further demonstrated that the introduction of passivation layer of Co-MOF nanosheet can achieve efficient charge separation. To further investigate the recombination characteristics of photogenerated carriers, we tested the photoluminescence spectrum (PL) of the sample in Fig. S13 (Supporting information). The emission peak position of the Co-MOF/BiVO4 anode is consistent with that of BiVO4 (508 nm, Fig. S14 in Supporting information), but the emission peak intensity is reduced. Therefore, the introduction of Co-MOF nanosheets improves the photogenerated charges separation rate of BiVO4 and further promotes the improvement of PEC water decomposition performance of BiVO4 anode. To get a sense the critical role of charge separation efficiency in the ultimate PEC performance, time-resolved PL (TRPL) attenuation measurements of BVO4 and Co-MOF/BiVO4 sample were performed. Significantly, the decreased fast carrier lifetime (τ1) of Co-MOF/BiVO4 implied a more effective surface charge transfer compared with that of pure BiVO4 (inset Fig. 4d), which is consistent with previous reports [37,40]. Besides, the free exciton lifetime (τ2) in Co-MOF/BiVO4 anode is increased relative to BiVO4, indicating that the introduction of Co-MOF nanosheets can effectively promote the interfacial photogenerated carries separation of BiVO4.
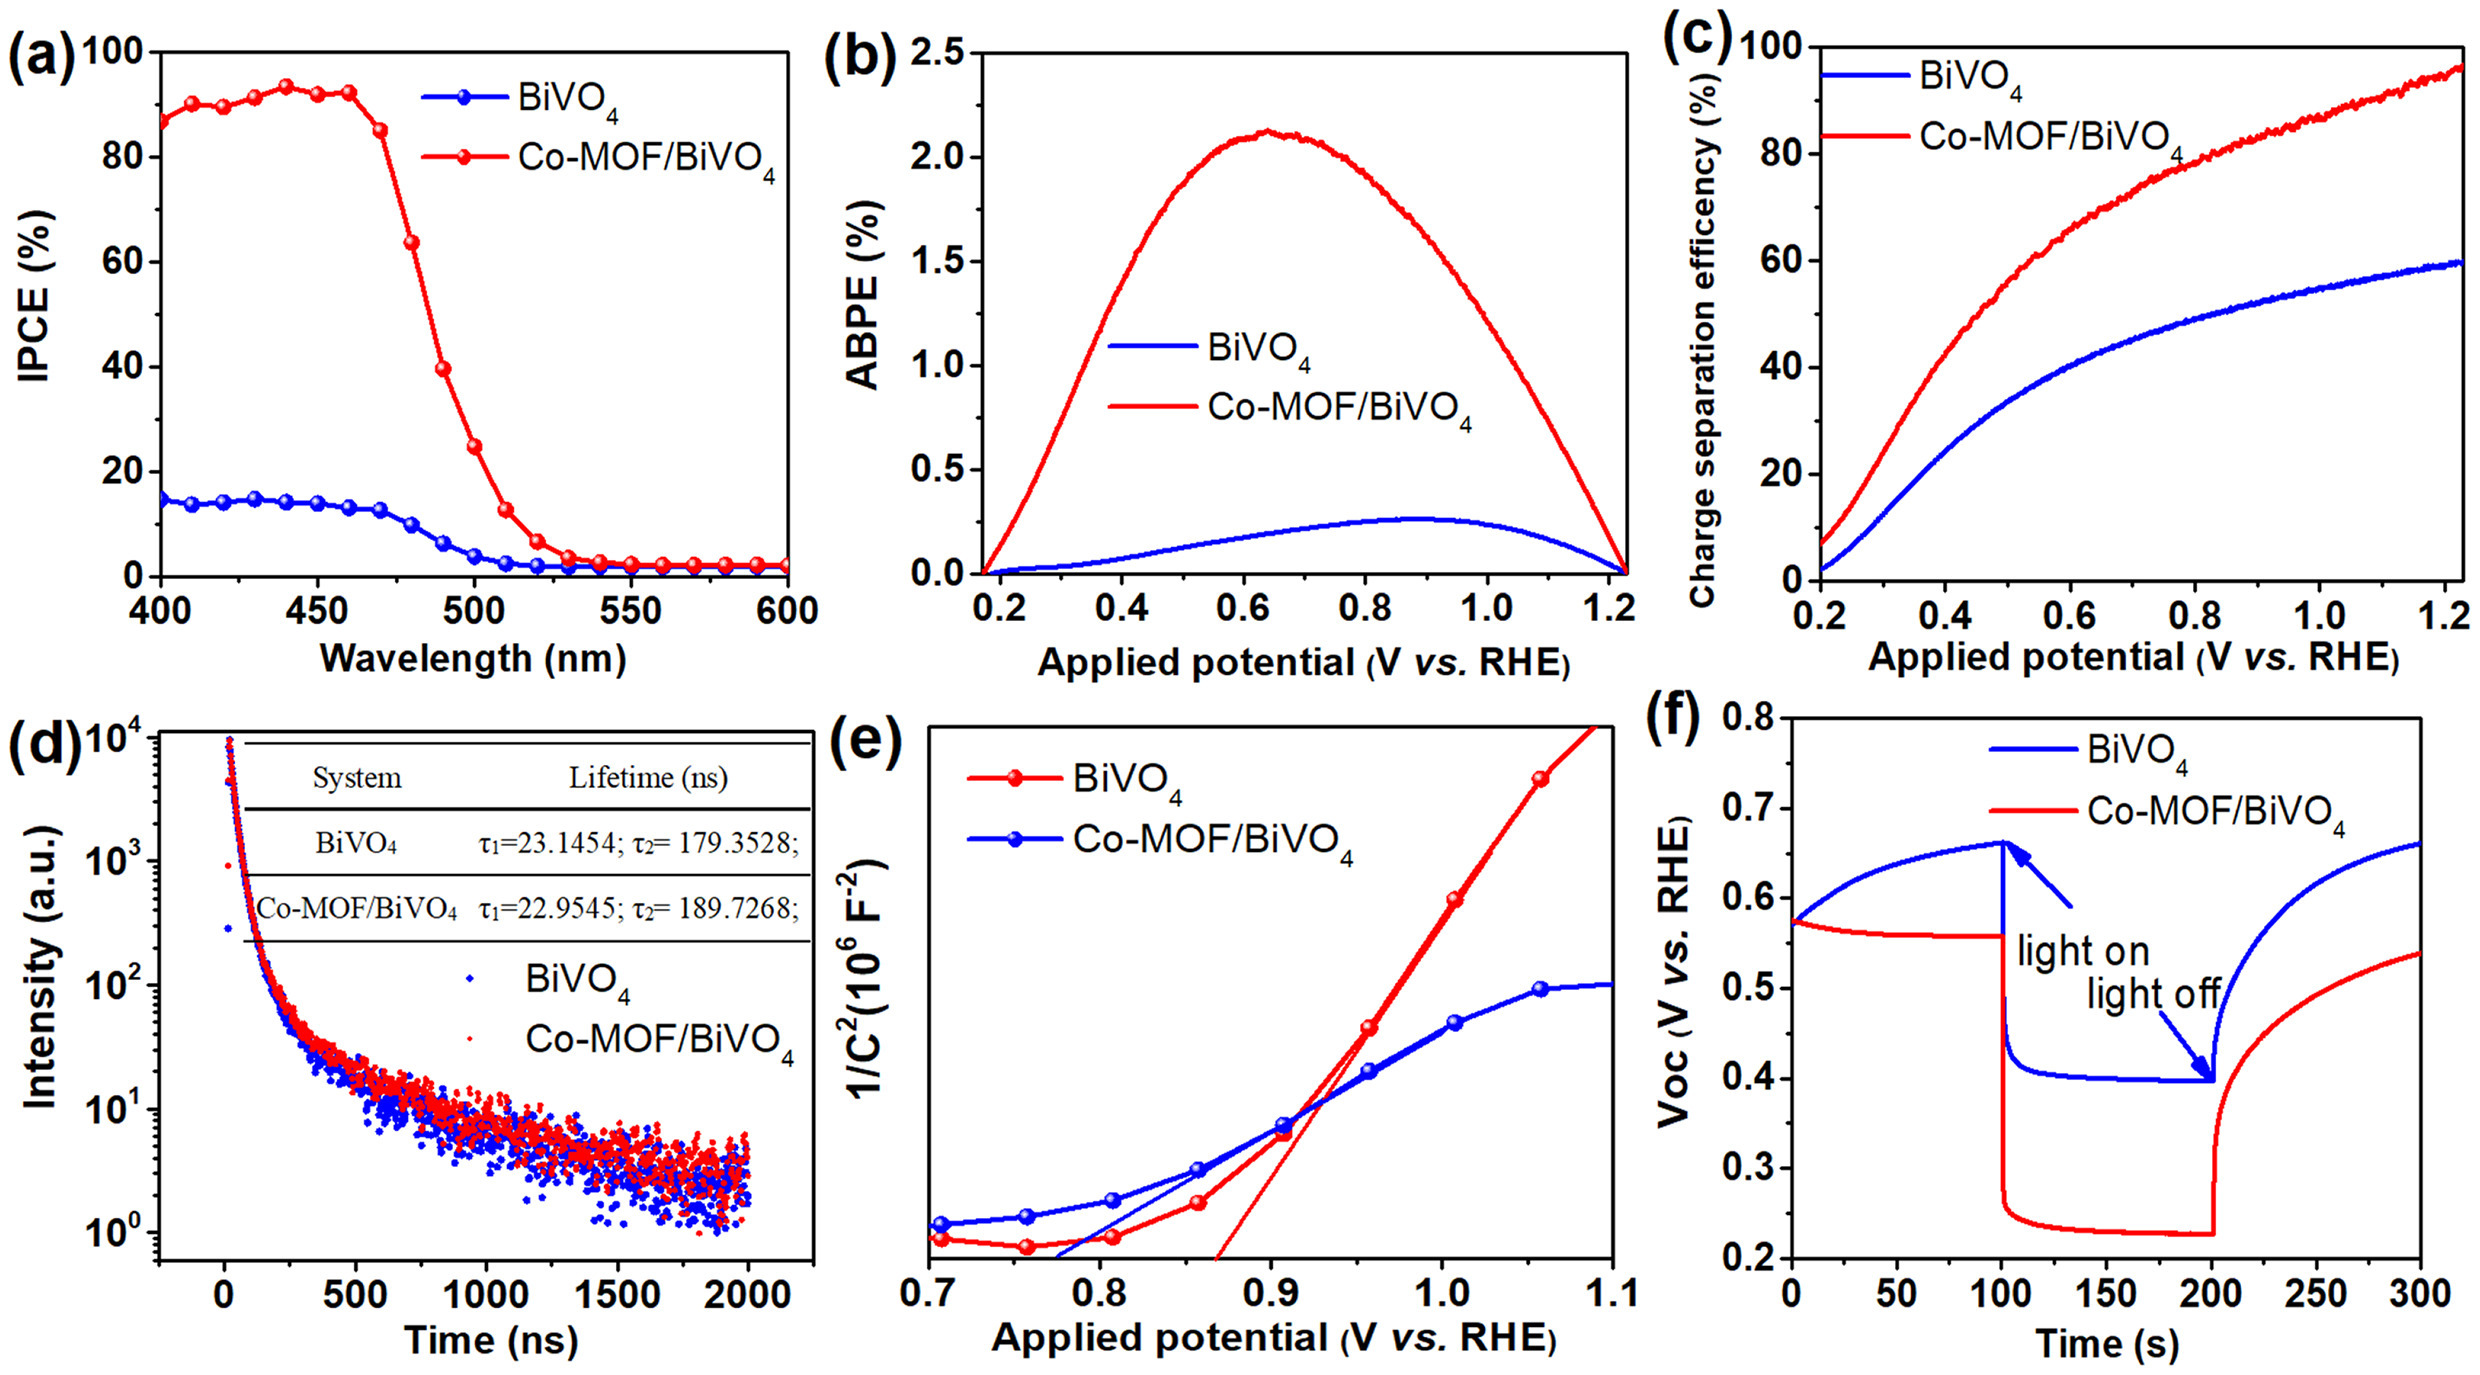
To a better comprehension, the existence mechanism of BiVO4 and Co-MOF nanosheets, the Mott-Schottky of as-prepared anodes is shown in the Fig. 4e. In general, a smaller slope of graph in Fig. 4e indicates a higher density of free carriers and a higher conductivity [41]. In our case, Co-MOF/BiVO4 has a lower slope than BiVO4, indicating that Co-MOF nanosheets passivates the surface of BiVO4 and thus reduces carriers' recombination. The addition of Co-MOF nanosheets leads to an increase in the conductivity of BiVO4 and further improves the PEC water decomposition performance of BiVO4, which corresponds to the result in Fig. 3d. A function of time of open circuit voltage (Voc) has been used to analyze the electronic recombination kinetics of the prepared photoanode in 1 mol/L borate buffer electrolyte under sunlight irradiation. Fig. 4f illustrates that Co-MOF/BiVO4's Voc decay rate is lower than bare BiVO4's. Therefore, the lower Voc decay rate of Co-MOF/BiVO4 provides a greater driving force for charge separation.
According to CV cycle diagram of Co-MOF/BiVO4 sample in Fig. S15 (Supporting information), there is a reduction peak at ca. 1.6 V vs. RHE [42]. XPS was used to further analyze the changes in the surface structure and chemical state of Co-MOF/BiVO4 after PEC water splitting testing. The Co3+ can be observed obviously in Fig. S16 (Supporting information), indicating that the Co2+ becomes Co3+ oxidized via holes of BiVO4 in part in the Co-MOF nanosheets [43]. The above experimental results indicate that Co2+/Co3+ are constantly transformed into each other in Co-MOF/BiVO4 electrode. Considering the experimental results and literature reports, we discussed the possible reaction mechanism of Co-MOF/BiVO4 photoanode PEC water splitting in the Fig. 5. Under irradiation, the photogenerated electrons will transfer to the Co-MOF/BiVO4 surface, and further captured by the Pt electrode through the external circuit, thereby participating in the reduction of water to produce H2. While the photogenerated holes tend to move to the surface of BiVO4 and captured by the Co-MOF nanosheets. Subsequently, the Co2+ is oxidized to Co3+ by holes. Afterwards, the oxygen is produced in the process of unstable Co3+ is reduced to Co2+ by electrons to oxidize the interfacial H2O. Moreover, the continuous conversion of Co2+ and Co3+ to each other provides a steady stream of active sites for water oxidation [44,45]. These processes realize the effective transfer and separation of photogenerated charges of BiVO4, which is conducive to PEC water spitting. In short, the reason for this enhanced PEC performance can be associated with the synergistic effect of Co-MOF nanosheets and BiVO4.

In summary, a novel passivation layer, namely 2D Co-MOF nanosheets, was in situ deposited on the BiVO4 photoanode through a unique strategy of hydrothermal reaction to inhibit recombination rate of carriers. With a current density of 6.0 mA/cm2, the resultant Co-MOF/BiVO4 photoanode displayed significant improvements in PEC oxidation over the original BiVO4 film at 1.23 V vs. RHE under AM 1.5G irradiation. Based on the optimized Co-MOF/BiVO4 photoanode, 96% of charge separation efficiency is achieved under AM 1.5G irradiation at 1.23 V vs. RHE, indicating that the water oxidation is carried out efficiently with surface holes to improve charge separation efficiency. Moreover, the Co-MOF/BiVO4 film displayed higher H2 and O2 evolution rates of 233 µmol/cm2 and 115 µmol/cm2 for PEC water spitting, about 20 times that of pure BiVO4 film. The outstanding PEC performance of Co-MOF/BiVO4 photoanode may be attributed that the passage of photoexcited charge carriers of BiVO4 is effectively inhibited by the passivation layer of 2D Co-MOF nanosheets.
The authors declare no conflict of interest.
This work was financially supported by the National Natural Science Foundation of China (No. 52173277), the Innovative Research Team for Science and Technology of Shaanxi Province (No. 2022TD-04), the Fundamental Research Funds for the Central Universities of Chang'an University (Nos. 300102299304, 300102291403), the Natural Science Basic Research Fund of Shaanxi Province (No. 2020JZ-20).
Supplementary material associated with this article can be found, in the online version, at doi:
S. Huang, T. Ouyang, B. Zheng, et al., Angew. Chem. Int. Ed. 60 (2021) 9546–9552. doi: 10.1002/anie.202101058
S. Wu, Z. Xu, J. Zhang, et al., Sol. RRL 5 (2021) 2100668. doi: 10.1002/solr.202100668
Z. Cao, Q. Wang, H. Cheng, Chin. Chem. Lett. 32 (2021) 2617–2628. doi: 10.1016/j.cclet.2021.01.009
S. Wang, W.E.I. Chen, W. Zhou, et al., Energy Environ. Sci. 14 (2021) 6428–6440. doi: 10.1039/D1EE01395E
Y. Chen, M. Xu, J. Wen, et al., Nat. Sustain. 4 (2021) 618–626. doi: 10.1038/s41893-021-00697-4
A. Fujishima, K. Honda, Nature 238 (1972) 37–38. doi: 10.1038/238037a0
X. Wang, H. Jiang, M. Zhu, et al., Chin. Chem. Lett. 34 (2023) 107683. doi: 10.1016/j.cclet.2022.07.026
Y. Li, Q. Mei, Z. Liu, et al., Appl. Catal. B: Environ. 304 (2022) 120995. doi: 10.1016/j.apcatb.2021.120995
B. Chen, Z. Zhang, M. Baek, et al., Appl. Catal. B: Environ. 237 (2018) 763–771. doi: 10.1016/j.apcatb.2018.06.048
J. Jian, Y. Xu, X. Yang, et al., Nat. Commun. 10 (2019) 2609. doi: 10.1038/s41467-019-10543-z
Y. Wang, J. Huang, L. Wang, et al., Chin. J. Struct. Chem. 41 (2022) 2201054–2201068.
Y. Zhang, Y. Li, D. Ni, et al., Adv. Funct. Mater. 29 (2019) 1902101. doi: 10.1002/adfm.201902101
T. Tian, C. Dong, X. Liang, et al., J. Catal. 377 (2019) 684–691. doi: 10.1016/j.jcat.2019.08.012
Q. Meng, B. Zhang, L. Fan, et al., Angew. Chem. Int. Ed. 58 (2019) 19027–19033. doi: 10.1002/anie.201911303
M. Zheng, X. Cao, Y. Ding, et al., J. Catal. 363 (2018) 109–116. doi: 10.1016/j.jcat.2018.04.022
S. He, C. Yan, X Chen, et al., Appl. Catal. B: Environ. 276 (2020) 119138. doi: 10.1016/j.apcatb.2020.119138
Y. Li, Q. Wang, X. Hu, et al., Chem. Eng. J. 433 (2022) 133592. doi: 10.1016/j.cej.2021.133592
H. Yin, D. Li, X. Wang, et al., J. Phys. Chem. C 125 (2021) 8369–8375. doi: 10.1021/acs.jpcc.1c02369
X. Li, S. Liu, K. Fan, et al., Adv. Energy Mater. 8 (2018) 1800101. doi: 10.1002/aenm.201800101
D. Xu, T. Xia, W. Fan, et al., Appl. Surf. Sci. 491 (2019) 497–504. doi: 10.1016/j.apsusc.2019.06.164
H. Han, F. Karlicky, S. Pitchaimuthu, et al., Small 15 (2019) 1902771. doi: 10.1002/smll.201902771
W. Zhang, R. Li, X. Zhao, et al., ChemSusChem 11 (2018) 2710–2716. doi: 10.1002/cssc.201801162
S. Kim, T.A. Dela Pena, S. Seo, et al., Appl. Surf. Sci. 563 (2021) 150357. doi: 10.1016/j.apsusc.2021.150357
X. Wei, Y. Li, H. Peng, et al., Chem. Eng. J. 355 (2019) 336–340. doi: 10.1016/j.cej.2018.08.009
S. Huang, B. Zheng, Z. Tang, et al., Chem. Eng. J. 422 (2021) 130086. doi: 10.1016/j.cej.2021.130086
R. Mo, D. Han, Z. Ren, et al., Chin. Chem. Lett. 32 (2021) 3619–3622. doi: 10.1016/j.cclet.2021.06.062
T.W. Kim, K.S. Choi, Science 343 (2014) 990–994. doi: 10.1126/science.1246913
M. Liu, L. Kong, X. Wang, et al., Nano Res. 14 (2021) 4680–4688. doi: 10.1007/s12274-021-3404-1
M.F.R. Samsudin, H. Ullah, R. Bashiri, et al., ACS Sustain. Chem. Eng. 8 (2020) 9393–9403. doi: 10.1021/acssuschemeng.0c02063
G. Chen, J. Zhang, F. Wang, et al., Chem. Eur. J. 24 (2018) 18413–18418. doi: 10.1002/chem.201804339
J. Huang, Y. Tian, Y. Wang, et al., J. Solid State Chem. 299 (2021) 122154. doi: 10.1016/j.jssc.2021.122154
X. Cao, C. Xu, X. Liang, et al., Appl. Catal. B: Environ. 260 (2020) 118136. doi: 10.1016/j.apcatb.2019.118136
Z. Zou, T. Wang, X. Zhao, et al., ACS Catal. 9 (2019) 7356–7364. doi: 10.1021/acscatal.9b00072
J. Huang, K. Li, L. Wang, et al., Chin. Chem. Lett. 33 (2022) 3787–3791.
K. Villa, F. Novotny, J. Zelenka, et al., ACS Nano 13 (2019) 8135–8145. doi: 10.1021/acsnano.9b03184
Y. Jia, W. Zhang, J.Y. Do, et al., Chem. Eng. J. 402 (2020) 126193. doi: 10.1016/j.cej.2020.126193
F. Le Formal, N. Tétreault, M. Cornuz, et al., Chem. Sci. 2 (2011) 737–743. doi: 10.1039/C0SC00578A
M. Tayebi, B.K. Lee, Renew. Sustain. Energy Rev. 111 (2019) 332–343. doi: 10.1016/j.rser.2019.05.030
M.G. Ahmed, I.E. Kretschmer, T.A. Kandiel, et al., ACS Appl. Mater. Interfaces 7 (2015) 24053–24062. doi: 10.1021/acsami.5b07065
K. Zhang, B. Jin, C. Park, et al., Nat. Commun. 10 (2019) 2001. doi: 10.1038/s41467-019-10034-1
H. She, P. Yue, J. Huang, et al., Chem. Eng. J. 392 (2020) 123703. doi: 10.1016/j.cej.2019.123703
M. Chhetri, S. Dey, C.N.R. Rao, ACS Energy Lett. 2 (2017) 1062–1069. doi: 10.1021/acsenergylett.7b00247
X. Zhao, B. Pattengale, D. Fan, et al., ACS Energy Lett. 3 (2018) 2520–2526. doi: 10.1021/acsenergylett.8b01540
F. Tang, W. Cheng, H. Su, et al., ACS Appl. Mater. Interfaces 10 (2018) 6228–6234. doi: 10.1021/acsami.7b15674
L. Li, S. Xiao, R. Li, et al., ACS Appl. Energy Mater. 1 (2018) 6871–6880. doi: 10.1021/acsaem.8b01215

Figure 1 Top-view SEM images of (a) BiOI, (b, c) BiVO4, (d) Co-MOF/BiVO4, (e–h) mapping, (i) TEM and (j) HR-TEM images of Co-MOF/BiVO4 film.

Figure 2 (a) XRD analysis. (b) FT-IR patterns. High-resolution (c) Co 2p, (d) Bi 4f, (e) V 2p and (f) O 1s XPS spectra of the Co-MOF/BiVO4 sample.

Figure 3 LSV curves of BiVO4, Co-MOF/BiVO4 electrode with (a) and without (b) light. (c) Current-time curves of BiVO4, Co-MOF/BiVO4 electrode in 1 mol/L potassium borate electrolyte (pH 9.5) aqueous solution with light. (d) Electrochemical impedance spectroscopy (EIS) at 1.23 V vs. RHE under illumination. (e) H2 and O2 evolution of BiVO4 and (f) Co-MOF/BiVO4 films at 1.23 V vs. RHE and the Faradaic efficiency.

Figure 4 (a) IPCE measured at 1.23 V vs. RHE; (b) ABPE; (c) charge separation efficiency (ηbulk); (d) the time-resolved PL spectra; (e) Mott-Schottky curve and (f) open-circuit photovoltage (Voc) vs. time curves of the prepared BiVO4, Co-MOF/BiVO4 photoanodes.

 扫一扫看文章

扫一扫关注我们
 DownLoad:

 下载:
下载:

 下载:
下载: