
Figure 1.
(A) Chemical structures of DTPA-2,3-P, DTPA-2,5-P and DTPA-2,6-P. (B) Schematic illustration of powder dusting method for latent fingerprint imaging by using AIEgens.
Synthesis of D-A typed AIE luminogens in isomeric architecture and their application in latent fingerprints imaging
Peijuan Zhang , Qifei Shen , Yu Zhou , Fengyi He , Bo Zhao , Zhi Wang , Ruohan Xu , Yanzi Xu , Zhiwei Yang , Lingjie Meng , Dongfeng Dang

Fingerprint is one of the unique patterns for mankind, which remains constant over the whole lifespan [1–3]. The ridges and furrows are different even for the twins who share same gens. Therefore, fingerprints have been used to establish identification and classify confidential information in ancient time [4]. At present, in addition to the investigation for personal identification [1–4], some information contained in fingerprints is also used for the exploration of heritable genes in biological research [5]. In this view, the visualization of fingerprints is of great importance. However, most fingerprints left by our hands mainly consist of lipids and are invisible to the naked eyes. Therefore, techniques to well image the latent fingerprints (LFPs) in a facile way are urgently needed.
Over the past few decades, several methods have been developed for the detection and visualization of LFPs, including the soaking in or spraying method [6,7], cyanoacrylate esters fuming method [8,9], and powder dusting method [10]. Among them, the soaking in or spraying method is not suitable for permeable surfaces, and the fuming method usually produces toxic gas, resulting in the potential health risks. In contrast to the above-mentioned methods, powder dusting is considered as one of the most convenient and applicable methods for the visualization of LFPs (Fig. 1) [11]. In this process, the prepared powders can be physically stuck to the lipids in latent fingerprints, leading its visualization to naked eyes. However, it is noted that some traditional powders, such as titanium dioxide and aluminum nanoparticles, still suffer from severe drawbacks, such as low resolution and high background interference [11]. Therefore, fluorescent powders of quantum dots [12], up-conversion nanoparticles [13,14], and carbon dots [15–17] have been reported recently to improve the signal-to-noise ratios. Despite the tremendous achievements, some issues of long chromogenic time, high cost and easily quenched emission still exist. It is fortunate that the appearance of aggregation-induced emission (AIE), firstly reported by Tang et al. [18–24] provides the chance to overcome the quenched emission and inferior photo-stability in some emitters for LFPs imaging. Benefiting from their unique features, several AIE luminogens (AIEgens) have also been utilized to realize LFPs imaging [6,7,25–29]. However, it should be mentioned that the serious background interference and low resolution, especially the lack of analysis for level 3 details in fingerprints, still limits the fast development in this field.
Based on this consideration, donor-acceptor (D-A) typed AIEgens of DTPA-2,3-P, DTPA-2,5-P and DTPA-2,6-P are designed and synthesized here. All these molecules exhibit isomeric chemical structures but in different D-A linkage, where triphenylamine (TPA) units are attached to the 2,3-, 2,5- and 2,6-position of pyrazine (P) in DTPA-2,3-P, DTPA-2,5-P, and DTPA-2,6-P, respectively. It is observed that a much broad absorption (250–470 nm) and emission (450–650 nm) spectra occur in all these three cases. It is worth noting that the highest photoluminescence quantum yield (PLQY) value of 10.06% can be obtained for DTPA-2,3-P in solid state. This is caused by its twisted molecular backbone, thus preventing the intermolecular π-π interactions and finally resulting in an impressive AIE feature. By employing the DTPA-2,3-P in powder dusting method, fluorescence imaging of LFPs, including the cores and ridges (level 1), the lakes, terminals, and ridge dots (level 2), and even the pores (level 3), can be clearly captured by the naked eyes. Moreover, confocal laser scanning microscope (CLSM) enables us to image more details of pores and ridges on level 3, including their location, distribution, and shapes in fingerprints. Our results indicate that by combining the highly emissive AIEgens of DTPA-2,3-P with the powder dusting method, high-resolution LFP images can be well obtained, resulting in the potential application in criminal investigations in the future.
By using triphenylamine (TPA) as the electron-donating units (D) and pyrazine (P) as the electron-withdrawing building blocks (A), DTPA-2,3-P, DTPA-2,5-P and DTPA-2,6-P were synthesized through the Suzuki coupling reaction with a yield of 63%-84%, and their structures were outlined in Fig. 1A. As depicted, all these molecules exhibit isomeric chemical structures but in different D-A linkage, where TPA units are attached to the 2,3-, 2,5- and 2,6-position of pyrazine in DTPA-2,3-P, DTPA-2,5-P and DTPA-2,6-P, respectively. The synthetic routes are also shown in Scheme S1 (Supporting information). Their chemical structures were well confirmed by 1H NMR, 13C NMR and high-resolution mass spectra (Figs. S1–S9 in Supporting information). All these molecules display good solubility in common solvents, such as tetrahydrofuran (THF), dichloromethane (DCM), and chloroform.
The UV-vis absorption spectra and photoluminescence (PL) spectra of DTPA-2,3-P, DTPA-2,5-P and DTPA-2,6-P were firstly measured in tetrahydrofuran (THF) solution ([c] = 1.0 × 10⁻⁵ mol/L) at room temperature. As shown in Fig. 2A, there are two strong absorption bands for all these three molecules, which can be attributed to a high-energy π-π* transition and a low-energy intramolecular charge transfer (ICT) band, respectively [30,31]. It is observed that by changing the link position in these molecules, the absorption characteristics were affected significantly, resulting in the peaks at 369, 418 and 394 nm for DTPA-2,3-P, DTPA-2,5-P and DTPA-2,6-P, respectively. This is probably caused by their different molecular planarity and ICT interactions, where the planar structure and significantly enhanced ICT occurred in DTPA-2,5-P, thus leading to the red-shifted absorption spectrum. PL spectra in THF solution for all these molecules are depicted in Fig. 2B. As displayed, the emissive features in a range of 450–650 nm can be observed here with peaks located at 508, 522 and 514 nm for DTPA-2,3-P, DTPA-2,5-P and DTPA-2,6-P, respectively. Their Stokes' shifts were also summarized in Table 1. In addition, all these molecules exhibit extensive emission signals in solid state (Fig. 2C). This is probably caused by their AIE-active features.

Therefore, to further investigate their AIE characteristics, PL spectra of DTPA-2,3-P, DTPA-2,5-P and DTPA-2,6-P in THF/water mixture with different water fractions (fw) were measured (Figs. 2D–F). Their relative PL intensities (I/I0) were also shown in Figs. 2G–I, where I0 is the initial emission intensity in THF solution. As illustrated, all three molecules exhibit strong emission in THF solution but then suddenly quenched with the fw increasing from 10% to 60%. This is probably derived from the existence of twisted intramolecular charge transfer (TICT) state caused by the enhancement of solvent polarity [32–35]. To be mentioned, the emission intensity is significantly intensified by further increasing the fw (70%–90%), showing their obvious AIE properties here. Additionally, the PL spectra of DTPA-2,3-P, DTPA-2,5-P and DTPA-2,6-P in DMSO and DMSO/water mixtures with a fw of 90% were also measured (Fig. S10 in Supporting information). The significantly enhanced PL intensities in DMSO/water also demonstrate their distinct AIE features. In addition, PL spectra of DTPA-2,3-P, DTPA-2,5-P and DTPA-2,6-P in various solvents but with different polarities were also measured to further investigate their TICT properties (Fig. S11 in Supporting information). It is observed that when changing the solvent from nonpolar hexane to polar dimethyl sulfoxide, obvious red-shifted emissions can be observed for all these molecules. Furthermore, the absolute photoluminescence quantum yields (PLQYs) for DTPA-2,3-P, DTPA-2,5-P and DTPA-2,6-P in THF solution and solid states were recorded. As summarized in Table 1, although efficient emission was observed for all these molecules in solution, a superior PLQY value of 10.06% in solid state can be obtained for DTPA-2,3-P. This is probably caused by its twisted molecular backbone to prevent the strong π-π interaction. After that, their transient decay spectra (Fig. S12 in Supporting information) and the corresponding radiative decay rates (kr), and non-radiative decay rates (knr) were also calculated (Table 1). It is noted that despite the similar knr, a much higher kr value is achieved in DTPA-2,3-P in solids. This can partly explain the high brightness and AIE features for DTPA-2,3-P [36,37].
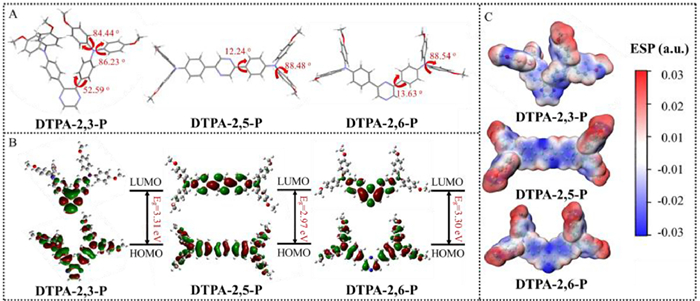
To further understand their unique optical-physical properties, theoretical calculations were carried out through density functional theory (DFT) for DTPA-2,3-P, DTPA-2,5-P and DTPA-2,6-P. Their molecular geometries were firstly optimized. As displayed in Fig. 3A, twisted TPA units in propeller-like architecture can be observed in all these molecules. However, the co-planarity of molecular backbones can be fine-tuned by changing their link position, where the largest torsional angle of up to 52.59° between TPA and P units occurred in DTPA-2,3-P, but these values can be changed to be only 12.24° and 13.63° for DTPA-2,5-P and DTPA-2,6-P, respectively. The twisted skeleton in DTPA-2,3-P also well verifies its AIE characteristics and high brightness in solid state. Besides, the highest occupied molecular orbital (HOMO) and the lowest unoccupied molecular orbital (LUMO) energy levels were also calculated (Fig. 3B). As displayed, the HOMO energy level is well distributed on the whole backbones, but the LUMO energy level is mainly located on the electron-withdrawing P units [38,39]. Meanwhile, due to its much twisted skeleton, a much wide band gap (Eg = 3.31 eV) in DTPA-2,3-P was presented in contrast to that in DTPA-2,5-P (Eg = 2.97 eV) and DTPA-2,6-P (Eg = 3.30 eV). This is also consistent with the blue-shifted absorption and emission spectra in their experimental results. Then, the electrostatic surface potential (ESP) maps of these molecules were also investigated (Fig. 3C). In these cases, typical ESP distributions in D-A typed molecules can be observed, where positive potentials (red color) appear on TPA building blocks, especially on the methoxy group, but negative potentials (blue color) only appear on pyridine (A) units, indicating the distinct D-A intramolecular interaction in all these molecules [40].
To achieve the latent fingerprint imaging, the corresponding fingerprints powders were firstly prepared by combing the commercialized magnetic powders with emissive AIEgens (Fig. S13A in Supporting information). Then, by collecting the fingerprints on a glass slide and adhering to these prepared fingerprint powders, the images can be acquired by smartphone under a 365 nm UV irradiation (Fig. 1). These procedures were also listed in Support Information. In order to compare the imaging performance of DTPA-2,3-P, DTPA-2,5-P, and DTPA-2,6-P, all these molecules were applied to prepare LFP powders firstly. The mass ratio of AIEgens is 2.5% here. The morphologies of pure magnetic powders and AIEgens-based fingerprints powders were also investigated by scanning electron microscope (SEM) (Fig. S14 in Supporting information). After the grinding, all fingerprint powders exhibit similar particle diameters (~300 nm), but are much smaller than that in pure magnetic powders. It is noted that almost no fluorescence signals were observed in the fingerprint stained with DTPA-2,6-P, whereas DTPA-2,3-P and DTPA-2,5-P based powders can well visualize the whole structures of fingerprints (Figs. S13B–D in Supporting information). In particular, the distinct features and complete overall pattern of level 1 details (ridges) in fingerprints can be well achieved for DTPA-2,3-P, showing the superior imaging resolution over the other two cases. To further verify the difference between their imaging performance, ImageJ software was utilized to measure their imaging resolution (Fig. S13E in Supporting information), which was determined by the gray values of the white line regions in the corresponding fingerprints. As we expected, the most intensive variation of signal intensity between fingerprint ridges and furrows can be observed for DTPA-2,3-P based LFPs image, leading to the superior imaging resolution. This is caused by its impressive fluorescence brightness and high PLQY value in solid state, thus providing an excellent signal-noise ratio. Unfortunately, although the detailed features in level 1 (ridges) and level 2 (lakes or ridge dots) can be well imaged here, the information in level 3 (pores) is still in deficiency.
Therefore, to optimize the imaging performance, the effect of mass ratio of DTPA-2,3-P to magnetic powders on imaging performance was then studied. Four different mass ratios (5.00%, 2.50%, 1.67% and 1.25%) were selected and their LFPs imaging quality was well compared (Fig. S15 in Supporting information). It is observed that similar morphologies were given to all these powders with different mass ratios (Fig. S16 in Supporting information). Meanwhile, a similar resolution reflected by gray values variation can be obtained in these cases (Fig. S17 in Supporting information). However, it is noted that when the mass ratio of DTPA-2,3-P was determined to be 1.67%, the level 3 pores of ridges in fingerprints can be clearly captured even by the naked eyes (Fig. S15 in Supporting information). Therefore, the fingerprint powders with a mass ratio of 1.67% for DTPA-2,3-P were selected to complete the follow-up studies.
After that, the optimized DTPA-2,3-P based fingerprint powders were used for LFPs imaging on various substrate surfaces, including smooth ones (tinfoil, plastic, ceramic and metal) and rough ones (paperboard, leather, and wood). Similar to the image on glass slide, the LFPs on these different substrates were developed successfully (Fig. S18 in Supporting information), providing clear and intact fingerprint patterns with high resolution. To acquire more detailed information, the images on glass slide, tinfoil, and wood were magnified and further compared (Figs. 4A–C). All the information, such as level 1 of cores and ridges, level 2 of terminals, lakes, and ridge dots, and level 3 of pores, can be clearly visible by the naked eyes. This may provide more evidence for identity verification in some circumstances. Besides, the resolutions by gray values for these developed LFP images on different substrates were shown in Fig. 4D. It is clear that no significant difference occurred in the resolution in spite of the variation of surfaces. This also indicates the universality of our prepared fingerprint powders in all these cases here. In addition, more LFPs samples were also collected to provide reliable results (Fig. S19 in Supporting information). It is observed that similar to our previous results, fingerprint patterns with high resolution can also be obtained, indicating its great potential for DTPA-2,3-P in fingerprint imaging. Then, to gain more insights into the imaging performance, the overlapped fingerprints, which are quite common in the real crime scene, were collected and visualized. As illustrated, all the crossed regions in these overlapped cases can be clearly imaged (Fig. S20 in Supporting information), especially that the ridges in two different fingerprints can be well discriminated in the enlarged views. In contrast to the previously reported methods, such as time-of-flight secondary ion mass spectrometry [41] or laser-induced breakdown spectroscopy [42], our work here provides a much easy and facile method to image the overlapped fingerprints. In addition, the imaging stability was also investigated to meet real-world applications. As depicted, the glass slides stained with LFPs were immersed in solution with different pH values for 3 min, the collected images remained undamaged and their detailed structures can still be clearly visualized (Fig. S21 in Supporting information). The resistance and stability of images further demonstrate the high practicability and feasibility of our fingerprint powders for LFPs detection.

Getting access to the level 3 information in LFPs, including the shape and distribution of pores, and the width of ridges, is quite necessary for LFPs imaging. Therefore, the inverted fluorescence microscope and confocal laser scanning microscope (CLSM) were further applied here. As anticipated, the distribution of lipids secreted by the human body in fingerprints can be well observed in the inverted fluorescence microscope (Fig. S22A in Supporting information). Then, the adhered fingerprints powders can also be well visualized under bright field (Fig. S22B in Supporting information). This finally resulted in the fluorescence LFPs imaging with pores of 100~120 µm (Fig. S22C in Supporting information). These results here indicated that our prepared AIEgens could easily adhere to the lipid secretions in LFPs due to the hydrophobic effect and interaction, thus leading to the corresponding fluorescence signals.
After that, CLSM was further employed to acquire the level 1–3 details in fingerprints. Firstly, fluorescence images were recorded by CLSM over 10 min to investigate the photo-stability (Fig. S23 in Supporting information). It is observed that after the continuous irradiation, the fluorescence signals for DTPA-2,3-P still remained at about 86.3%, indicating its superior photo-bleaching resistance. Then, a 3D-reconstructed fluorescence image of the whole LFP was shown in Fig. 4E. It is observed that the detailed information, such as level 1 of cores and ridges, level 2 of lakes, terminations and ridge dots, as well as level 3 of pores, can be presented clearly. When the image was further magnified, the width of ridges and distance between two ridges (Fig. 4F), along with the diameter and distribution of pores (Fig. 4G), can be measured precisely. These unique features could play important roles in individual identification. After that, the commercial software Imaris was also employed for a 3D reconstructed visualization, including the simple case (Figs. 4H and J) and surface processed case (Figs. 4I and K) [43]. As observed, the shapes and sizes of pores and ridges are similar to the above-mentioned results, but a much clearer image with a better resolution can be obtained. Furthermore, it is known that fluorescence lifetime imaging (FLIM) can well distinguish these similar emission signals but with different lifetimes [44]. Therefore, this was also employed for level 3 details of fingerprints in both 2D and 3D views by using the FLIM mode of CLSM (Fig. S24 in Supporting information). It is also noted that the 2D or 3D imaging mode makes the fluorescent intensity a little different here. All these results demonstrate that the AIE-active DTPA-2,3-P could be a promising agent for LFPs imaging.
In this work, D-A typed AIEgens of DTPA-2,3-P, DTPA-2,5-P and DTPA-2,6-P with isomeric architectures were synthesized. All these molecules exhibited strong emission covering from 450 nm to 650 nm. Especially, DTPA-2,3-P displayed a high PLQY value of 10.06% in the solid state, showing great potential in the detection and visualization of fingerprints. By utilizing the powder dusting method, LFPs imaging containing the level 1–3 details could be easily achieved on both smooth and rough substrates. Moreover, CLSMs enabled us to achieve high-resolution LFPs images in both 2D and 3D views. This demonstrates that DTPA-2,3-P based fingerprint powders with high brightness and stability can be potentially applied to visualize and identify the personal information in LFPs, thus doing a favor to the criminal investigation in the future.
The authors declare that they have no known competing financial interests or personal relationships that could have appeared to influence the work reported in this paper.
The authors are thankful for the financial support from the National Natural Science Foundation of China (No. 21975197), Shaanxi Province Key R&D Program-International Science and Technology Cooperation Project (No. 2022KW-40), and the Innovation Capability Support Program of Shaanxi (No. 2021TD-57). The authors would also thank Ying Hao in Instrumental Analysis Center of Xi'an Jiao Tong University for her help in the measurement of CLSMs.
Supplementary material associated with this article can be found, in the online version, at doi:
P. Hazarika, D.A. Russell, Angew. Chem. Int. Ed. 51 (2012) 3524–3531. doi: 10.1002/anie.201104313
M. Wang, M. Li, A.Y. Yu, et al., Adv. Funct. Mater. 27 (2017) 1606243. doi: 10.1002/adfm.201606243
Y.Q. Wang, J. Wang, Q.Q. Ma, Z.H. Li, Q. Yuan, Nano Res. 11 (2018) 5499–5518. doi: 10.1007/s12274-018-2073-1
H. Faulds, Nature 22 (1880) 605. doi: 10.1038/022605a0
J.X. Li, J.D. Glover, H.G. Zhang, et al., Cell 185 (2022) 95–112. doi: 10.1016/j.cell.2021.12.008
Y.L. Wang, C. Li, H.Q. Qu, et al., J. Am. Chem. Soc. 142 (2020) 7497–7505. doi: 10.1021/jacs.0c00124
A.H. Malik, A. Kalita, P.K. Iyer, ACS Appl. Mater. Interfaces 9 (2017) 37501–37508. doi: 10.1021/acsami.7b13390
T.C. Fung, K. Grimwood, R. Shimmon, et al., Forensic Sci. Int. 212 (2011) 143–149. doi: 10.1016/j.forsciint.2011.06.004
M. Tahtouh, J.R. Kalman, B.J. Reedy, J. Polym. Sci. A Polym. Chem. 49 (2011) 257–277.
G.S. Sodhi, J. Kaur, Forensic Sci. Int. 120 (2001) 172–176. doi: 10.1016/S0379-0738(00)00465-5
A.A. Ansari, K.M. Aldajani, A.N. AlHazaa, H.A. Albrithen, Coord. Chem. Rev. 462 (2022) 214523. doi: 10.1016/j.ccr.2022.214523
Y.Q. Li, C.Y. Xu, C. Shu, X.D. Hou, P. Wu, Chin. Chem. Lett. 28 (2017) 1961 -196. doi: 10.1016/j.cclet.2017.04.027
M. Wang, M. Li, M.Y. Yang, et al., Nano Res. 8 (2015) 1800–1810. doi: 10.1007/s12274-014-0686-6
D.L. Zhou, D.Y. Li, X.Y. Zhou, et al., ACS Appl. Mater. Interfaces 9 (2017) 35226–35233. doi: 10.1021/acsami.7b09850
D. Fernandes, M.J. Krysmannb, A. Kelarakis, Chem. Commun. 51 (2015) 4902–4905. doi: 10.1039/C5CC00468C
J. Chen, J.S. Wei, P. Zhang, et al., ACS Appl. Mater. Interfaces 9 (2017) 18429–18433. doi: 10.1021/acsami.7b03917
C.F. Wang, R. Cheng, W.Q. Ji, et al., ACS Appl. Mater. Interfaces 10 (2018) 39205–39213. doi: 10.1021/acsami.8b13545
J.D. Luo, Z.L. Xie, J.W.Y. Lam, et al., Chem. Commun. (2001) 1740–1741.
J. Mei, N.L.C. Leung, R.T.K. Kwok, J.W.Y. Lam, B.Z. Tang, Chem. Rev. 115 (2015) 11718–11940. doi: 10.1021/acs.chemrev.5b00263
M.M. Kang, Z.J. Zhang, N. Song, et al., Aggregate 1 (2020) 80–106. doi: 10.1002/agt2.7
J. Yang, M.M. Fang, Z. Li, Aggregate 1 (2020) 6–18. doi: 10.1002/agt2.2
J. Voskuhl, M. Giese, Aggregate 3 (2022) e124. doi: 10.1002/agt2.124
Z. Wang, Y. Zhou, R.H. Xu, et al., Coord. Chem. Rev. 451 (2022) 214279. doi: 10.1016/j.ccr.2021.214279
Y.H. Pan, X.X. Chen, L. Dong, et al., Chin. Chem. Lett. 32 (2021) 3895–3898. doi: 10.1016/j.cclet.2021.06.024
Y. Li, L.R. Xu, B. Su, Chem. Commun. 48 (2012) 4109–4111. doi: 10.1039/c2cc30553d
Z.J. Qiu, B. Hao, X.G. Gu, et al., Sci. China Chem. 61 (2018) 966–970. doi: 10.1007/s11426-018-9280-1
Y.H. Lia, Y. Sunb, Y. Deng, et al., Sens. Actuator. B: Chem. 283 (2019) 99–106. doi: 10.1016/j.snb.2018.12.002
J.W. Li, Z. Jiao, P.F. Zhang, et al., Mater. Chem. Front. 4 (2020) 2131–2136. doi: 10.1039/D0QM00059K
D. Xi, Y.Z. Xu, R.H. Xu, et al., Chem. Eur. J. 26 (2020) 2741–2748. doi: 10.1002/chem.201905169
D.F. Dang, P. Zhou, L.R. Duan, et al., J. Mater. Chem. A 4 (2016) 8291–8297. doi: 10.1039/C6TA02298G
D.F. Dang, X.C. Wang, Y. Zhi, et al., Org. Electron. 32 (2016) 237–243. doi: 10.1016/j.orgel.2016.02.021
Y.Z. Xu, C.B. Li, R.H. Xu, et al., Chem. Sci. 11 (2020) 8157–8166. doi: 10.1039/D0SC03160G
Y.Z. Xu, H.K. Zhang, N. Zhang, et al., Mater. Chem. Front. 5 (2021) 1872–1883. doi: 10.1039/D0QM00682C
C.C. Wang, S.Y. Yan, Y.Q. Chen, et al., Chin. Chem. Lett. 26 (2015) 323–328. doi: 10.1016/j.cclet.2014.11.029
K. Li, Y.Y. Liu, Y.Y. Li, et al., Chem. Sci. 8 (2017) 7258–7267. doi: 10.1039/C7SC03076B
R.H. Xu, D.F. Dang, Z. Wang, et al., Chem. Sci. 13 (2022) 1270–1280. doi: 10.1039/D1SC04254H
H. Nie, K. Hu, Y.J. Cai, et al., Mater. Chem. Front. 1 (2017) 1125–1129. doi: 10.1039/C6QM00343E
W.C. Zhang, J.H. Huang, X.Y. Lv, et al., Chin. Chem. Lett. 34 (2023) 107436. doi: 10.1016/j.cclet.2022.04.034
S. Tang, P. Murto, X.F. Xu, et al., Chem. Mater. 29 (2017) 7750–7759. doi: 10.1021/acs.chemmater.7b02049
T. Xu, H.F. Yao, L.J. Ma, et al., Angew. Chem. Int. Ed. 59 (2020) 9004–9010. doi: 10.1002/anie.201915030
N. Tuccitto, A. Bombace, A. Auditore, et al., Anal. Chem. 93 (2021) 14099–14105. doi: 10.1021/acs.analchem.1c01981
J.H. Yang, S.J. Choi, J.J. Yoh, Spectrochim. Acta Part B: At. Spectrosc. 134 (2017) 25–32. doi: 10.1016/j.sab.2017.06.001
L.M. He, Y.F. Shi, Q. Han, J. Mater. Chem. 22 (2012) 13187–13196. doi: 10.1039/c2jm32332j
R. Datta, T.M. Heaster, J.T. Sharick, A.A. Gillette, M.C. Skala, J. Biomed. Opt. 25 (2020) 071203.

Figure 1 (A) Chemical structures of DTPA-2,3-P, DTPA-2,5-P and DTPA-2,6-P. (B) Schematic illustration of powder dusting method for latent fingerprint imaging by using AIEgens.

Figure 2 (A) Normalized UV–vis spectra and PL spectra of DTPA-2,3-P, DTPA-2,5-P and DTPA-2,6-P (B) in THF solution ([c] = 1.0 × 10⁻⁵ mol/L) and (C) in solid state (the inset images show their fluorescence images under 365 nm UV irradiation). PL spectra of (D, G) DTPA-2,3-P, (E, H) DTPA-2,5-P and (F, I) DTPA-2,6-P in (D-F) THF/water mixtures and (G-I) their corresponding fluorescence intensity with water fraction from 0 to 90%.

Figure 3 (A) Optimized geometries, (B) HOMO and LUMO energy levels and (C) ESP distributions of DTPA-2,3-P, DTPA-2,5-P and DTPA-2,6-P calculated by DFT at B3LYP/6-31 G (d) level.

Figure 4 LFPs images by using DTPA-2,3-P based fingerprint powder (1.67%) on (A) glass slide, (B) tinfoil, (C) wood and their level 1–3 details. (D) Resolution analysis of fingerprints on different substrates (Fig. S18) along with the white line regions by using grayscale value. (E) 3D-reconstructed fluorescence images of the whole LFP captured by confocal laser scanning microscope and (F, G) its corresponding enlarged views. The images were optimized by Imaris software to reconstruct a simple 3D model ((H) top view, (J) side view) and a surface-processed 3D model ((I) top view, (K) side view).

 扫一扫看文章

扫一扫关注我们
 DownLoad:

 下载:
下载:
 下载:
下载: