Figure 1.
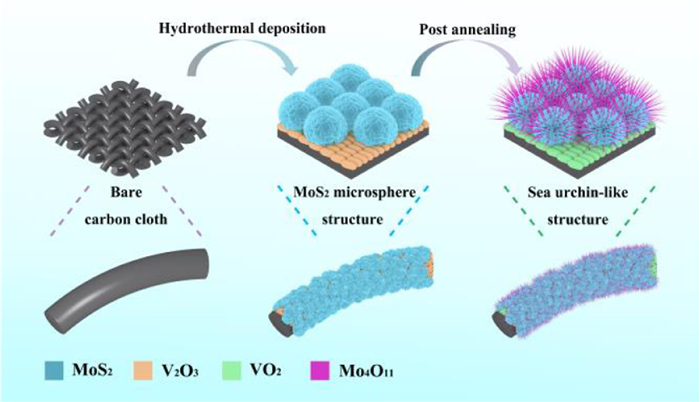
Schematic of preparing Mo-0.15-60 electrode by the hydrothermal deposition and post-annealing process.
Interfacial coupling of sea urchin-like (Mo4O11-MoS2-VO2) promoted electron redistributions for significantly boosted hydrogen evolution reaction
Yupeng Xing , Na Li , Shipeng Qiu , Gang Zhao , Shuhua Hao , Baojie Zhang

With the continuous consumption of fossil fuel, the exploring of new energy sources has become an urgent issue to solve the current energy crisis [1-3]. Hydrogen energy has received considerable attention for its high energy density, non-toxicity and no pollution to the environment after combustion [4-7]. Using green electricity (solar, hydro, etc.) to electrolyze the abundant water on earth is an ideal way to obtain hydrogen energy. Thermodynamic theory reveals that the theoretical decomposition voltage of water is 1.23 V, which is the minimum voltage to be overcome in the process of water electrolysis [8, 9]. However, in the field of industrial applications, water decomposition using ordinary electrodes requires overcoming extra voltage due to the slow kinetic process [10, 11]. This will waste electric energy and increase the cost to produce hydrogen [12, 13]. Therefore, in order to achieve efficient hydrogen evolution process, extensive exploration has been made in the preparation of efficient electrocatalysts for HER, which has become a hot point in recent years [14, 15].
So far, mature electrocatalyst for industrial hydrogen evolution reaction (HER) is commercial Pt/C. Unfortunately, the low reserves and the high price of platinum limit its large-scale application [16, 17]. Therefore, exploring inexpensive, stable, and the high-performance electrocatalyst is the key to reducing the hydrogen production cost. In recent years, transition metal dihalides (TMDs) with low cost, environmentally friendly properties and good HER performance have also been widely studied [18]. Among them, MoS2 has been widely studied because of its two-dimensional structure with good electron transport ability, stable physical properties, and low cost [19, 20]. In 2005, Nørskov's team had calculated by density functional theory (DFT) that the S-unsaturated edge of lamellar 2H-MoS2 has an approximately neutral Gibbs free energy of about 0.08 eV [21]. This is close to the Gibbs free energy of (111) face of Pt (~0.09 eV), which means MoS2 can have the potential to have similar HER performance to Pt. And indicating that MoS2 is a very promising non-noble metal HER catalyst. However, the basal plane that dominates in lamellar 2H-MoS2 has a high Gibbs free energy (~2.6 eV). This limits the proton adsorption process and is not conducive to HER [22]. So, the electrocatalytic performance of the original 2H-MoS2 is inferior to that of noble-metal electrocatalyst. Therefore, to enhance the HER rate of pristine MoS2, researchers have made many explorations. From the aspect of element doping, doping metal atoms (Fe, Co, Cu, V) [23-25], or non-metal atoms (such as N, O, P) [26-29] or precious metals (Pt, Ag) [30, 31] in MoS2 can significantly improve the intrinsic activity of MoS2 and reduce the onset potential for electrocatalytic reaction. From the aspect of morphology construction, exposing the unsaturated edge of MoS2 to increase the contact between the electrolyte and electrocatalytic active sites is also an effective strategy to improve the electrocatalytic activity of MoS2 [32].
With continuous research on transition metal electrocatalysts, reports of transition metal oxides (TMOs) used as electrocatalysts began to emerge. Badreldin et al. synthesized ZnO with oxygen vacancies for HER process [33]. Kim et al. successfully grew VO2 on Ni foam for oxygen evolution reaction (OER) [34]. She et al. successfully improved the HER performance of the Si plate by loading Mo4O11 nanorods at 1400 ℃ [35]. All these works indicate the great potential of TMOs materials for water decomposition. However, the single component electrocatalytic has limited activity. By constructing the coupling interface between different components, the electron transfer can be enhanced, and the conductivity of heterostructures and the density of active sites regulated. Along this line of thought, Luo et al. designed a high-performance electrocatalyst with hierarchical MoS2-MoO3-X/Ni3S2 structure. Abundant MoS2 active sites and MoO3-X's strong adsorption on water formed a synergistic effect to boost HER activity [36-38]. Thus, it is feasible to construct such an interface between TMOs and TMDs to improve the electrocatalytic performance. But so far, the process of building heterogeneous interfaces between TMO and TMD remains complex. In a typical process, loading each component often requires the addition of different raw materials and different synthesis methods, resulting in a long preparation period and more energy consumption.
In this paper, a hierarchical (Mo4O11-MoS2-VO2) electrocatalyst is successfully anchored on carbon cloth by hydrothermal deposition and post annealing strategy. The crystal structure and elemental analysis show that the optimized sample has TMOs-TMDs-TMOs tertiary structure. The morphology and catalytic activity of the electrode can be effectively adjusted by changing the addition of Mo. The optimized Mo-0.15-60 catalyst shows excellent HER activity and stability in acidic media, which is superior to most of the non-noble metal electrocatalysts anchored on carbon cloth reported to date. In 0.5 mol/L H2SO4, this electrode needs overpotential of only 43 mV to achieve 10 mA/cm2 with a Tafel slope of 37 mV/dec and maintains its catalytic activity for at least 36 h. Finally, the interfacial coupling mechanism of the electrocatalyst is discussed. This work serves as a strategy for constructing a novel hierarchical non-noble metal electrocatalyst.
Non-noble metal electrocatalyst with hierarchical sea urchin-like structure is successfully anchored on carbon cloth, and explore the ways to optimize HER performance. As shown in Fig. 1, conductive carbon cloth provides the prerequisite for the preparation of electrocatalytic electrode. The electrocatalyst is synthesized in the first step with a double-layer structure of grain-like V2O3 and MoS2 microspheres. On this basis, the material is annealed to reconstruct its surface morphology, and antenna-like Mo4O11 nanorods are grown on MoS2 microspheres, and V2O3 is also converted into VO2. Finally, a Mo4O11−MoS2-VO2 hierarchical structure is formed, marked as Mo-0.15-60.
The morphology of different samples is characterized by scanning electron microscopy (SEM). Fig. 2a shows grain-like V2O3 (Mo-0) is anchored on carbon cloth. This is quite different from the smooth bare commercial carbon cloth (Fig. S1 in Supporting information). Morphology of Mo-0–60 is described in Fig. 2b. Comparing Fig. 2a to Fig. 2b, the morphology of Mo-0 does not change significantly after annealing. To study the effect of Mo concentration on sample morphology during hydrothermal deposition, multiple samples are prepared by adding a gradient of 0.05 g (NH4)6Mo7O24·4H2O. As shown in Fig. S2a (Supporting information), microspheres formed by the aggregation of MoS2 nanosheets are randomly distributed on the surface of Mo-0.05. The spatial relationship between V2O3 and MoS2 microspheres is clear: MoS2 microsphere grows on the grain-like V2O3. With the increase addition of (NH4)6Mo7O24·4H2O, V2O3 is gradually wrapped by MoS2 microspheres, while with the further increase addition of (NH4)6Mo7O24·4H2O, the characteristic of microspheres on the surface gradually disappears and tended to be flat, as shown in Figs. S2b-e (Supporting information).

After annealing, the surface morphology of the above samples is obviously changing. Specifically, as shown in Figs. S2f and g (Supporting information), many antenna-like Mo4O11 grow on MoS2 microspheres, forming unique sea urchin-like structures. However, as shown in Figs. S2h-j (Supporting information), with the further addition of Mo source, the annealed sample no longer forms sea urchin-like structure, and the surface morphology changes from dense nanorod to sparse bulk. This is because the excessive addition of Mo source thickens the MoS2 nanosheets layer wrapped on surface to form dense structure. This structure severely obstructs the sublimation path of the internal materials, so only in a few areas with thin or cracked surface can the sediments overdeposit and form massive structures. In particular, Fig. 2c shows the SEM image of Mo-0.15, and shows many microspheres on the surface. The insert reveals more details of a microsphere: Gaps between adjacent nanosheets are blocked. The SEM image of Mo-0.15-60 is given in Fig. 2d. Many antenna-like Mo4O11 nanorods covers uniformly on the surface of MoS2 microspheres. These rods are approximately 50 nm wide and up to 1000 nm long. The insert shows that after annealing, the gaps between adjacent nanosheets are opened because the components blocking the gaps before are partially sublimated. As a control, pure MoS2 is prepared, and illustrated in Fig. 2e. After annealing, morphology of MoS2-60 does not vary significantly (Fig. 2f). The energy dispersive X-ray spectroscopy (EDS) mapping in Fig. 2g shows the element distribution of Mo-0.15-60. Mo and S with a large concentration are evenly distributed. Moreover, sparse mapping of V and O indicates its low content. The specific ratio of elements is shown in Fig. S3 and Table S1 (Supporting information).
Using transmission electron microscopy (TEM) to characterize the structure of Mo-0.15-60. Fig. 3a clearly shows that MoS2 microspheres are formed by aggregation of nanosheets. As shown in Fig. 3b, the lattice fringes orientation of nanosheets is disorderly which means lower crystallinity. In contrast, the lattice fringes of antenna-like nanorods have uniform orientation, means higher crystallinity. Selected area electron diffraction (SAED) pattern of Mo-0.15-60 is illustrated in the inset of Fig. 3b. The diffraction pattern is formed by two sets of patterns, with the matrix pattern attributes to the antenna-like Mo4O11 and the polycrystalline diffraction ring attributes to the MoS2 nanosheets. Bright spots in yellow dotted circles well matching to (311) and (311) planes of Mo4O11, while the orange circles represent the (100) and (110) planes of MoS2 [39]. In addition, in order to clarify the independence of the two diffraction patterns, Fourier transform (FT) is performed on TEM image of Mo4O11 nanorods and MoS2 nanosheets respectively. Fig. 3c displays the results. The matrix pattern and polycrystalline diffraction ring obtain by the FT are consistent with the SAED results. EDS mapping of nanosheets is shown in Fig. 3d. High concentrations of Mo and S and low concentrations of V are evenly distributed in the nanosheets. The presence of O comes from the hydrate during hydrothermal deposition. Fig. 3e shows the structure of an individual Mo4O11 nanorod, and the HRTEM image in Fig. 3f exhibits the lattice spacing of 0.375 nm, corresponding to the (311) plane of Mo4O11. To determine the coupling between Mo4O11 nanorods and MoS2 nanosheets, we analyze the HRTEM image of the coupling interface, as shown in Fig. 3g. The interface coupling between the (311) plane of Mo4O11 and the (002) plane of MoS2 was the key to improving electrocatalytic performance. Fig. 3h shows the high concentrations of O and Mo show the main components of Mo4O11, while S and V elements come from the annealing environment.

XRD patterns in Fig. 4a show that the diffraction peaks at 13.8°, 33.2° and 58.8° correspond to the (002) (100) (110) planes of MoS2 (PDF #75-1539) for Mo-0.15. The wider peaks of MoS2 indicate its lower crystallinity, which is consistent with the TEM observation. The peak at 27.2° comes from the carbon cloth substrate. Comparing XRD patterns of multiple Mo-X samples, the diffraction peaks of V2O3 are found to gradually weaken with the increase of the coating thickness of MoS2 nanosheets, in agreement with SEM result. In XRD pattern of Mo-0.15-60, the peaks of 22.1°, 25.8° and 53.6° match with the (211) (601) (223) planes of Mo4O11, indicating the successful synthesis of Mo4O11 (Fig. 4b). Furthermore, the XRD characterization of Mo-0 and Mo-0-60 is carried out, as shown in Fig. 4c. Peaks at 36.5°, 41.7°, 54.7° and 65.8° correspond to (110) (113) (116) and (300) planes of V2O3 (PDF #85-1403). Peaks at 27.7°, 40° and 55.5° of Mo-0-60 corresponds to the (110), (200) and (211) planes of VO2 (PDF #73-2362). The results show that V2O3 is transformed into VO2 after annealing. Through the above XRD characterization, we prove that the Mo-0.15-60 sample is assembled by grain-like VO2 and sea urchin-like MoS2/Mo4O11 from the perspective of crystal structure.

To obtain the elemental composition and chemical valence information, we characterize Mo-0.15 and Mo-0.15-60 by X-ray photoelectron spectroscopy (XPS). Survey spectra (Fig. S5 in Supporting information) indicate the presence of Mo, S and O in the surface of Mo-0.15 and Mo-0.15-60. No obvious V signal in the survey spectra indicates the low content. Comparing the survey spectra of the two samples, the O 1s spectrum of Mo-0.15-60 is significantly enhanced, which could be attributed to the reconstruction of oxygen-rich Mo4O11 on the surface after annealing. As shown in Fig. 5a, Mo-0.15 dominate doublet is located at 229.22~232.38 eV, which means that Mo4+ is the dominant [40]. The S 2s spectrum at 226.35 eV means the presence of S-Mo bond, proves that MoS2 is the main component on the surface of Mo-0.15. In addition, there are another smaller doublet at the higher binding energy, located at 229.87 and 233.47 eV, corresponding to Mo5+ [41], which come from partial oxidation during hydrothermal deposition process. The spectrum corresponding to Mo6+ can be attributed to the partial oxidation of the sample into MoO3 during hydrothermal deposition [42]. For Mo-0.15-60, the peak of Mo6+ is obviously enhanced, which is consistent with the Mo4O11 on surface. For Mo-0.15, the S 2p spectrum exhibits two contributions, 2p3/2 and 2p1/2, located at respectively 163.18 and 161.98 eV (Fig. 5b, top) [43]. For Mo-0.15-60, (Fig. 5b, bottom) the S 2p spectrum shift ~0.1 eV to lower binding energy. Decreasing binding energy means an increase in electron density, which is conducive to the adsorption of H* and improves the HER activity [44]. In Fig. 5c, the O 1s spectrum contains two peaks, namely, adsorbed oxygen and lattice oxygen [45]. Comparing two samples, the peaks strength of adsorbed oxygen and lattice oxygen in Mo-0.15-60 is obviously improved. The increase of adsorbed oxygen peak is mainly due to the increase of air exposed area causing by the growth of nanorods, and the increase of lattice oxygen peak strength is mainly due to the surface coverage of Mo4O11 nanorods. The spectrum of V 2p (Fig. 5d) clearly shows that it exists in two chemical environments. First obvious doublet, located at 521.68~513.68 eV, is characteristic of V3+, indicates that there may be more unsaturated sulfur atoms, which can act as active sites for hydrogen absorption and desorption [46]. The second one has higher intensity and higher binding energy, located at 524.28~517.08 eV, in agreement with the V4+. It may come from V doping of MoS2. The V signal of Mo-0.15-60 is obviously weakened, which is obviously related to the cover of Mo4O11 nanorods on the surface.

The change on HER electrocatalytic activity for the effect of sea urchin-like structure anchoring are evaluated by comparison of for Mo-X, Mo-X-60 and pure MoS2 samples. The scanning rate of all LSV tests in the experiment is 1 mV/s, and CV/LSV tests are iR-corrected. As expected, Pt foil shows the best HER performance, LSV curves are given in Figs. 6a and b. The overpotential required to reach current densities of 10, 50 and 100 mA/cm2 are only 16, 35 and 40 mV, respectively (Fig. 6b). Among the samples we prepared, Mo-0.15-60 shows the best electrocatalytic performance, reaching current densities of 10, 50 and 100 mA/cm2 only at overpotential of 43, 70 and 89 mV. The onset potential is just 35 mV, the geometric current density of the electrocatalyst increase rapidly, reflecting its rapid dynamic process. The overpotentials of Mo-0, Mo-0–60, Mo-0.15, MoS2 and MoS2–60 are 125, 89, 137, 209 and 220 mV at 10 mA/cm2, respectively. More LSV curves with different Mo additions are shown in Fig. S6 (Supporting information). For Mo-X, annealing has a positive effect on the improvement of electrocatalytic performance, as shown in Figs. S6c and S6d. However, electrocatalytic performance of MoS2 decreases after annealing. The specific overpotential of various catalysts are shown in Table S2 (Supporting information). In order to explore the interfacial kinetic behaviors of these samples. We get the polarization plot into Tafel plot (Fig. 6c). We use the Tafel equation (η = b logj + a, where j is the current density and b is the Tafel slope) to fit the above curves. For Pt, Mo-0, Mo-0–60, Mo-0.15, Mo-0.15-60, MoS2 and MoS2–60, the Tafel slops were 30, 93, 80, 103, 37, 72 and 97 mV/dec. The Tafel slope of Mo-0.15-60 decreases obviously due to the change of surface morphology, the enhancement of intrinsic activity and the expansion of electrochemical active sites after annealing.

In acidic electrolytes, it is generally believed that HER mechanism involves the following three steps (Eqs. 1–3) [47]:
|
|
(1) |
|
|
(2) |
|
|
(3) |
where * is the hydrogen adsorption site in the equation. Two reaction steps form a complete HER process. One is through the Volmer Tafel step and the other is through the Volmer Heyrovsky step. Tafel slopes are 120, 30 and 40 mV/dec respectively, indicating that the rate-determining steps in HER mechanism are Volmer, Tafel and Heyrovsky step. Therefore, HER reaction of Mo-0.15 (103 mV/dec) and Mo-0.15-60 (37 mV/dec) follows Volmer-Heyrovsky pathway [48]. Therefore, we can infer that the reconstruction of the surface morphology greatly boosts the electrocatalytic activity of the materials and confirms the positive significance of the annealing process. In order to investigate the charge transfer process at the electrode/electrolyte interface of each sample, Nyquist plots in the frequency range of 10 kHz-0.01 Hz were obtained by EIS at 50 mV (vs. RHE). As shown in Fig. 6d, the equivalent circuit model is inserted into the diagram. The charge transfer resistance (Rct) appears as the diameter of a semicircular arc, reflecting the key parameters of Faraday dynamics at the reaction interface. It is found that the Rct of Mo-0.15-60 (1.05 Ω) is lower than that of MoS2–60 (53.85 Ω), indicates that the electron transfer of Mo-0.15-60 is very easy during HER process. This implies that the intrinsic conductivity of the material is enhanced after annealing. This extremely low Rct effectively reduces energy loss in practical applications. The ECSA of the samples can be evaluated by Cdl [37, 38]. CV is carried out at different scanning rates (20–120 mV/s) in the non-faradaic range (0–0.2 V vs. RHE). We take the current density at 0.15 V as the ordinate and the scanning rate as the abscissa to fabricate the function plot. The slope is calculated by linear fitting reflects the Cdl. According to Fig. 6e, the Cdl of Mo-0, Mo-0–60, Mo-0.15, Mo-0.15-60, MoS2 and MoS2–60 are 11, 27, 97, 157, 46 and 34 mF/cm2, respectively. This means that not only vanadium doping, but also the surface structure reconstruction caused by annealing also greatly expands the number of active sites of HER. Durability of electrocatalyst is one of the important indicators to evaluate whether it is valuable for industrial practical application. We conduct two tests on Mo-0.15-60: (1) In the range of 0–100 mV (vs. RHE), 1000 cycles of CV test are carried out under the scanning rate of 100 mV/s. The change of overpotential before and after 1000 cycles is negligible at the current density of 10 mA/cm2 (Fig. 6f). The inset image is a digital photograph of the electrode in the process of hydrogen evolution. (2) Long-term chronopotentiometry is used to test the material's stability at 10 mA/cm2. During the 36-h test, Mo-0.15-60 has almost no potential fluctuation, as shown in Fig. 6g. These tests prove that Mo-0.15-60 has an excellent robustness in the process of HER. In general, Mo-0.15-60 exhibits the best HER performance. The comparison of the overpotential and Tafel slope of this work with other works are shown in Fig. 6h.
In addition, we investigate the mechanism of the electrocatalyst in this work. Firstly, V2O3 has better electrocatalytic intrinsic activity and higher conductivity than MoS2. However, SEM surface morphology and Cdl measurements show that less electrochemical active sites restrict its electrocatalytic performance. Secondly, the electrocatalytic activity is enhanced by anchoring MoS2 microspheres on the surface of V2O3. More importantly, the gaps between MoS2 microspheres do not completely wrap the V2O3, so that V2O3 can participate in the electrocatalytic process. Finally, after annealing, not only the V3O2 is converted to VO2 with better electrocatalytic performance, but also Mo4O11 nanorods are grown on MoS2 microspheres. Annealing treatment opens the gap between MoS2 nanosheets in microspheres and strengthened the interfacial contact between electrode and electrolyte. More than that, active sites are not only distributed on the surface of VO2, but also on the edge and the basal plane of V-doped MoS2 and the surface of Mo4O11 nanorods, which meant that this sea urchin-like hierarchical structure greatly expand the number of electrocatalytic active sites. Different components form self-supported coupling interfaces with low contact resistance, ensuring efficient transport and redistribution of electrons from conductive carbon cloth to VO2, MoS2 nanosheets and Mo4O11 antenna-like nanorods to the corresponding active electrocatalytic sites. The specific electron redistribution path and the main HER participating sites of Mo-0.15-60 are given in Fig. 7.

In summary, through rational design and efficient synthesis, we demonstrate an efficient non-noble metal sea urchin-like electrocatalyst on carbon cloth for HER. The optimized Mo-0.15-60 electrode has excellent activity and stability for HER in acidic media, which is superior to other advanced non-noble metal catalysts anchored on carbon cloth in the literature. In 0.5 mol/L H2SO4, this electrode needs overpotential of only 43 mV to achieve 10 mA/cm2 with a Tafel slope of 37 mV/dec and maintains its catalytic activity for at least 36 h. The concentration of Mo ion has an important effect on morphology reconstruction, intrinsic activity, and the number of catalytic sites. Such fascinating catalytic performances are mainly attributed to the different components formed self-supported coupling interfaces with low contact resistance, ensuring efficient electron transport and redistribution. This strategy to expand the electrocatalytic active site by utilizing the sublimation characteristics of the substance itself can provide reference for colleagues who are engaged in the research of high-performance electrocatalysts for HER and provide more possibilities to explore more excellent electrocatalysts without noble metals.
The authors declare that they have no known competing financial interests or personal relationships that could have appeared to influence the work reported in this paper.
This work was supported by the National Natural Science Foundation of China (No. 51802177), Independent Cultivation Program of Innovation Team of Ji′nan City (No. 2019GXRC011), Introduction and Cultivation Plan of Young Innovative Talents in Colleges and Universities of Shandong Province, Shandong Provincial Natural Science Foundation (No. ZR2020ME052). All the authors contributed to preparation, characterization and analysis structure and performance of materials. All the authors discussed the results and commented on the manuscript.
Supplementary material associated with this article can be found, in the online version, at doi:
L. Han, J. Xu, Y. Huang, W. Dong, X. Jia, Chin. Chem. Lett. 32 (2021) 2263–2268. doi: 10.1016/j.cclet.2020.12.015
C. Wang, L. Jin, H. Shang, et al., Chin. Chem. Lett. 32 (2021) 2108–2116. doi: 10.1016/j.cclet.2020.11.051
S. Li, J. Sun, J. Guan, Chin. J. Catal. 42 (2021) 511–556. doi: 10.1016/S1872-2067(20)63693-2
G. Zhao, W. Ma, X. Wang, et al., Adv. Powder. Mater. 1 (2022) 100008. doi: 10.1016/j.apmate.2021.09.008
K. Chen, S. Deng, Y. Lu, et al., Chin. Chem. Lett. 32 (2021) 765–769. doi: 10.1016/j.cclet.2020.05.030
X. Fu, R. Shi, S. Jiao, M. Li, Q. Li, J. Energy Chem. 70 (2022) 129–153. doi: 10.1016/j.jechem.2022.02.010
A. Pirkarami, S. Rasouli, E. Ghasemi, Appl. Catal. B: Environ. 241 (2019) 28–40. doi: 10.1016/j.apcatb.2018.09.021
T. Gu, R. Sa, L. Zhang, D.S. Li, R. Wang, Appl. Catal. B: Environ. 296 (2021) 120360. doi: 10.1016/j.apcatb.2021.120360
A.R. Zeradjanin, P. Narangoda, I. Spanos, J. Masa, R. Schlögl, Electrochim. Acta 388 (2021) 138583. doi: 10.1016/j.electacta.2021.138583
M. malakzadeh, J.B. Raoof, A. Ghafarnejad, R. Ojani, J. Electroanal. Chem. 900 (2021) 115716. doi: 10.1016/j.jelechem.2021.115716
Y. Wei, X. Zhang, Z. Wang, et al., Chin. Chem. Lett. 32 (2021) 119–124. doi: 10.1016/j.cclet.2020.10.046
Q. Mao, S. Jiao, K. Ren, et al., Chem. Eng. J. 426 (2021) 131227. doi: 10.1016/j.cej.2021.131227
J. Zhu, L. Cai, X. Yin, et al., ACS Nano 14 (2020) 5600–5608. doi: 10.1021/acsnano.9b10048
Y. Wang, Y. Ding, C. Zhang, et al., Rare Metals 40 (2021) 2785–2792. doi: 10.1007/s12598-021-01765-6
Y. Wang, R. Li, H. Li, et al., Rare Metals 40 (2021) 1040–1047. doi: 10.1007/s12598-020-01665-1
Y. Lin, H. Wang, C.K. Peng, et al., Small 16 (2020) 2002426. doi: 10.1002/smll.202002426
H. Wang, J. Li, K. Li, et al., Chem. Soc. Rev. 50 (2021) 1354–1390. doi: 10.1039/D0CS00415D
Z. Chen, D. Cummins, B.N. Reinecke, et al., Nano Lett. 11 (2011) 4168–4175. doi: 10.1021/nl2020476
B. Yang, J. Xu, D. Bin, et al., Appl. Catal. B: Environ. 283 (2021) 119583. doi: 10.1016/j.apcatb.2020.119583
K. Deng, T. Ren, Y. Xu, et al., J. Mater. Chem. A 8 (2020) 8927–8933. doi: 10.1039/D0TA02537B
B. Hinnemann, P.G. Moses, J. Bonde, et al., J. Am. Chem. Soc. 127 (2005) 5308–5309. doi: 10.1021/ja0504690
W. Jia, X. Wang, Z. Lu, et al., J. Alloys Compd. 885 (2021) 160990. doi: 10.1016/j.jallcom.2021.160990
J. Sun, X. Meng, ACS Appl, Nano Mater 4 (2021) 11413–11427.
Z. Yu, C. Wang, S. Guo, et al., Electrochim. Acta 403 (2022) 139683. doi: 10.1016/j.electacta.2021.139683
Y. Zheng, J. Rong, Y. Zhu, et al., Appl. Surf. Sci. 574 (2022) 151725. doi: 10.1016/j.apsusc.2021.151725
W. Zhang, H. Yu, D. Tang, et al., Int. J. Hydrogen Energ. 46 (2021) 13936–13945. doi: 10.1016/j.ijhydene.2021.01.188
S. Song, Y. Li, Y. Shi, Y. Xu, Y. Niu, J. Electroanal. Chem. (2021) 115986.
L. Jiang, Y.J. Zhang, X.H. Luo, et al., Chem. Eng. J. 425 (2021) 130611. doi: 10.1016/j.cej.2021.130611
X. Huang, H. Xu, D. Cao, D. Cheng, Nano Energy 78 (2020) 105253. doi: 10.1016/j.nanoen.2020.105253
W. Xu, S. Li, G.H. Ryu, et al., Chem. Mater. 32 (2020) 8243–8256. doi: 10.1021/acs.chemmater.0c01923
J. Chen, G. Liu, Y.Z. Zhu, et al., J. Am. Chem. Soc. 142 (2020) 7161–7167. doi: 10.1021/jacs.0c01649
P. Wang, B. Wang, A.C.S. Appl, Mater. Interfaces 13 (2021) 59593–59617. doi: 10.1021/acsami.1c17448
A. Badreldin, A. Abdel-Wahab, P.B. Balbuena, ACS Appl. Energy Mater. 3 (2020) 10590–10599. doi: 10.1021/acsaem.0c01642
T.V.M. Sreekanth, M. Tamilselvan, K. Yoo, J. Kim, Appl. Surf. Sci. 570 (2021) 151119. doi: 10.1016/j.apsusc.2021.151119
G. She, S. Zhang, S. Li, et al., J. Photoch. Photobio. A 355 (2018) 55–59. doi: 10.1016/j.jphotochem.2017.11.005
M. Luo, S. Liu, W. Zhu, et al., Chem. Eng. J. 428 (2022) 131055. doi: 10.1016/j.cej.2021.131055
Y. Xing, G. Zhao, S. Qiu, et al., J. Colloid Interf. Sci. 611 (2022) 336–345. doi: 10.1016/j.jcis.2021.12.100
Z. Zhang, Y. Wu, D. Zhang, Int. J. Hydrogen Energ. 47 (2022) 1425–1434. doi: 10.1016/j.ijhydene.2021.10.150
Q. Su, B. Wang, C. Mu, et al., J. Alloy. Compd. 888 (2021) 161487. doi: 10.1016/j.jallcom.2021.161487
R. Mardosaite, E. Valatka, Int. J. Electrochem. Sci. 14 (2018) 387–401.
L. Duan, X. Li, Synthetic Met. 272 (2021) 116672. doi: 10.1016/j.synthmet.2020.116672
H. Dai, A. Rath, Y.S. Hearn, S.J. Pennycook, D.H.C. Chua, J. Phys. Chem. Lett. 9 (2018) 7185–7191. doi: 10.1021/acs.jpclett.8b03437
J. Ge, D. Zhang, J. Jin, et al., Mater. Today Energy 22 (2021) 100854. doi: 10.1016/j.mtener.2021.100854
Y. Zheng, J. Rong, J. Xu, Appl. Surf. Sci. 563 (2021) 150385. doi: 10.1016/j.apsusc.2021.150385
M. Kim, H. Seok, N. Clament Sagaya Selvam, et al., J. Power Sources 493 (2021) 229688. doi: 10.1016/j.jpowsour.2021.229688
M. Li, B. Cai, R. Tian, et al., Chem. Eng. J. 409 (2021) 128158. doi: 10.1016/j.cej.2020.128158
X. Xu, W. Xu, L. Zhang, et al., Sep. Purif. Technol. 278 (2021) 119569. doi: 10.1016/j.seppur.2021.119569
J. Chen, Q. Jin, Y. Li, et al., ACS Appl. Mater. Interfaces 11 (2019) 38771–38778. doi: 10.1021/acsami.9b13657

Figure 1 Schematic of preparing Mo-0.15-60 electrode by the hydrothermal deposition and post-annealing process.

Figure 2 SEM images of (a) Mo-0, inset: digital photo of grain. (b) Mo-0-60. (c) Mo-0.15, inset: locally magnified image, blocking state circled by yellow dotted curves. (d) Mo-0.15-60, inset: locally magnified image, opening state circled with orange dotted curves, an antenna-like nanorod is marked with green dotted curve. (e) MoS2. (f) MoS2-60. (g) SEM images of Mo-0.15-60 and mapping.

Figure 3 TEM images of (a) MoS2 nanosheets agglomeration. (b) MoS2 and Mo4O11, inset: SAED pattern. (c) TEM and FT images of nanorods (upper) and nanosheets (bottom). (d) The EDS mapping of MoS2 nanosheets. (e, f) HRTEM images of an independent Mo4O11 nanorod. (g) Coupling interfaces between MoS2 and Mo4O11. (h) The EDS mapping of a Mo4O11 nanorod.

Figure 4 XRD of (a) Mo-0.05 to Mo-0.3, (b) Mo-0.05-60 to Mo-0.3-60, (c) Mo-0 and Mo-0-60.

Figure 5 XPS spectra of Mo-0.15 and Mo-0.15-60, including the (a) Mo 3d, (b) S 2p, (c) O 1s and (d) V 2p.

Figure 6 (a) Polarization curves of different samples. (b) Overpotential required at a current density of 10 mA/cm2. (c) Corresponding Tafel slope. (d) Nyquist plots; inset: equivalent circuit in HER process. (e) Plots of the capacitive currents as a function of scaning rate. (f) Polarization curves of Mo-0.15-60 after 1000 cycles. Inset: digital photo of the working electrode. (g) i-t plot of Mo-0.15-60. (h) Comparison of Mo-0.15-60 and other works.

 扫一扫看文章

扫一扫关注我们
 DownLoad:
 下载:
下载:

 下载:
下载: