Citation:
Kehua Xu, Jingjing Zhang, Wenrui Ma, Hui Huang, Shiqiang Yan, Li Wang, Weijia Zhang. A facile cell culture device for studying nuclear and mitochondrial response of endothelial cells to hydrostatic pressure[J]. Chinese Chemical Letters,
2023, 34(3): 107486.
doi:
10.1016/j.cclet.2022.04.084
A facile cell culture device for studying nuclear and mitochondrial response of endothelial cells to hydrostatic pressure
English
A facile cell culture device for studying nuclear and mitochondrial response of endothelial cells to hydrostatic pressure
Institutes of Biomedical Sciences and Shanghai Institute of Infectious Disease and Biosecurity, Shanghai Medical College, Fudan University, Shanghai 200032, China
b.
Department of Cardiac Surgery and Shanghai Institute of Cardiovascular Diseases, Zhongshan Hospital, Fudan University, Shanghai 200032, China
c.
The State Key Laboratory of Molecular Engineering of Polymers, Fudan University, Shanghai 200438, China
* Corresponding author at: Institutes of Biomedical Sciences and Shanghai Institute of Infectious Disease and Biosecurity
Received Date:
19 February 2022 Accepted Date:
29 April 2022 Revised Date:
01 April 2022 Available Online:
15 March 2023
Abstract:
There is no clear consensus regarding how cells respond to hydrostatic pressure. This is largely attributable to the high heterogeneity among cell types and the diverse custom-made devices used in previous studies. The aim of this work was to develop a facile device that could mimic various pressure environments and then delineate the cellular response to pressure stimulus. The device described here achieved both stable and periodic pressurization without oxygen deprivation. The biological utility of the device was assessed using human umbilical vein endothelial cells. We found more stereoscopic nuclear morphology and re-distribution of lamin A/C under high hydrostatic pressure compared to control cells. Mass spectrometry-based proteomics analysis showed significant changes in mitochondria-related pathways. Western blot analysis confirmed that high hydrostatic pressure induced a tendency toward mitochondrial fusion. Increased mitochondrial activity was observed as well. In conclusion, this device can be readily applied in biological research and extend our understanding of cellular mechano-sensation and the associated changes in mitochondrial behaviors.
Organs such as blood vessels, cranial cavity, and intestine maintain their activities in diverse stress environments. Cells withstand dynamic pressure and show different responses under physiological and pathological conditions. The underlying mechanical and biochemical events involved in the cell response are poorly understood. Disease usually occurs when the abnormal mechanical environment is beyond the range of cell regulation [1]. Cellular response to shear stress and strain stress has been extensively studied, while the effect of hydrostatic pressure is still at the early stage of exploration [2-4]. In-depth characterization of the cellular responses under hydrostatic pressure is essential for better understanding of pathologies such as hypertension and osteoarthritis [5, 6]. In vitro research on the impact of hydrostatic pressure stimulus can avoid interference from other chemical and mechanical factors. An increasing number of customized devices in vitro have been developed and used as pressure chamber bioreactors, which typically apply constant pressure to cells [7-13]. Considering the varying in vivo pressure environment, some studies have placed cell culture vessels in a large cavity and periodically changed the pressure in the cavity to produce a cyclic pressure environment around the cells [14]. However, due to the large volume of the device, the pressure alternations in the cavity was not always faithfully conducted to the culture vessel. Moreover, higher switching frequencies might further amplify the delay effect. The large volume of the cavity also limited high-throughput experiments. To increase portability and improve pressure conduction to the cultured cells, we designed a small facile cell culture device that could be used to produce either constant or cyclic pressure.
We evaluated the biological application of this device using human umbilical vein endothelial cells (HUVEC). Endothelial cells form a barrier between the intravascular fluid and the vessel wall, and are constantly subjected to various mechanical stresses. Blood pressure is considered to be a key stimulus that modulates the morphology and functionality of endothelial cells, such as migration, proliferation, apoptosis, angiogenesis, and inflammation [15]. The responses of cells to hydrostatic pressure in vitro vary with the cell types, magnitude of the force, and mode in which it is exerted [10, 11, 16-18]. It is now commonly accepted that the nucleus itself can sense mechanical stimulus. Extracellular forces are transmitted to the nucleus causing nuclear deformation following changes of cell behaviors [19, 20]. In previous studies, endothelial cells that were exposed to high pressure exhibited cell elongation with no predominant orientation [16, 21]. In view of these adaptive responses, we speculate that the shape of the cell nucleus will alter in response to the pressurized stimulus. Therefore, we assessed nuclear morphology under high hydrostatic pressure in this device. Mass spectrometry-based proteomics analysis was performed to investigate the downstream effects of pressure stimulus. We also assessed the mitochondrial activity under the same experimental condition.
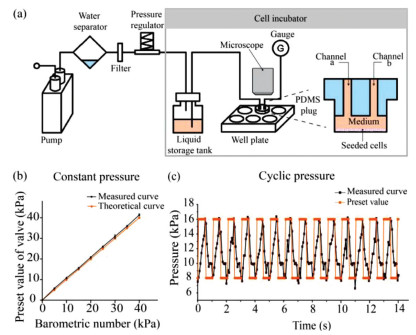
In this device, each well of the cell culture plate was equipped with a customized polydimethylsiloxane (PDMS) plug to form a relatively confined space (Fig. 1a, Figs. S1a and b in Supporting information). The gas from the incubator was compressed by a pump, dried by a water separator, sterilized by a filter, and the pressure was adjusted to the target value by a proportional valve, which served as a pressure regulator. Automatic adjustment of the valve opening was controlled by a microcomputer. The target pressure level was preprogramed in the code of the microcomputer prior to actuation. To achieve periodical pressure, the maximal and minimal pressure were both set in advance along with the period. The code is provided in the supporting information iv. The compressed gas was applied to the cell culture medium in a liquid storage tank through the short tube and then the pressure was applied to the cells in the six-well plate (Fig. 1a).
Figure 1
Figure 1.
Design and functional verification of the device used in hydrostatic pressure experiment. (a) Schematic illustration of the experimental device composed of pump, water separator, filter, pressure regulator, liquid storage tank, PDMS plug, well plate, and gauge. (b) The barometric number was slightly lower than the preset value of the valve. (c) When the maximum and minimum pressure values (red) are preset, the device can implement a pressure switch (black) on cells at a specified frequency.
A gas gauge was employed to visualize the pressure exerted on the cells. The value can both be seen on the gauge and be monitored through the feedback circuit of the proportional valve. To characterize the control property of the device, the barometric number was compared with the preset value of the valve. The barometric number of the gauge was slightly lower than the preset value due to the resistance of the filter and imperfect air-tightness (Fig. 1b); however, the barometric number can be stable for at least 24 h. This means that the preset value of the pressure-regulating valve should be slightly higher to achieve the target pressure on the cells. The device can also expose the cells to cyclic pressure. When the maximal and minimal pressure were preset as 8 kPa and 16 kPa, respectively, the real-time pressure fed back by the valve suggested that the actual pressure varied between upper and lower bounds at the desired frequency (Fig. 1c). The device has been demonstrated to withstand constant pressure up to 50 kPa and cyclic pressure within 20 kPa. The transparent PDMS plug allowed observation of the cells during experiment, which provided an opportunity for real-time visualization of the cellular response under stimulus. Bright field images of the cells during the experiment were captured every 30 min for 24 h (5000× speed movie clip in Movie S1 in Supporting information).
The blue cap of the liquid storage tank (Fig. S1a) has three holes: one for the inlet of compressed gas with a short tube, and two for liquid communication with long tubes. A tee joint can be used to extend branches of the liquid pipeline. There can be up to three branches with one tank in consideration of the pressure stabilization of the system. As shown in Fig. S1a, this kind of installation can realize the pressure stimulus on three wells in a six-well plate at the same time, with the other three wells serving as controls. Different wells of the six-well plate can also be connected to separate proportional valves and liquid storage tanks to form independent branches to allow for simultaneous application of different magnitudes and frequencies of hydrostatic pressure to cells in each well.
The main part of the device, the six-well plate, is commercially available. Its small chamber allows for easy switching of pressure within a short response time. The PDMS plug equipped on the plate can be easily fabricated, and its transparency allows for real-time observation. The application of the proportional valve simplifies the structure of this device. All components are easily acquirable and do not require precision assembly. During experiments, only the liquid storage tank and the well plate are placed in the incubator; thus the electronic components are not exposed to moisture and the consequent risk of corrosion. By adjusting the hardness of the PDMS substrate in the six-well plate, the device can also be used to explore the mechano-sensation under complex interplay of hydrostatic pressure and the mechanical properties of the substrate. The cell culture vessel can also be replaced to meet the requirements of different applications by only adjusting the size of the PDMS plug.
To evaluate the feasibility of the device, HUVEC were cultured in a six-well plate. Following the formation of a confluent monolayer under static conditions, the pump was initiated and the pressure was steadily increased to 40 kPa in 1 min and then maintained at that level for 24 h. It is commonly accepted that mechanical stimulus can be conducted to the nucleus through the cytoskeleton. The nucleus shape alters in response to the stress environment due to altered chromatin organization, phosphorylation of nuclear envelope proteins, and conformational changes [22-24]. To investigate the potential effect of hydrostatic pressure on nucleus, we compared the morphology of the nuclei in the experimental and control groups through immuno-staining (Fig. 2a for 3D reconstruction, Fig. 2b for maximum projection). The average maximum projected area of the nuclei in the experimental group was significantly smaller than that in the control group (Fig. 2b, P < 0.05). Moreover, the nuclei displayed an extension in the z-direction (Fig. 2a, P < 0.0001). These results indicated the nuclei were prone to be more stereoscopic in response to high pressure stimulus. In a recent study, exposure of osteoblasts to pulsating fluid flow was found to reduce the nucleus volume and the nucleus was not as round as that in the control group [25]. The differences in the nucleus deformation may be attributed to the different nature of mechanical force.
Figure 2
Figure 2.
Nuclear response after 24 h exposure to high pressure. (a) The samples underwent z axis scanning and were photographed every 0.5 µm following 3D reconstruction. The height of each nucleus was estimated through the number of slides with trace of the nucleus. The statistical values of 33 cells of the pressurized group and 32 of the control group implied increased nuclear height after exposure to pressure (t test, P < 0.0001). Scale bar: 20 µm. (b) The nuclear (blue) area was assessed in both the experimental group and the control group using ImageJ. Decreased maximum projected area of nuclei was observed in pressurized condition (n = 10, t test, P = 0.0078). Scale bar: 50 µm. (c) In static condition, lamin A/C was spread diffusely throughout the nuclei while the high pressure resulted in aggregation of lamin A/C on the edge of the nuclei. Scale bar: 50 µm. Ratio of fluorescence intensity between the edge of a nucleus and mean level of that nucleus showed an increase after pressure stimulus (n = 20, P = 0.0002).
As nuclear membrane-localized lamin A/C is a major contributor to nuclear mechanics [26], we further compared the distribution of lamin A/C between the two groups using fluorescence. We observed greater density of lamin A/C on the edge of nucleus under pressure stimulus (Fig. 2c). Several studies have emphasized the essential role of lamin A/C in determining the stiffness of nuclei [27-29]. Re-distribution of lamin A/C has been shown to attenuate stretch-induced nuclear deformation [30]. The perinuclear concentration of lamin A/C under pressure stimulus can thus be considered to augment nuclear stiffness avoiding further deformation. Substantial changes in lamin A/C have been demonstrated during cell differentiation, which were verified to modulate the spatio-temporal structural changes of chromatin [31]. However, further study is required to investigate the physical association between lamina A/C and chromatin in mechano-transduction as well as to elucidate the relationship between the deformed nuclei and the chromatin.
To investigate cell behaviors under high hydrostatic pressure, proteomic analysis was performed in both experimental and control groups. Principal component analysis (PCA) and heatmap of the differential proteins showed significant changes in cells subjected to pressure stimulus (Figs. 3a and b). Of the detected proteins, 415 showed significant upregulation and 438 showed significant downregulation (Fig. 3c). The enriched canonical pathways identified by Ingenuity Pathways Analysis (IPA) showed a drastic effect of high hydrostatic pressure on mitochondrial function (Fig. 3d and Fig. S2 in Supporting information). Mitochondria are in a perpetual state of dynamic changes in morphology or shape between fission and fusion to remove damaged mitochondria and facilitate intracellular energy distribution, respectively [32]. MFF recruits DRP1 to mediate fission, and MFN2 and OPA1 are fusion machineries in mammals [33]. The protein expression level of DRP1 was significantly lower in cells exposed to high pressure than in the static control, while the expressions OPA1 were higher. Moreover, there was significantly reduced expression of the pro-apoptotic protein BAX (Fig. 3e).
Figure 3
Figure 3.
Mass spectrometry-based comparative proteomics analysis after 24 h of 40 kPa hydrostatic pressure. (a) Principal component analysis identified significant clustering of groups. (b) Heatmap of protein expression in both pressurized and control groups. (c) Volcano plot showing differentially expressed proteins after 24 h of high hydrostatic pressure over control group. (d) The enriched canonical pathways presented by IPA indicated severely affected mitochondrial function. (e) Differential expression of proteins related to mitochondrial dynamics detected by mass spectrometer (n = 6; DRP1, P = 0.0097; OPA1, P = 0.0043; BAX, P < 0.0001).
We then performed Western blot assay to verify the results of proteomic analysis. High hydrostatic pressure significantly promoted the protein expression of OPA1 and decreased that of DRP1 and BAX (Figs. 4a and b). These results are consistent with the previous experiment, which suggested that pressurized treatment rendered the cells more prone to undergo mitochondrial fusion.
Figure 4
Figure 4.
Mitochondria dynamics under hydrostatic pressure for 24 h. (a) Western blots showing differences in the expressions of mitochondrial-related proteins. (b) Relative expression levels of OPA1, DRP1, and BAX. Mean ± SD values from three repeated experiments are presented. There is significant increase in OPA1 (n = 3, t-test, P = 0.0287) along with decrease in DRP1 (n = 3, t-test, P = 0.003) and BAX (n = 3, t-test, P = 0.0085). (c) The merged images show mitochondria stained by Mito-Tracker (red) and Hoechst-stained nuclei. Scale bar: 50 µm. (d) The average length of branch increased after pressure stimulus (n = 10, P = 0.0252). (e) mRNA expressions of representative genes in the two groups. Compared with the control group, cells exposed to high pressure exhibited elevated mRNA expression of OPA1 (n = 3, P = 0.0038) and decreased mRNA expression of FIS1 (n = 3, P = 0.0362). The mRNA level of pro-apoptosis gene BAX (n = 3, P = 0.0128) was down-regulated and the mRNA level of anti-apoptosis gene BCL2 was up-regulated (n = 3, P = 0.0030). The mRNA expression of endothelial cell marker PECAM-1 was decreased while that of the smooth muscle cell marker ACTA2 (n = 3, P = 0.0005) was increased. The two groups showed similar expression of adhesion related gene CDH5 and other genes associated with mitochondria (MFN, MFN2, DRP1).
We further assessed the morphological changes of the mitochondria visually using Mito-Tracker, which can specifically label the bioactive mitochondria in cells. The network of mitochondria is shown in Fig. 4c. The mean branch length of mitochondria was regarded as a measurement index of mitochondrial dynamics, which was found to be longer after pressure stimulus (Figs. 4c and d). Using q-PCR, we similarly observed increased mRNA expression of OPA1 and decreased expression of FIS1, which mediates mitochondrial fission associated with DRP1 (Fig. 4e).
To determine whether there were other changes in mitochondria besides morphology, we assessed the mitochondrial membrane potential (MMP) using TMRM. The MMP was significantly enhanced after pressure stimulus (Fig. 5a). Moreover, the ROS in the mitochondria was slightly higher (Figs. 5b and c). These results indicated that high pressure upregulates the activity of mitochondria. Meanwhile, a greater percentage of proliferating cells were detected (Fig. 5d), while no differences were detected in terms of cell apoptosis or death (Fig. S3 in Supporting information), which may be due to the elevated expression of anti-apoptosis gene BCL2 and deceased expression of pro-apoptosis gene BAX (Fig. 4e).
Figure 5
Figure 5.
Mitochondria activity and proliferation of cells. (a) The MMP was assessed by TMRM (green) in live cells. Cell nuclei were stained with Hoechst (blue). Representative images from the two groups show higher TMRM florescence of cells under high pressure. Scale bar: 50 µm. (b) ROS production, which specifically targets mitochondria, was labeled by Mitosox (Red). Cell nuclei were stained with Hoechst (blue). Confocal image shows bright spots in the experimental group. Scale bar: 50 µm. (c) Normalized TMRM and Mitosox florescence are presented as mean ± SE. Ten images were randomly chosen in each group. Stimulus of high pressure enhanced MMP (n = 10, P < 0.0001) and ROS production (n = 10, P = 0.0111) in mitochondria. (d) Proliferating cells were labeled by antibody of ki-67, which is not present in resting cells. Compared to control group, a greater percentage of proliferating cells were detected in the experimental group. (n = 3, P = 0.0011).
Mitochondrial dynamics contribute to mitochondrial functions and respond to changes in cell physiology [34]. Mitochondrial fusion allows for content mixing and promotes the formation of a connected, homogeneous network [35]. Highly interconnected mitochondrial network has been reported to respond to some conditions that adversely impact cellular health, which facilitates energy production and promotes cell survival [36, 37]. In the cells under pressure stimulus, with the increased proportion of proliferating cells, mitochondrial activity was enhanced suggested by the elevated MMP. More communication was acquired through mitochondrial fusion. Besides, mitochondrial dynamics are sensitive to alteration of actin cytoskeleton [38], which orients mechano-sensation coordinating with nuclear scaffold. It remains unclear whether or how far mitochondria dynamics are disturbed by the nuclear deformation under pressure stimulus.
Mutation in mitochondrial-related genes such as OPA1 and DRP1 have been reported to be associated with clinical syndromes of the central nervous system and cardiovascular system [39-42]. Therefore, it is plausible that mitochondrial dynamics may serve as a therapeutic target in diseases involving abnormal pressure.
In summary, we propose a device to investigate cellular responses under high hydrostatic pressure and used HUVEC to demonstrate its biological utility. Future studies are required to explore the difference of cellular responses under different pressure curves. The device can further be considered to provide a pressure environment for tissues.
Declaration of competing interest
The authors declare that they have no known competing financial interests or personal relationships that could have appeared to influence the work reported in this paper.
Acknowledgments
This work was supported by grants from the National Key R & D Program of China (No. 2018YFC1005002), the National Natural Science Foundation of China (Nos. 82070482, 81772007, 21734003 and 51927805), the Shanghai Municipal Science and Technology Major Project (No. 2017SHZDZX01), and the Shanghai Municipal Education Commission (Innovation Program No. 2017-01-07-00-07-E00027).
Supplementary materials
Supplementary material associated with this article can be found, in the online version, at doi:10.1016/j.cclet.2022.04.084.
[1]
D. Konukoglu, H. Uzun, Adv. Exp. Med. Biol. 956 (2017) 511–540.
[2]
J. Ando, K. Yamamoto, Antioxid. Redox Signal. 15 (2011) 1389–1403. doi: 10.1089/ars.2010.3361
[3]
Y. Fang, D. Wu, K.G. Birukov, Compr. Physiol. 9 (2019) 873–904.
[4]
C. Souilhol, J. Serbanovic-Canic, M. Fragiadaki, et al., Nat. Rev. Cardiol. 17 (2020) 52–63. doi: 10.1038/s41569-019-0239-5
[5]
Y. Yamashiro, H. Yanagisawa, Clin. Sci. 134 (2020) 2399–2418. doi: 10.1042/CS20190488
J.R. Vanstone, A.M. Smith, S. Mcbride, et al., Eur. J. Hum. Genet. 24 (2016) 1084–1088. doi: 10.1038/ejhg.2015.243
Figure 1
Design and functional verification of the device used in hydrostatic pressure experiment. (a) Schematic illustration of the experimental device composed of pump, water separator, filter, pressure regulator, liquid storage tank, PDMS plug, well plate, and gauge. (b) The barometric number was slightly lower than the preset value of the valve. (c) When the maximum and minimum pressure values (red) are preset, the device can implement a pressure switch (black) on cells at a specified frequency.
Figure 2
Nuclear response after 24 h exposure to high pressure. (a) The samples underwent z axis scanning and were photographed every 0.5 µm following 3D reconstruction. The height of each nucleus was estimated through the number of slides with trace of the nucleus. The statistical values of 33 cells of the pressurized group and 32 of the control group implied increased nuclear height after exposure to pressure (t test, P < 0.0001). Scale bar: 20 µm. (b) The nuclear (blue) area was assessed in both the experimental group and the control group using ImageJ. Decreased maximum projected area of nuclei was observed in pressurized condition (n = 10, t test, P = 0.0078). Scale bar: 50 µm. (c) In static condition, lamin A/C was spread diffusely throughout the nuclei while the high pressure resulted in aggregation of lamin A/C on the edge of the nuclei. Scale bar: 50 µm. Ratio of fluorescence intensity between the edge of a nucleus and mean level of that nucleus showed an increase after pressure stimulus (n = 20, P = 0.0002).
Figure 3
Mass spectrometry-based comparative proteomics analysis after 24 h of 40 kPa hydrostatic pressure. (a) Principal component analysis identified significant clustering of groups. (b) Heatmap of protein expression in both pressurized and control groups. (c) Volcano plot showing differentially expressed proteins after 24 h of high hydrostatic pressure over control group. (d) The enriched canonical pathways presented by IPA indicated severely affected mitochondrial function. (e) Differential expression of proteins related to mitochondrial dynamics detected by mass spectrometer (n = 6; DRP1, P = 0.0097; OPA1, P = 0.0043; BAX, P < 0.0001).
Figure 4
Mitochondria dynamics under hydrostatic pressure for 24 h. (a) Western blots showing differences in the expressions of mitochondrial-related proteins. (b) Relative expression levels of OPA1, DRP1, and BAX. Mean ± SD values from three repeated experiments are presented. There is significant increase in OPA1 (n = 3, t-test, P = 0.0287) along with decrease in DRP1 (n = 3, t-test, P = 0.003) and BAX (n = 3, t-test, P = 0.0085). (c) The merged images show mitochondria stained by Mito-Tracker (red) and Hoechst-stained nuclei. Scale bar: 50 µm. (d) The average length of branch increased after pressure stimulus (n = 10, P = 0.0252). (e) mRNA expressions of representative genes in the two groups. Compared with the control group, cells exposed to high pressure exhibited elevated mRNA expression of OPA1 (n = 3, P = 0.0038) and decreased mRNA expression of FIS1 (n = 3, P = 0.0362). The mRNA level of pro-apoptosis gene BAX (n = 3, P = 0.0128) was down-regulated and the mRNA level of anti-apoptosis gene BCL2 was up-regulated (n = 3, P = 0.0030). The mRNA expression of endothelial cell marker PECAM-1 was decreased while that of the smooth muscle cell marker ACTA2 (n = 3, P = 0.0005) was increased. The two groups showed similar expression of adhesion related gene CDH5 and other genes associated with mitochondria (MFN, MFN2, DRP1).
Figure 5
Mitochondria activity and proliferation of cells. (a) The MMP was assessed by TMRM (green) in live cells. Cell nuclei were stained with Hoechst (blue). Representative images from the two groups show higher TMRM florescence of cells under high pressure. Scale bar: 50 µm. (b) ROS production, which specifically targets mitochondria, was labeled by Mitosox (Red). Cell nuclei were stained with Hoechst (blue). Confocal image shows bright spots in the experimental group. Scale bar: 50 µm. (c) Normalized TMRM and Mitosox florescence are presented as mean ± SE. Ten images were randomly chosen in each group. Stimulus of high pressure enhanced MMP (n = 10, P < 0.0001) and ROS production (n = 10, P = 0.0111) in mitochondria. (d) Proliferating cells were labeled by antibody of ki-67, which is not present in resting cells. Compared to control group, a greater percentage of proliferating cells were detected in the experimental group. (n = 3, P = 0.0011).

 DownLoad:


 下载:
下载:


 下载:
下载:
