Figure 1.
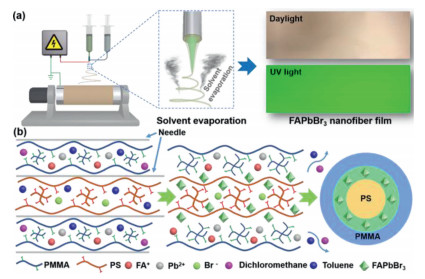
(a) Schematic diagram of fabricating PS/FAPbBr3/PMMA nanofiber film. (b) Schematic mechanism of FAPbBr3 PQDs generated at the interface of PS and PMMA polymer matrixes in spinning nanofiber.
In-situ synthesis of stable perovskite quantum dots in core-shell nanofibers via microfluidic electrospinning
Rui Cheng , Zhi-Bin Liang , Haixia Shen , Jiazhuang Guo , Cai-Feng Wang , Su Chen

In recent years, perovskite quantum dots (PQDs) have been comprehensively explored, owing to their unique optical properties and extensive application prospects [1]. To the present, PQDs have shown great potentials in quantum dot light emitting diodes (QLEDs) [2, 3], high-performance backlight displays [4, 5], lasers [6, 7], solar cells [8, 9], photodetectors [10, 11], luminescent solar concentrators [12, 13] and field effect transistors [14]. Unfortunately, PQDs endure the disadvantage of poor optical stability, which are mainly attributed to the effect of the oxygen, moisture, light, and heat [15]. To address this issue, various methods are developed to improve the optical stability of PQDs, such as encapsulation [16-19], heterojunction [20] and ion doping [21].
In particular, the in-situ encapsulation method has been proved to be one of effective strategies for improving optical stability of PQDs [22]. The encapsulation materials of PQDs mainly include oxides [23, 24], inorganic salts [25, 26], inorganic polymers [27, 28] and organic polymers [29-31], Among these encapsulation materials, organic polymers are widely used because of their higher flexibility, better transparency and easy processability [15]. Zhong's group employed polyvinylidene fluoride (PVDF) as encapsulation material to in-situ fabricate perovskite nanocrystal-embedded polymer composite films with highest PL quantum yield (QY) of 94.6% ± 1% and improved PL stability against water and UV irradiation [31]. They also implemented the same method to fabricate polymethyl methacrylate (PMMA) encapsulated RbxCs1–xPbI3 PQDs films with high PL stability against high humidity and blue light irradiation [32]. Fan's group utilized emulsion electrospinning for one-step fabrication of perovskite nanocrystals@polymer nanofibers, showing good stability under conditions of humid ambient environment (relative humidity > 60%) or even in water [33]. Recently, our group developed a fiber-spinning-chemistry method to achieve the in-situ fabrication of all-inorganic PQDs, to form CsPbX3/PMMA/thermoplastic polyurethane (TPU) nanofibers [34]. The as prepared nanofibers show tunable PL properties and improved PL stability against long-time storage at atmosphere and even in water. Moreover, the fiber-spinning-chemistry method was also proven to be a high-efficiency method to realize the synthesis of methylammonium lead bromine (MAPbBr3) PQDs [35, 36] in nanofibers.
Herein, guided by the fiber-spinning-chemistry method, we realized the in-situ generation of stable organic-inorganic formamidinium lead bromine (FAPbBr3) PQDs at the interface of core-shell spinning nanofibers via microfluidic electrospinning (Fig. 1a). By designing a coaxial spinning needle, the inner and outer phases of the coaxial needle were respectively fed with a polymer solution of polystyrene (PS) and PMMA dissolved in organic solvents (toluene and dichloromethane). At the same time, the precursors of FAPbBr3 PQDs were added to the polymer solutions of the inner and outer phases, respectively. Then the core-shell nanofibers were spun by a microfluidic electrospinning method. When the polymer solutions of the inner and outer phases were extruded out of the coaxial needle, the precursors dispersed in the two phases would quickly react and generate FAPbBr3 PQDs (Fig. 1b). The resultant PS (core) and PMMA (shell) coated FAPbBr3 QDs (abbreviated as PS/FAPbBr3/PMMA, hereinafter) nanofiber film emits green fluorescence with PL QY of 82.3%. With the regulated halogen constitutions, FAPbX3 PQDs exhibiting bright blue and red fluorescence were also successfully in-situ generated. This process could greatly reduce the use of solvents and circumvent the aftertreatment of wastewater [34]. Moreover, the PQDs are located at the interface of PS and PMMA matrixes, making the PQDs difficult to be corroded by external water and oxygen, greatly improving the stability of PQDs. Significantly, the resultant nanofiber films could be directly applied as light conversion films for the construction of wide-color-gamut backlight display.
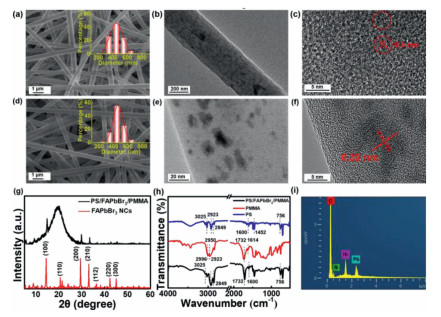
The morphology and structure of nanofiber films were investigated (Fig. 2). Scanning electron microscope (SEM) images and size distributions of blue-emissive PS/FAPbCl3/PMMA (Fig. S1 in Supporting information), green-emissive PS/FAPbBr3/PMMA (Fig. 2a) and red-emissive PS/FAPbI3/PMMA (Fig. 2d) nanofiber films were recorded and calculated. It can be seen that blue-, green- and red-emissive films all present nanofibrous morphologies and uniform size distribution, and the average diameters of the nanofibers were determined to be 465, 450 and 463 nm, respectively. Fig. 2b presents the transmission electron microscope (TEM) image of PS/FAPbBr3/PMMA nanofiber, confirming the existence of FAPbBr3 PQDs. The morphology of the FAPbBr3 PQDs can be observed from the high-resolution transmission electron microscope (HRTEM) image (Fig. 2c), in which the diameter of PQDs is about 5 nm, and the lattice spacing is 0.3 nm, consistent with the results of FAPbBr3 PQDs reported in previous reports [37, 38]. The red-emissive PS/FAPbI3/PMMA nanofiber was also measured by TEM, indicating the formation of FAPbI3 PQDs with an average diameter of ~10 nm in nanofiber (Fig. 2e). Fig. 2f exhibits HRTEM image of FAPbI3 PQDs, showing lattice spacing of 0.32 nm, consistent with that in previous report [39]. To further research the structure and composition of nanofibers, green-emissive PS/FAPbBr3/PMMA nanofiber film was chosen as representative for in depth characterizations. X-ray diffraction (XRD) characterization was preformed to further confirm the formation of FAPbBr3 PQDs in nanofibers (Fig. 2g). Compared to the XRD pattern of FAPbBr3 PQDs (red line), the XRD pattern of PS/FAPbBr3/PMMA nanofiber film (black line) revels that the diffraction peaks at 2θ = 14.8°, 29.8°, 33.5°, 42.7° and 45.4° are attributed to (100), (200), (210), (220), (300) plane of FAPbBr3 PQDs, while the broad diffraction peak at 2θ of 19.6° is produced by PS and PMMA polymer [34]. In a word, the XRD characterization confirmed that the FAPbBr3 PQDs were generated in PS/FAPbBr3/PMMA nanofibers. Fig. 2h shows the Fourier transform infrared (FT-IR) spectra of the green-emissive PS/FAPbBr3/PMMA nanofiber film, PMMA and PS polymer matrixes. The peaks centered at 3025, 2923, and 2849 cm−1 in FT-IR spectrum of PS matrix (blue line) are attributed to the stretching vibration of =CH2, the asymmetric and symmetric stretching vibrations of -CH2- on the benzene ring, respectively. The peaks centered at 1600 cm−1 and 1452 cm−1 are attributed to the bending vibration of -C=C- on the benzene ring, while the peak at 756 cm−1 is ascribed to the out-of-plane deformation of the monosubstituted benzene ring [40]. The peaks centered at 2996 and 2950 cm−1 in FT-IR spectrum of PMMA matrix (red line) are attributed to the strong absorption of methylene and methyl groups, respectively. The peaks centered at 1732 cm−1 is ascribed to the strong absorption of ester carbonyl groups [41]. The characteristic peaks of PS and PMMA polymer matrixes all exist in the PS/FAPbBr3/PMMA nanofiber film, demonstrating the existence of PS and PMMA polymer matrixes in the film. Energy dispersive spectrometer (EDS) analysis was used to explore the element distribution in green-emissive PS/FAPbBr3/PMMA nanofiber film (Fig. S2 in Supporting information). It can be seen that C, N, Pb and Br elements are evenly dispersed in the nanofiber film. C element is mainly derived from the polymer matrix such as PS and PMMA, while the N, Pb and Br elements are derived from the FAPbBr3 PQDs. Fig. 2i is the corresponding element distribution spectrum, in which the content of C element is the highest, which is attributed to the polymer matrix with the highest content in the composition. Compared with Pb and Br elements, the content of Br is slightly higher, which is consistent with the structural formula of FAPbBr3 PQDs.
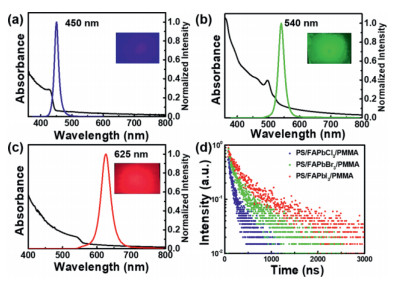
Thanks to the in-situ generation of PQDs in nanofibers, the nanofiber films exhibit bright multicolor fluorescence. Fig. 3a shows the absorption and PL spectra of blue-emissive PS/FAPbCl3/PMMA nanofiber film. The film shows a UV–vis absorption peak at 428 nm and a PL peak at 450 nm with the FWHM of 15 nm. The inset picture is the digital photograph of PS/FAPbCl3/PMMA nanofiber film taken under the 365 nm UV light, exhibiting the high-purity blue fluorescence with the PL QY of 15.8%. The optical properties of green-emissive PS/FAPbBr3/PMMA nanofiber film are shown in Fig. 3b. The UV–vis absorption peak is centered at 497 nm, while the PL peak is centered at 540 nm with the FWHM of 21 nm. The PS/FAPbBr3/PMMA nanofiber film exhibits bright green fluorescence with the PL QY of 82.3%. Fig. 3c presents the optical properties of red-emissive PS/FAPbI3/PMMA nanofiber film with UV–vis absorption peak and PL peak centered at 544 and 625 nm, respectively. The FWHM of PL curve is 32 nm. The inset picture shows the red fluorescence of PS/FAPbI3/PMMA nanofiber film with a PL QY of 56.6%. Furthermore, the time-resolved single photon counting method (TCSPC) was used to analyze the PL lifetime of the nanofiber films (Fig. 3d). It can be seen that the three decay curves all exhibit double exponential decay, similar to the PL decay behavior of PQDs reported in the literatures [37, 42, 43]. In particular, the PL lifetimes of PS/FAPbCl3/PMMA, PS/FAPbBr3/PMMA and PS/FAPbI3/PMMA nanofiber films are 143, 343 and 640 ns, respectively. As the radius of the halogen atom at the X position becomes larger, the corresponding PL lifetime becomes longer, indicating that as the band gap of the QD increases, so does the rate of carrier recombination [37].
PQDs are usually restricted to the poor stability, especially under the condition of blue light aging, oxygen corrosion and polar solvents. In this work, due to the protection of polymer matrixes, the PQDs generated at the interface of core layer and shell layer in core-shell nanofibers exhibit remarkable PL stability under extreme conditions, such as blue light irradiation, long-time storage in the air and even dipped in water. Fig. 4a exhibits the PL stability of green-emissive PS/FAPbBr3/PMMA nanofiber film under blue light irradiation. The nanofiber film was radiated by blue light emitted from a 450 nm LED, simulating the environment in which the nanofiber film is applied in QD-LCD. After 50 h of continuous exposure to blue light, the PL intensity of green-emissive PS/FAPbBr3/PMMA nanofiber film decreased by only 5%. The polymer matrixes in nanofibers insulate the oxygen in air, protecting the FAPbBr3 PQDs generated in nanofibers. Therefore, when stored in air for 6 months, the PS/FAPbBr3/PMMA nanofiber film still maintains 90% of initial PL intensity (Fig. 4b). In addition, the polymer matrixes are able to eliminate the erosion of FAPbBr3 PQDs by water, so the PS/FAPbBr3/PMMA nanofiber film can keep constant PL intensity after 5 days of immersion in water (Fig. 4c). These results revel that PS/FAPbBr3/PMMA nanofiber film has better PL stability compared to FAPbBr3 PQDs and will has a wider application prospect.

In order to prove that the PQDs are generated at the interface of core layer and shell layer in the nanofibers, laser scanning confocal microscope (LSCM) was used to observe the fluorescence distribution in the nanofiber. Fig. 5 shows the bright field, fluorescence field and merged images of PS/FAPbCl3/PMMA, PS/FAPbBr3/PMMA and PS/FAPbI3/PMMA nanofibers. The bright field images were taken under halogen lamp light, exhibiting the real physical size of nanofibers. The fluorescence field images were taken at 305 nm excitation light and show the distribution area of the PQDs in the nanofibers. Take PS/FAPbCl3/PMMA nanofiber as an example. By comparing the bright field and fluorescent field images, it can be found that the fluorescent field image has a finer diameter, indicating that FAPbCl3 PQDs are dispersed in the interior of the nanofiber. The merged image is the image where the bright field and fluorescent field images are superimposed together, showing more clearly the distribution of FAPbCl3 PQDs in the nanofiber. The LSCM images of PS/FAPbBr3/PMMA and PS/FAPbI3/PMMA nanofibers also demonstrate the similar results that FAPbBr3 and FAPbI3 PQDs dispersed in interior of the nanofiber. Thus, the LSCM images indirectly demonstrate that PQDs are generated at the interface of core layer and shell layer polymer matrixes in the nanofibers.

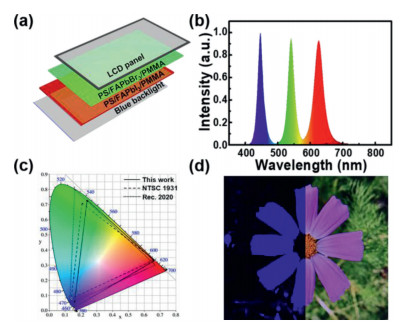
Quantum dot liquid crystal display (QD-LCD) is the most common device of QDs in display devices [44-46]. It not only has a relatively simple structure, but also uses QDs as color conversion material, which can achieve a higher color gamut far exceeding that of ordinary LCD. The simplified structure of QD-LCD in this case is shown in Fig. 6a. The uppermost layer is a liquid crystal panel for imaging; the bottom layer is a blue backlight, which is composed of blue LEDs and a light guide plate. Between the blue backlight and the LCD panel are green-emissive PS/FAPbBr3/PMMA and red-emissive PS/FAPbI3/PMMA nanofiber films. Fig. 6b shows the emission spectrum of QD-LCD. The PL peaks of green fluorescence and red fluorescence are located at 540 and 625 nm, respectively, which are consistent with the PL spectra of green-emissive PS/FAPbBr3/PMMA and red-emissive PS/FAPbI3/PMMA nanofiber films. Fig. 6c shows the color gamut of QD-LCD with value of 125% based on NTSC 1931 and of 85% based on Rec.2020, respectively, which is much higher than that of commercial LCD [47]. The brightness of the QD-LCD was achieved by testing the emission of white light at a value of 38 lm/W. Fig. 6d shows the display performance of QD-LCD. The right side of the QD-LCD is equipped with green- and red-emissive nanofiber films, which shows vibrant colors compared to the left side without nanofiber films, demonstrating the remarkable optical properties of the as prepared nanofiber films.
In summary, we realized the fabrication of blue-emissive PS/FAPbCl3/PMMA, green-emissive PS/FAPbBr3/PMMA and red-emissive PS/FAPbI3/PMMA nanofiber films with a microfluidic electrospinning method. The as-prepared nanofiber films not only exhibit high PL QY (82.3%), but also show good PL stability under blue light irradiation, long-term storage in the air and water resistance test. We confirmed that the PL stability of nanofiber film come from the core-shell nanofiber, which not only allows the in-situ generation of PQDs at the interface of PS and PMMA polymer matrixes, but also isolates the corrosion of oxygen and moisture. The green-and red-emissive nanofiber films were directly applied as light conversion films to fabricate wide-color-gamut display with color gamut of 125%, confirming excellent optical properties of these nanofiber films.
The authors declare that they have no known competing financial interests or personal relationships that could have appeared to influence the work reported in this paper
This work was supported by the National Natural Science Foundation of China (Nos. 21736006 and 21978132), and the Priority Academic Program Development of Jiangsu Higher Education Institutions (PAPD).
Supplementary material associated with this article can be found, in the online version, at doi:
D. Chen, X. Chen, J. Mater. Chem. C 7 (2019) 1413–1446. doi: 10.1039/C8TC05545A
Y. Ye, J. Wang, Y. Qiu, et al., Nano Energy 90 (2021) 106583. doi: 10.1016/j.nanoen.2021.106583
H. Zhao, H. Chen, S. Bai, et al., ACS Energy Lett. 6 (2021) 2395–2403. doi: 10.1021/acsenergylett.1c00812
Y. Zhou, J. Ding, Z. Wang, et al., Chem. Eng. J. 426 (2021) 130786. doi: 10.1016/j.cej.2021.130786
J. Lin, Y. Lu, X. Li, et al., ACS Energy Lett. 6 (2021) 519–528. doi: 10.1021/acsenergylett.0c02561
D. Xing, C.C. Lin, Y.L. Ho, et al., Adv. Funct. Mater. 31 (2020) 2006283.
Q. Shang, M. Li, L. Zhao, et al., Nano Lett. 20 (2020) 6636–6643. doi: 10.1021/acs.nanolett.0c02462
X. Yang, Y. Chen, P. Liu, et al., Adv. Funct. Mater. 30 (2020) 2001557. doi: 10.1002/adfm.202001557
H. Ren, S. Yu, L. Chao, et al., Nat. Photonics 14 (2020) 154–163. doi: 10.1038/s41566-019-0572-6
Y. Zhan, Y. Wang, Q. Cheng, et al., Angew. Chem. Int. Ed. 58 (2019) 16456–16462. doi: 10.1002/anie.201908743
H. Jing, R. Peng, R.M. Ma, et al., Nano Lett. 20 (2020) 7144–7151. doi: 10.1021/acs.nanolett.0c02468
M. Wei, F.P.G. de Arquer, G. Walters, et al., Nat. Energy 4 (2019) 197–205. doi: 10.1038/s41560-018-0313-y
Z. Li, A. Johnston, M. Wei, et al., Joule 4 (2020) 631–643. doi: 10.1016/j.joule.2020.01.003
J.Y. Oh, S. Rondeau-Gagné, Y.C. Chiu, et al., Nature 539 (2016) 411–415. doi: 10.1038/nature20102
W. Lv, L. Li, M. Xu, et al., Adv. Mater. 31 (2019) 1900682. doi: 10.1002/adma.201900682
Y. Wei, X. Deng, Z. Xie, et al., Adv. Funct. Mater. 27 (2017) 1703535. doi: 10.1002/adfm.201703535
K.K. Liu, Q. Liu, D.W. Yang, et al., Light Sci. Appl. 9 (2020) 44. doi: 10.1038/s41377-020-0283-2
P.C. Tsai, J.Y. Chen, E. Ercan, et al., Small 14 (2018) 1704379. doi: 10.1002/smll.201704379
W. Chen, J. Hao, W. Hu, et al., Small 13 (2017) 1604085. doi: 10.1002/smll.201604085
R. Cheng, H. Shen, Z. Chen, et al., Mater. Lett. 254 (2019) 171–174. doi: 10.1016/j.matlet.2019.07.021
S. Zou, Y. Liu, J. Li, et al., J. Am. Chem. Soc. 139 (2017) 11443–11450. doi: 10.1021/jacs.7b04000
S. Chang, Z. Bai, H. Zhong, Adv. Opt. Mater. 6 (2018) 1800380. doi: 10.1002/adom.201800380
G. Longo, A. Pertegás, L. Martínez-Sarti, M. Sessolo, H.J. Bolink, J. Mater. Chem. C 3 (2015) 11286–11289. doi: 10.1039/C5TC02447A
A.A.S. Gonçalves, M.J.F. Costa, L. Zhang, F. Ciesielczyk, M. Jaroniec, Chem. Mater. 30 (2018) 436–446. doi: 10.1021/acs.chemmater.7b04353
J.Y. Sun, F.T. Rabouw, X.F. Yang, et al., Adv. Funct. Mater. 27 (2017) 1704371. doi: 10.1002/adfm.201704371
C. Guhrenz, A. Benad, C. Ziegler, et al., Chem. Mater. 28 (2016) 9033–9040. doi: 10.1021/acs.chemmater.6b03980
H.C. Yoon, S. Lee, J.K. Song, H. Yang, Y.R. Do, ACS Appl. Mater. Interfaces 10 (2018) 11756–11767. doi: 10.1021/acsami.8b01014
S. Liu, Y. Luo, M. He, X. Liang, W. Xiang, J. Eur. Ceram. Soc. 38 (2018) 1998–2004. doi: 10.1016/j.jeurceramsoc.2017.10.012
T. Xuan, J. Huang, H. Liu, et al., Chem. Mater. 31 (2019) 1042–1047. doi: 10.1021/acs.chemmater.8b04596
Y. Xin, H. Zhao, J. Zhang, ACS Appl. Mater. Interfaces 10 (2018) 4971–4980. doi: 10.1021/acsami.7b16442
Q. Zhou, Z. Bai, W.G. Lu, et al., Adv. Mater. 28 (2016) 9163–9168. doi: 10.1002/adma.201602651
F. Li, S. Huang, X. Liu, et al., Adv. Funct. Mater. 31 (2021) 2008211. doi: 10.1002/adfm.202008211
Z. Wang, H. He, S. Liu, et al., Small 16 (2020) 2004409. doi: 10.1002/smll.202004409
X. Lu, Y. Hu, J. Guo, et al., Adv. Sci. 6 (2019) 1901694. doi: 10.1002/advs.201901694
H. Bi, F. Liu, M. Wang, et al., Polym. Int. 70 (2021) 90–95.
L. Meng, C. Yang, J. Meng, et al., Nano Res. 12 (2019) 1411–1416. doi: 10.1007/s12274-019-2353-4
Y. Dou, S. Wang, C. Zhang, et al., Adv. Mater. Technol. 5 (2020) 1901089. doi: 10.1002/admt.201901089
S. Adjokatse, H.H. Fang, M.A. Loi, Mater. Today 20 (2017) 413–424. doi: 10.1016/j.mattod.2017.03.021
I. Levchuk, A. Osvet, X. Tang, Nano Lett. 17 (2017) 2765–2770. doi: 10.1021/acs.nanolett.6b04781
M. Meyns, S. Primpke, G. Gerdts, Anal. Methods 11 (2019) 5195–5202. doi: 10.1039/C9AY01193E
J. Gaitán-Alvarez, A. Berrocal, G.I. M. antanis, R. Moya, F. Araya, J. Wood Sci. 66 (2020) 49. doi: 10.1186/s10086-020-01898-9
I. Levchuk, A. Osvet, X. Tang, et al., Nano Lett. 17 (2017) 2765–2770. doi: 10.1021/acs.nanolett.6b04781
D.N. Minh, J. Kim, J. Hyon, et al., Chem. Mater. 29 (2017) 5713–5719. doi: 10.1021/acs.chemmater.7b01705
Y.M. Huang, K.J. Singh, A.C. Liu, et al., Nanomaterials 10 (2020) 1327. doi: 10.3390/nano10071327
R. Cheng, F. Li, J. Zhang, et al., J. Mater. Chem. C 7 (2019) 4244–4249. doi: 10.1039/C9TC00113A
Y. Shu, X. Lin, H. Qin, et al., Angew. Chem. Int. Ed. 59 (2020) 22312–22323. doi: 10.1002/anie.202004857
H.C. Wang, S.Y. Lin, A.C. Tang, et al., Angew. Chem. Int. Ed. 55 (2016) 7924–7929. doi: 10.1002/anie.201603698

Figure 1 (a) Schematic diagram of fabricating PS/FAPbBr3/PMMA nanofiber film. (b) Schematic mechanism of FAPbBr3 PQDs generated at the interface of PS and PMMA polymer matrixes in spinning nanofiber.

Figure 2 (a) SEM, (b) TEM and (c) HRTEM images of green-emissive PS/FAPbBr3/PMMA nanofiber film. (d) SEM, (e) TEM and (f) HRTEM images of red-emissive PS/FAPbI3/PMMA nanofiber film. The insets are size distributions of corresponding nanofiber films. (g) XRD patterns of PS/FAPbBr3/PMMA nanofiber film and FAPbBr3 PQDs. (h) FT-IR spectra of PS, PMMA and PS/FAPbBr3/PMMA nanofiber film. (i) Element distribution spectrum of C, N, Pb and Br elements in PS/FAPbBr3/PMMA nanofiber film.

Figure 3 UV–vis absorption and PL spectra of (a) PS/FAPbCl3/PMMA, (b) PS/FAPbBr3/PMMA and (c) PS/FAPbI3/PMMA nanofiber films. Inset pictures: the photographs of the films taken under 365 nm UV light. (d) PL decay curves of blue-, green- and red-emissive nanofiber films.

Figure 4 The variation of PL intensity of PS/FAPbBr3/PMMA nanofiber film under (a) blue light irradiation and (b) long-term storage in the air. (c) The photographs of PS/FAPbBr3/PMMA nanofiber film immersed in water from 0 to 5 days.

Figure 5 LSCM images of PS/FAPbCl3/PMMA, PS/FAPbBr3/PMMA and PS/FAPbI3/PMMA nanofibers. Scale bar: 500 nm.

 扫一扫看文章

扫一扫关注我们
 DownLoad:
 下载:
下载:

 下载:
下载: