Figure 1.
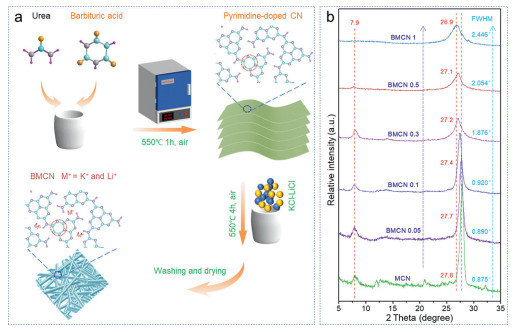
(a) Preparation process and (b) XRD patterns of MCN and BMCN samples. The atoms of C, N, H and O are in cyan, gray, purple and orange, respectively.
Pyrimidine donor induced built-in electric field between melon chains in crystalline carbon nitride to facilitate excitons dissociation
Guoqiang Zhang , Yangsen Xu , Guoshuai Liu , Yongliang Li , Chuanxin He , Xiangzhong Ren , Peixin Zhang , Hongwei Mi

Crystalline carbon nitride (CCN), due to its crystalline structure, has superior photocatalytic efficiency than amorphous melon-based carbon nitride (CN), and is a promising candidate for driving solar energy conversion [1]. However, unlike inorganic semiconductors with strong screening effects and large dielectric properties, most polymers, including CCN, exhibit strong intrinsic Coulomb interactions of singlet Frenkel excitons, that is, much larger excitons binding energy (EBE) than thermal disturbance energy (~25 meV at room temperature) and inorganic materials [2-4]. This means that photogenerated carriers exist in the form of Frenkel excitons in CCN, which greatly prevents the dissociation into electrons and holes for photocatalytic reaction [5]. Therefore, charges separation in CCN is bound to be a sluggish process due to the difficult dissociation of photogenerated Frenkel excitons.
The establishment of built-in electric field (BIEF) is one of the effective strategies to facilitate excitons dissociation [6-9]. Such BIEF will provide a driving force for excitons dissociation, realize the spatial separation of electrons and holes, and quickly transfer carriers to the photocatalyst surface to participate in photocatalytic reactions. Traditional strategy of generating BIEF is to establish heterojunctions [10]. However, the formation of heterojunctions requires many harsh conditions, such as atomic level contact, interface and energy level matching, which make them difficult to construct [11]. In addition, the energy of excitons dissociation should be close to the EBE, which requires heterojunction materials with more different work functions and electronic structures to generate strong BIEF to dissociate excitons. Consequently, a more advanced strategy is urgently needed to generate BIEF to accelerate excitons dissociation. The molecular regulation of donor-acceptor (D-A) systems with different polarity and electron affinity [12-16], can change the charge density distribution over heptazine-rings to induce BIEF. Different from the harsh conditions of heterostructure construction, molecular regulation is more flexible and diverse. More importantly, it may eliminate the influence of heterojunction interfaces as carrier recombination centers. Its BIEF strength depends on the interaction between the donor and the acceptor. Therefore, the strongest possible donor and acceptor should be selected to generate BIEF to overcome the considerable EBE. Different from acceptor, considering that the introduction of donor will not change the sites of photoreduction and the reduction ability of photogenerated electrons in CCN [17-19], strong interaction between donor and heptazine unit is needed to facilitate excitons dissociation.
Herein, the pyrimidine donor is introduced into heptazine-based CCN through the copolymerization of urea with barbituric acid (BA) followed by crystallization in potassium chloride and lithium chloride (KCl-LiCl) molten-salt. As an electron-rich group, it can change the charge density distribution over heptazine-rings to induce BIEF between the melon chains. Consequently, the induced BIEF reduces the EBE by 22.0 meV and increases the excitons dissociation efficiency (EDE) by 30.4%. The hydrophilicity is also improved, and the light response wavelength is extended to 600 nm. Our work established a strategy to promote excitons dissociation through molecular regulation induced BIEF.
Chemicals and materials: Urea (AR, 99.0%), KCl (AR, 99.5%), LiCl (AR, 99.0%), barbituric acid (BA, 98%), H2PtCl6·6H2O (AR, Pt ≥ 37.5%) and triethanolamine (TEOA, AR, 98.0%) were purchased from Aladdin Reagent Company.
Preparation of copolymerized CN: 10 g of urea powder and 0.05-1 g of BA were mixed in a 20 mL of crucible with a cover (sealed with tin foil) and then heat to 550 ℃ at a rate of 2 ℃/min for 1 h. The copolymerized CN is obtained after cooling down to room temperature.
Molten-salt crystallized CN (MCN) and copolymerized CN (BMCN x): The obtained copolymerized CN, 5.5 g of KCl and 4.5 g of LiCl were mixed in a 20 mL of crucible with a cover (sealed with tin foil) and then heat to 550 ℃ at a rate of 10 ℃/min in a muffle furnace (in the air) and maintain at this temperature for 4 h. Note: placing the mixed salt above CN is beneficial to completely cover CN and isolate air when molten salt melts. The products with gradually deepened color were obtained after cooled to room temperature, washed with plenty of water and dried at 60 ℃ under vacuum. According to the feed mass of BA, we denote the samples as BMCN x (x = 0.05-1), where x is the feed mass of BA. MCN is synthesized under the condition similar to BMCN, except that BA is not added.
The preparation process for MCN and BMCN samples are shown in Fig. 1a. Urea undergoes a homogeneous solution process during heating, and gradually polymerizes into isocyanic acid, biuret, cyanuric acid, melamine and melem [20]. All the processes of urea reaction are beneficial to pyrimidine-ring doping into melem through Schiff base polycondensation, and then the pyrimidine-containing melem polymerizes to pyrimidine-doped CN [12]. Subsequently, the KCl-LiCl molten-salt (5.5 g of KCl and 4.5 g of LiCl) was used as structure inducer to prepare K+ and Li+ ions implanted CCN, which can make its amorphous structure recrystallize [21, 22]. It is worth noting that the mixed salts should be placed above CN in the preparation process, which is conducive to completely covering CN and isolating air when molten salt melts. For simplicity, the prepared samples are named BMCN x, where x (0.05-1) represents the added weight of BA.
The powder X-ray diffraction (XRD) patterns are revealed in Fig. 1b. The main peak at 27.8° corresponds to the interlayer π-π stacking of conjugated aromatic rings, referred to as the (002) crystal plane [23, 24]. With the introduction of BA, the main peak gradually shifts to a low angle, indicating the successful molecular regulation of BMCN. The peak at 7.9° corresponds to the in-plane repeating units and is considered as (100) crystal plane, confirming the retained heptazine-based structures. Its strength gradually decreases with the addition of BA, which may be caused by the destruction of the in-plane structure by pyrimidine and the reduction of in-plane crystallinity. According to the optimized structure (C12N18H6K, a = 12.23 Å, b = 17.12 Å and c = 6.24 Å, α = β = γ = 90°), the XRD diffraction peaks of (100) and (002) crystal planes are 7.22° and 28.51°, which is basically close to the experimental values. The XRD patterns here is not significantly different from the CCN previously constructed with KCl-LiCl molten-salt [23, 24]. The full width at half maxima (FWHM) values increase gradually, manifesting the highest crystallinity of MCN among those samples.
The yield of BMCN samples increased significantly with the addition of BA compared to MCN (Fig. S1 in Supporting information). The content of K and Li elements is 4.41 wt%-3.46 wt% and 0.80 wt%-0.58 wt%, respectively, determined by inductively coupled plasma (ICP, Table S1 in Supporting information). All the samples present similar thermal stability (TG, Fig. S2 in Supporting information). They begin to decompose at 500 ℃, decompose violently at 600 ℃, and decompose completely at 700 ℃. In addition, the water loss signal of BMCN is stronger than that of MCN in the range of 100-200 ℃, which suggests that BMCN may have better hydrophilicity.
The characteristic structures are characterized by Fourier transform infrared spectroscopy (FTIR). As shown in Fig. 2a, the representative signals at 1200-1700 cm−1 correspond to the stretching and bending vibration of conjugated triazine heterocycles [13, 25, 26], and the peak at 2168 cm−1 belongs to the asymmetric stretching pattern of cyano group (-C≡N). The out-of-plane bending vibration of the heptazine-ring appears at 812 cm−1, and gradually weakens, indicating that the introduction of BA destroys part of heptazine units. In addition, the signals at 997 and 1066 cm−1 may be attributed to the symmetric and asymmetric vibrations of NC2 bonds in metal-NC2 groups [27, 28], which suggests that K+ and Li+ ions are incorporated between the heptazine-based melon chains.

The chemical structures are further confirmed by 13C solid-state CP-MAS-NMR spectroscopy (Fig. 2b). The two resonance peaks at 166.2 and 163.0 ppm, belong to CN2-(NHx) units in heptazine-based structures [29-31]. The C-N3 moieties at 156.4 ppm becomes weaker with the pyrimidine-ring doping, corresponding to the weakening of heptazine structures. Besides, due to the pyrimidine-ring doping, the C/N molar ratio raised from 0.64 (MCN) to 0.66 (BMCN 0.1), and finally to 0.81 (BMCN 1), estimated by elemental analysis (inset in Fig. 2b).
The survey X-ray photoelectron spectroscopy (XPS) illustrates the presence of K, C, N and O elements in MCN and BMCN samples, respectively (Fig. S3 in Supporting information). The peak at 198.8 eV in high-resolution Cl 2p XPS can be attributed to Cl− ions (Fig. S4 in Supporting information), probably due to surface adsorption (less than 0.3 wt%) [32]. The high-resolution K 2p XPS exhibits two peaks at 295.6 and 292.8 eV attributed to K+ ions (Fig. S5 in Supporting information) [33], and the Li 1s XPS peak at 54.9 eV corresponds to Li+ ions (Fig. S6 in Supporting information) [34]. These results indicate that potassium and lithium exist as K+ and Li+ ions in the final product, respectively. In Fig. 2c, the C 1s XPS presents three contributions, located at 288.1, 286.3 and 284.7 eV, corresponding to C atoms in aromatic N–C=N units, –C≡N species and graphitic carbon, respectively [35, 36]. The ratio of graphitic carbon increases from 0.13 (MCN) to 0.15 (BMCN 0.1) and 0.33 (BMCN 1), which further indicates the successful doping of pyrimidine-ring. Besides, the peaks at 400.7, 399.9 and 398.4 eV of N 1s originate from the N atoms in bridging –NHx or –C≡N species, N–(C)3 and C–N=C units (Fig. 2d) [37, 38]. With the doping of pyrimidine-ring, the peak area of C–N=C decreases and the N–(C)3 increases in BMCN samples. Consequently, all these characterizations, including XRD, FTIR, NMR, elemental analysis and XPS, confirmed the successful doping of pyrimidine-ring in heptazine-based structures.
It should be emphasized that the C: N atomic ratio of MCN and BMCN 0.1 is closer to 0.66 of melon (C12N18H6) than 0.70 of poly(heptazine imide) (C12N17H3). Therefore, the obtained crystallized structure may be more similar to the crystallized K+ insertion into melon (C12N18H6K) proposed by Xu et al. [39]. Density functional theory (DFT) calculation was carried out to investigate the effect of pyrimidine-ring doping on the electronic structures. The corresponding optimized molecular structures of heptazine-based BMCN and MCN are shown in Fig. 3a and Fig. S7 (Supporting information). K+ and Li+ ions are inserted between amine-linked heptazine-based melon chains. The adjacent melon chains are expanded into two-dimensional supramolecular arrays via hydrogen bonding [39, 40]. As shown in Fig. 3b, the calculated density of states (DOS) indicates that the valence-band maximum (VBM) is contributed by N states and the conduction-band minimum (CBM) consists of hybrid N and C states, while K+ ions are not directly involved in the formation of band edge electronic states. After pyrimidine doping, the newly introduced N and C energy levels near the VBM elevate the VB position and narrow the bandgap, while the CB position is almost unchanged.
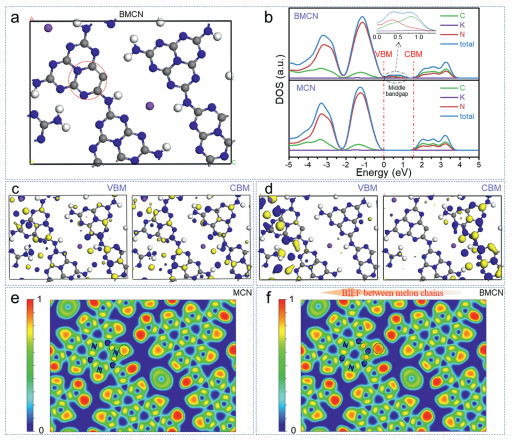
Figs. 3c and d exhibit the VBM and CBM states distribution. Compared with the symmetric overlap distribution of MCN, the states distribution in BMCN is more dispersed and localized in different melon chains. Specifically, VBM is mainly distributed around pyrimidine-ring, while CBM is located on melon chains far away from pyrimidine-ring. Further, the difference of charge density between adjacent melon chains is investigated by electron-localization function (ELF). The closer the ELF is to 0, it means that the electron is delocalized, that is, the smaller the probability of electron occurrence there. On the contrary, the ELF is close to 1, which represents the electron localization and the greater the probability of finding electrons there. As shown in Figs. 3e and f, the electrons distribution on adjacent melon chains of MCN is relatively symmetric, while electron localization occurs near the pyrimidine doped carbon in BMCN due to the electron donating property. Such distinct electron densities at different sites can induce the generation of BIEF between the melon chains, which promotes the Frenkel excitons dissociation into electrons and holes and accelerates the charges transfer and separation.
The color of the samples gradually changes from yellow to orange, and finally to red (Fig. S8 in Supporting information), indicating the expansion of visible-light absorption and narrowing of bandgap. The ultraviolet-visible diffuse reflectance spectra (UV-vis DRS, Fig. S9a in Supporting information) presents a remarkable redshift of light absorption edge from 470 nm to 700 nm with the doping of pyrimidine-ring compared to MCN. Besides, the bandgap appears approximately 0.49 eV narrowing from 2.79 eV (MCN) to 2.30 eV (BMCN 1) calculated from Tauc plots (Fig. S9b in Supporting information). The CB position is determined by cyclic voltammetry (CV, Fig. S10 in Supporting information), and the VB is calculated by adding the CB value to the bandgap. The band position satisfying the thermodynamic conditions of photocatalytic H2 production is shown in Table S2 (Supporting information). The VB-XPS analyses show that the VB position has a upward shift of 0.12 eV (BMCN 0.1) and 0.41 eV (BMCN 1) compared with MCN (Fig. S11 in Supporting information), which is consistent with our calculation.
The morphologies were characterized by field emission scanning electron microscope (FE-SEM) and transmission electron microscopy (TEM). As shown in Fig. 4a, Figs. S12 and S14a (Supporting information), MCN and BMCN 0.1 exhibit a typical nanorod structure, while its structure gradually disappears in BMCN 0.3 and BMCN 1 samples. The specific surface areas were determined by N2 adsorption-desorption isotherm (Fig. S13a in Supporting information), and the BET surface areas were calculated to be 44.7, 44.1, 40.5 and 25.8 m2/g for MCN, BMCN 0.1, BMCN 0.3 and BMCN 1, respectively. The decrease of specific surface area may be related to the disappearance of nanorod structures. The pore size distribution curves demonstrate a typical macroporous structure, which is formed by the aggregation of nanorods or nanoparticles (Fig. S13b in Supporting information).

Along the direction of nanorods, the clear lattice fringes spacing of 1.12 nm belonging to (100) crystal plane, can be observed in high-resolution TEM (HR-TEM) images (insets in Fig. 4b and Fig. S14b in Supporting information, Fig. 4c). The diffraction ring provides a lattice spacing of 0.32 nm in the selected area electron diffraction (SAED, Fig. 4d) pattern, corresponding to the (002) crystal plane. In addition, the XRD diffraction peaks at 7.9° and 27.8° can well match the diffraction fringes of 1.12 and 0.32 nm observed by HR-TEM and SAED pattern. These results confirm the excellent crystallinity of MCN and BMCN 0.1. Scanning TEM (STEM) equipped with energy dispersive X-ray spectroscopy (EDX) were used to investigate the elements distribution (Fig. 4e). The distribution of C, N, O and K elements in the whole region is relatively uniform (Figs. 4f-i and Figs. S14d-g in Supporting information).
As revealed by the calculated VBM and CBM states distribution, and ELF, the pyrimidine can act as strong electron donor to change the distribution of charge density on the heptazine-ring, resulting in BIEF between the melon chains. The model established by Kanata is used to estimate the BIEF intensity of the samples [41, 42], which demonstrates that the BIEF intensity is determined by the surface potential and the surface charge density. First, the surface potential is measured by Kelvin probe force microscope (KPFM). The two samples present distinct and relatively uniform two-dimensional fields, and the surface potentials are determined to be 872.3 and 983.4 mV, respectively (Figs. 5a-c). Second, the zeta potential of the samples is measured to be −17.5 and −34.9 mV, respectively (Fig. 5d). According to Gouy-Chapman model, the surface charge density is determined by zeta potential [43], so the BIEF can be estimated by surface potential and zeta potential. Finally, the BIEF intensity of BMCN 0.1 is 2.2 times that of MCN (Fig. 5e). As shown in Fig. 5f, the contact angle of water-drop on BMCN 0.1 is obviously smaller than MCN (16.8° vs. 30.2°), indicating better hydrophilicity.

With the introduction of pyrimidine-ring, the emission peaks in steady-state photoluminescence (PL, Fig. 6a) gradually shift from 454.0 nm to 535.8 nm, consistent with the extended light absorption. Since PL originates from the radiative recombination of singlet excitons, the decrease of emission intensity can be attributed to the elevated excitons dissociation [44, 45]. Singlet excitons can be transformed into triplet excitons or dissociated into electrons and holes. BMCN 0.1 exhibits lower phosphorescence emission (PH, inset in Fig. 6a) than MCN, indicating that less triplet excitons are formed due to the accelerated excitons dissociation. Besides, the enhanced excitons dissociation makes the fluorescence quench faster, so BMCN 0.1 (τ1 = 1.19 ns, τ2 = 4.96 ns) exhibits a shorter fluorescence lifetime than MCN (τ1 = 2.75 ns, τ2 = 9.19 ns) in time-resolved PL (TRPL, Fig. 6b) [5, 44].

The increase of temperature provides a driving force for dissociating singlet excitons, thus reducing the PL strength. In order to better illustrate that the induced BIFE facilitates excitons dissociation, the temperature-dependent photoluminescence (TD-PL, Fig. 6c) is performed to calculate the EBE according to the equation "I(T) = I0/(1+Ae−Eb/(kB T))", where I0 is the PL intensity at 0 K, k is Boltzmann constant, and Eb is EBE [46]. The EBE of MCN and BMCN 0.1 is determined to be 38.4 and 16.4 meV (Fig. 6d), respectively [47]. EDE can be calculated as 21.5% and 51.9% according to "EDE = e−Eb/(kB T)" (kBT ≈ 25 meV at room temperature).
Incident Photon-to-Current Efficiency (IPCE) test is used to characterize the separation efficiency of photogenerated carriers. As shown in Fig. 6e, BMCN 0.1 presents a 3-fold increase in photoelectric separation efficiency and the photoresponse wavelength is expanded to 600 nm. The schematic diagram of accelerating excitons dissociation by BIEF is shown in Fig. 6f. The pyrimidine doping changes the charge density distribution to induce the BIEF between the melon chains. Such induced BIEF is sufficient to overcome the considerable EBE and reduce it from 38.4 meV to 16.4 meV, which greatly facilitates the dissociation of excitons into free carriers. Meanwhile, the BIEF accelerates the transfer and separation of free electrons and holes to the photocatalyst surface, and makes more carriers participate in the photocatalytic reaction, resulting in significantly improved photocatalytic performance [9].
Femtosecond time-resolved transient absorption (fs-TA) spectroscopy, a useful tool for tracking the excitons relaxation pathway, was employed to further elucidate the excitons dissociation process. The femtosecond pump laser at 330 nm (1.3 mW) is selected to effectively excite the excitons from the ground state to a certain excited state. Figs. 7a and b present the representative fs-TA spectra (370-680 nm) recorded at different probe delays, showing a broad-spectrum distribution of ground state bleaching and excited state absorption. The largest TA signal is mainly concentrated at 660 nm. In addition, the TA intensity decreases with the prolongation of probe delays, indicating that the amount of active excitons decreases (Fig. S15 in Supporting information).

Kinetic traces probed at 660 nm are fitted to estimate the time constants of excitons relaxation (Figs. 7c and d). The ultrafast dynamics of excitons relaxation are well fitted by the double exponential function, which corresponds to the trapped states of excitons relaxation to two different depths [48]. The biexponential fitting datas are τ1 = 2.3 ± 0.08 ps (59.4%) and τ2 = 121 ± 6 ps (40.6%) for MCN, while τ1 = 17.2 ± 1.9 ps (65.5%) and τ2 = 196 ± 16 ps (34.5%) for BMCN 0.1. The increased component of the τ1 in BMCN 0.1 (65.5% vs. 59.4%) indicates that more excitons are trapped by shallow traps and then dissociated into free carriers, and the decreased τ2 component (34.5% vs. 40.6%) is attributed to fewer excitons trapped and accumulated by deep traps [49].
Enhanced light absorption (excitons harvesting) and subsequent BIEF accelerated excitons dissociation as well as charges transport and separation can synergistically boost the photocatalytic activity. The photocatalytic H2 production performance was evaluated under visible-light irradiation (λ > 420 or 500 nm) in the presence of TEOA sacrificial agent and 3 wt% Pt cocatalyst. The reaction temperature is controlled to 5 ℃ by recirculating cooling water system. As shown in Fig. 8a, the H2 production rate is 42.0 µmol/h for 50 mg of MCN sample (λ > 420 nm). With the introduction of pyrimidine, the activity increases sharply and then decreases. BMCN 0.1 exhibits the highest rate of 150.5 µmol/h, which is approximately 3.6 times of MCN. The obvious expansion of light absorption is helpful to investigate the activity at longer wavelengths, such as greater than 500 nm (Fig. 8b). MCN presents poor activity of 0.7 µmol/h due to the weak excitons harvesting, while the activity of BMCN series samples is significantly enhanced. The highest activity is 45.5 µmol/h for BMCN 0.1 sample, which is 65 times that of MCN. Further increasing the content of pyrimidine, the activity of the samples decreases sharply.

Fig. 8c is the cyclic stability test of photocatalytic H2 production. After five cycles, the activity of BMCN 0.1 sample decays by 16.2%, indicating relatively good photostability. The apparent quantum efficiency (AQE) is measured by using different monochromatic light. The AQE value depending on the absorption wavelength is shown in Fig. 8d. The AQE of BMCN 0.1 at 420 nm is 17.8%, 4.2 times that of MCN (4.2%). At 470 nm, the AQE is as high as 6.0%, while MCN is only 0.4%. Even at 600 nm, its AQE is still 0.3%.
Since the photocatalytic activity is strongly dependent on reaction conditions, such as reaction temperature, type and content of sacrificial agent and co-catalyst, the mass of catalyst, light power and so on. The activity enhancement factor (modified activity vs. the original CCN) under different modification strategies were analysed to evaluate our modification strategies relatively objectively. As shown in Fig. 8e, different modification strategies, including morphology control [22, 50-52], defect introduction [53, 54], crystallinity optimization [55, 56], heterojunction construction [21, 57] and molecular regulation [27, 40, 58, 59], can significantly enhance the activity of CCN. Through the strategy of accelerated excitons dissociation by pyrimidine donor induced BIEF between melon chains, the activity of CCN is increased by 3.6 times, which is at a good level in reported CCN. However, we must admit that there is still a big gap between the AQE at 420 nm and the highest 65% [60]. Considering that the specific surface area (BET surface areas: 44.1 m2/g vs. 44.7 m2/g) and crystallinity (FWHM: 0.920° vs. 0.875°) of BMCN 0.1 are slightly weaker than MCN, the significantly enhanced photocatalytic activity is more reasonably attributed to the elevated EDE (51.9% vs. 21.5%). Our results establish a strategy for accelerating excitons dissociation through molecular regulation of induced BIEF, targeting the intrinsic high EBE and low EDE of polymer photocatalysts.
In summary, the pyrimidine donor is introduced into heptazine-based CCN to induce BIEF between the melon chains, which facilitates excitons dissociation, and charges transport and separation. The pyrimidine donor is revealed by XRD, FTIR, NMR, elemental analysis, XPS, DFT, etc., and the generated BIEF are well illustrated by VBM and CBM distribution, ELF, KPFM and zeta potential tests. Besides, the BIEF induced excitons dissociation are also fully investigated by steady-state PL, PH, TRPL, TD-PL, IPCE and fs-TA characterizations. As a result, this BIEF is sufficient to overcome the considerable EBE and reduce it by 22.0 meV, increasing the EDE from 21.5% to 51.9%. Our work established a strategy to promote excitons dissociation by inducing an BIEF through molecular regulation.
The authors declare that they have no known competing financial interests or personal relationships that could have appeared to influence the work reported in this paper.
This work was jointly supported by the Natural Science Foundation of China (Nos. 51874199, 22078200, 22102103), the grant from SZIIT (No. SZIIT2022KJ026), Guangdong Basic and Applied Basic Research Foundation (Nos. 2019A1515111021, 2021A1515010162), and Shenzhen Innovation Program (No. JCYJ20170818142642395).
Supplementary material associated with this article can be found, in the online version, at doi:
L. Lin, Z. Yu, X. Wang, Angew. Chem. Int. Ed. 58 (2019) 6164–6175. doi: 10.1002/anie.201809897
A.J. Heeger, Chem. Soc. Rev. 39 (2010) 2354–2371. doi: 10.1039/b914956m
S. Brazovskii, N. Kirova, Chem. Soc. Rev. 39 (2010) 2453–2465. doi: 10.1039/b917724h
K. Hummer, C. Ambrosch-Draxl, Phys. Rev. B 71 (2005) 081202. doi: 10.1103/PhysRevB.71.081202
H. Wang, S. Jiang, S. Chen, et al., Chem. Sci. 8 (2017) 4087–4092. doi: 10.1039/C7SC00307B
H.C. Kamban, T.G. Pedersen, Phys. Rev. B 100 (2019) 045307. doi: 10.1103/PhysRevB.100.045307
R. Meng, Y. Li, K. Gao, W. Qin, L. Wang, J. Phys. Chem. C 121 (2017) 20546–20552. doi: 10.1021/acs.jpcc.7b08198
J. Heckötter, M. Freitag, D. Fröhlich, et al., Phys. Rev. B 98 (2018) 035150. doi: 10.1103/PhysRevB.98.035150
G. Zhang, Y. Xu, D. Yan, et al., ACS Catal. 11 (2021) 6995–7005. doi: 10.1021/acscatal.1c00739
J. Low, J. Yu, M. Jaroniec, S. Wageh, A.A. Al-Ghamdi, Adv. Mater. 29 (2017) 1601694. doi: 10.1002/adma.201601694
Y. Yu, W. Yan, X. Wang, Adv. Mater. 30 (2018) 1705060. doi: 10.1002/adma.201705060
J. Zhang, X. Chen, K. Takanabe, et al., Angew. Chem. Int. Ed. 49 (2010) 441–444. doi: 10.1002/anie.200903886
J. Zhang, G. Zhang, X. Chen, Angew. Chem. Int. Ed. 51 (2012) 3183–3187. doi: 10.1002/anie.201106656
Z. Chen, B. Chong, N. Wells, G. Yang, L. Wang, Chin. Chem. Lett. 33 (2022) 2579–2584. doi: 10.1016/j.cclet.2021.08.118
Q. Li, C. Ren, C. Qiu, et al., Chin. Chem. Lett. 32 (2021) 3463–3468. doi: 10.1016/j.cclet.2021.05.039
T. Zhang, G. Xing, W. Chen, L. Chen, Mater. Chem. Front. 4 (2020) 332–353. doi: 10.1039/C9QM00633H
X. Zong, L. Niu, W. Jiang, et al., Appl. Catal. B: Environ. 291 (2021) 120099. doi: 10.1016/j.apcatb.2021.120099
A. Ajayaghosh, Chem. Soc. Rev. 32 (2003) 181–191. doi: 10.1039/B204251G
G. Zhang, Y. Xu, H. Mi, et al., ChemSusChem 14 (2021) 4516–4524. doi: 10.1002/cssc.202101431
Y. Zhang, J. Liu, G. Wu, W. Chen, Nanoscale 4 (2012) 5300–5303. doi: 10.1039/c2nr30948c
Z. Zeng, H. Yu, X. Quan, S. Chen, S. Zhang, Appl. Catal. B: Environ. 227 (2018) 153–160. doi: 10.1016/j.apcatb.2018.01.023
H. Ou, L. Lin, Y. Zheng, et al., Adv. Mater. 29 (2017) 1700008. doi: 10.1002/adma.201700008
L. Lin, W. Ren, C. Wang, et al., Appl. Catal. B: Environ. 231 (2018) 234–241. doi: 10.1016/j.apcatb.2018.03.009
L. Lin, H. Ou, Y. Zhang, X. Wang, ACS Catal. 6 (2016) 3921–3931. doi: 10.1021/acscatal.6b00922
M. Shalom, S. Inal, C. Fettkenhauer, D. Neher, M. Antonietti, J. Am. Chem. Soc. 135 (2013) 7118–7121. doi: 10.1021/ja402521s
M. Liu, K. Jiang, X. Ding, et al., Adv. Mater. 31 (2019) 1807865. doi: 10.1002/adma.201807865
A. Savateev, S. Pronkin, J.D. Epping, et al., ChemCatChem 9 (2017) 167–174. doi: 10.1002/cctc.201601165
G. Zhang, G. Li, Z. Lan, Angew. Chem. Int. Ed. 56 (2017) 13445–13449. doi: 10.1002/anie.201706870
B.V. Lotsch, M. Döblinger, J. Sehnert, et al., Chem. Eur. J. 13 (2007) 4969–4980. doi: 10.1002/chem.200601759
D. Chen, W. Chen, G. Zhang, et al., ACS Catal. 12 (2022) 616–623. doi: 10.1021/acscatal.1c05233
J.R. Holst, E.G. Gillan, J. Am. Chem. Soc. 130 (2008) 7373–7379. doi: 10.1021/ja709992s
J. Stoch, M. Ladecka, Appl. Surf. Sci. 31 (1988) 426–436. doi: 10.1016/0169-4332(88)90004-9
Q. Li, X. Wang, Y. Xin, et al., Sci. Rep. 4 (2014) 4725. doi: 10.1038/srep04725
S. Wang, J. Yue, W. Dong, et al., Nat. Commun. 10 (2019) 4930. doi: 10.1038/s41467-019-12938-4
G. Zhang, J. Zhang, M. Zhang, X. Wang, J. Mater. Chem. 22 (2012) 8083–8091. doi: 10.1039/c2jm00097k
S. Cao, J. Low, J. Yu, M. Jaroniec, Adv. Mater. 27 (2015) 2150–2176. doi: 10.1002/adma.201500033
G. Zhang, A. Savateev, Y. Zhao, L. Li, M. Antonietti, J. Mater. Chem. A 5 (2017) 12723–12728. doi: 10.1039/C7TA03777E
F. Yu, L. Wang, Q. Xing, et al., Chin. Chem. Lett. 31 (2020) 1648–1653. doi: 10.1016/j.cclet.2019.08.020
Y. Xu, X. He, H. Zhong, et al., Appl. Catal. B: Environ. 246 (2019) 349–355. doi: 10.1016/j.apcatb.2019.01.069
G. Zhang, Y. Xu, C. He, P. Zhang, H. Mi, Appl. Catal. B: Environ. 283 (2021) 119636. doi: 10.1016/j.apcatb.2020.119636
J. Li, L. Cai, J. Shang, Y. Yu, L. Zhang, Adv. Mater. 28 (2016) 4059–4064. doi: 10.1002/adma.201600301
J. Li, G. Zhan, Y. Yu, L. Zhang, Nat. Commun. 7 (2016) 11480. doi: 10.1038/ncomms11480
Y. Guo, W. Shi, Y. Zhu, Y. Xu, F. Cui, Appl. Catal. B: Environ. 262 (2020) 118262. doi: 10.1016/j.apcatb.2019.118262
H. Wang, X. Sun, D. Li, et al., J. Am. Chem. Soc. 139 (2017) 2468–2473. doi: 10.1021/jacs.6b12878
H. Wang, S. Jiang, S. Chen, et al., Adv. Mater. 28 (2016) 6940–6945. doi: 10.1002/adma.201601413
X. Li, Y. Wu, S. Zhang, et al., Adv. Funct. Mater. 26 (2016) 2435–2445. doi: 10.1002/adfm.201600109
L. Lin, Z. Lin, J. Zhang, et al., Nat. Catal. 3 (2020) 649–655. doi: 10.1038/s41929-020-0476-3
D.A. Wheeler, J.Z. Zhang, Adv. Mater. 25 (2013) 2878–2896. doi: 10.1002/adma.201300362
H. Sun, K. Wei, D. Wu, et al., Appl. Catal. B: Environ. 264 (2020) 118480. doi: 10.1016/j.apcatb.2019.118480
J. Kröger, A. Jiménez-Solano, G. Savasci, et al., Adv. Funct. Mater. 31 (2021) 2102468. doi: 10.1002/adfm.202102468
Z. Zeng, X. Quan, H. Yu, S. Chen, S. Zhang, J. Catal. 375 (2019) 361–370. doi: 10.1016/j.jcat.2019.06.019
W. Wang, Z. Shu, J. Zhou, et al., J. Mater. Chem. A 8 (2020) 6785–6794. doi: 10.1039/D0TA01584A
X. Liu, B. Jing, G. Lun, Chem. Commun. 56 (2020) 3179–3182. doi: 10.1039/D0CC00280A
H. Li, B. Zhu, S. Cao, J. Yu, Chem. Commun. 56 (2020) 5641–5644. doi: 10.1039/D0CC01338B
J. Yuan, Y. Tang, X. Yi, et al., Appl. Catal. B: Environ. 251 (2019) 206–212. doi: 10.1016/j.apcatb.2019.03.069
Y. Li, D. Zhang, X. Feng, Q. Xiang, Chinese J. Catal. 41 (2020) 21–30. doi: 10.1016/S1872-2067(19)63427-3
Y. Li, F. Gong, Q. Zhou, et al., Appl. Catal. B: Environ. 268 (2020) 118381. doi: 10.1016/j.apcatb.2019.118381
J. Kröger, A. Jiménez-Solano, G. Savasci, et al., Adv. Energy Mater. 11 (2021) 2003016. doi: 10.1002/aenm.202003016
G. Zhang, M. Liu, T. Heil, et al., Angew. Chem. Int. Ed. 58 (2019) 14950–14954. doi: 10.1002/anie.201908322
G. Zhang, G. Li, T. Heil, et al., Angew. Chem. Int. Ed. 58 (2019) 3433–3437. doi: 10.1002/anie.201811938

Figure 1 (a) Preparation process and (b) XRD patterns of MCN and BMCN samples. The atoms of C, N, H and O are in cyan, gray, purple and orange, respectively.

Figure 2 (a) The FTIR spectra, (b) solid-state CP/MAS 13C NMR spectra, (inset in b) elemental analysis and (c, d) high-resolution XPS of MCN and BMCN samples.

Figure 3 (a) The optimized molecular structure, (b) calculated DOS and (e, f) ELF. The VBM and CBM states in (c) MCN and (d) BMCN. The atoms of C, N, K and H are in grey, blue, purple and white, respectively.

Figure 4 (a, b) TEM and (inset in b) HR-TEM images of BMCN 0.1. (c) The lattice fringes along the yellow line in (inset of b) and (d) SAED pattern. (e) STEM image and (f-i) the corresponding elemental mappings in BMCN 0.1.

Figure 5 (a, b) KPFM potential images. (c) Surface potential profiles along the lines in (a, b), (d) zeta potential values, (e) tested BIEF (assuming the intensity of MCN to be "1"), and (f) contact angle tests.

Figure 6 (a) The steady-state PL, (inset in a) PH spectra and (b) TRPL of MCN and BMCN. (c) TD-PL spectra from 10 K to 300 K under 325 nm laser excitation. (d) Integrated PL emission intensity as a function of temperature from 10 K to 300 K. (e) IPCE and (f) schematic diagram of accelerating excitons dissociation by BIEF. The atoms of C, N, K and H are in cyan, gray, deep purple and purple, respectively.

Figure 7 (a, b) Time-wavelength-dependent TA color maps (pump at 330 nm). (c, d) TA decay kinetics probed at 660 nm.

Figure 8 The H2 production rate of MCN and BMCN samples under λ > 420 nm (a) and λ > 500 nm (b) irradiations. The recycling measurements of the H2 production (c). Wavelength-dependent AQE under monochromatic light irradiation (d). Comparison of photocatalytic activity of CCN modified by different strategies relative to corresponding original CCN (e).

 扫一扫看文章

扫一扫关注我们
 DownLoad:
 下载:
下载:
 下载:
下载: