
Figure 1.
Schematic illustration of the fabricated colorimetric aptasensor for chlorpyrifos detection.
A simple AuNPs-based colorimetric aptasensor for chlorpyrifos detection
Yuan Liu , Taotao Li , Gaojian Yang , Yan Deng , Xianbo Mou , Nongyue He

Chlorpyrifos (Chl), a typical organophosphorus pesticide, is mainly used for industry, agricultural pest control and home pests kill. The abuse of Chl could cause environmental pollution including water contamination, soil degradation, accumulation in crops and potential risk to animals [1-3]. Besides, exposure to Chl also has great threat to human health, such as affecting male reproduction [4], neurotoxicity [5], nephrotoxicity [6], inducing the proliferation of breast cancer cells [7, 8] and acute toxicity [9]. Thus, the toxicity of Chl to environment and humans lead to urgently exploit sensitive, simple, low cost and on-site rapid methods for Chl analysis and detection, since the instrumental techniques (high performance liquid chromatography [10, 11], gas chromatography [12], mass spectrometry [13], surface enhanced Raman scattering [14], etc.) have the storages of bulky to carry, expensive cost, professional operators and complexity sample pre-treatment. Besides, the solution of most pesticides are organic solvents, which would interfere the detection results, thus limits the use of immunoassay [15].
To develop a method, a target recognition unit is required. Aptamers, a class of single strand oligonucleic acids, are selected by systematic evolution of ligands by exponential enrichment (SELEX) [16-18], which possesses superior advantages over traditional recognition molecules, because of their nontoxicity, high specificity, high affinity, low cost and easier to synthesize and modify [19-22]. According to recent researches, highly specificity aptamers for diverse target substances (proteins [23], breast cancer [24], exsomes [25], cells [26, 27], ions [28, 29], bacterial [30], pesticides [31, 32], etc.) have been screened. Hence, the aptamer based sensors (aptasensors) have been widely reported [33, 34]. However, the aptasensors for small molecule targets meet more challenge because of the small molecule size and low molecular weight, which is difficult to capture [35]. Thus, there are relatively few reports on small molecule aptasensors. Nevertheless, the researchers devoted themselves to the study of easier sensors and high specificity aptamer [36-38].
Gold nanoparticles (AuNPs), have many advantages in the field of biochemical analysis because of their unique optical properties, high surface-to-volume ratio, high molar absorption coefficient, biocompatibility, non-toxicity and easy to prepare [39-41]. Among diverse AuNPs based biosensor systems, colorimetric biosensing has been widely applied for their simplicity, low cost, visible color changes, which can be considered as an alternative for on-site detection [42-44]. The ssDNAs can bind to negatively charged AuNPs through electrostatic force, thus serve as the stabilizers of AuNPs [45], in the presence of targets, the formations of ssDNA-targets would avoid adsorption from ssDNA to the surface of AuNPs, hence, the bare AuNPs immediately aggregate at high salt solution. Based on this mechanism, the AuNPs based colorimetric aptasensor become more popular [46-48].
In this article, we developed a label-free AuNPs-based colorimetric aptasensor for Chl detection, which is simple to operate and stable in organic solvents or solution containing matrix compnents. Fig. 1 is the schematic illustration for Chl detection. The Chl-aptamer, which was selected using ssDNA library immobilized SELEX [49], could stabilize the AuNPs in an optimal concentration of salt solution. In the presence of Chl, the specific Chl-aptamer will bound with Chl first, thus the exposure to certain salt solution could cause the AuNPs self-aggregate and a color change from red to blue. Besides, the established colorimetric aptasensor was used to detect tap water, cucumber and cabbage samples to validate and evaluate the accuracy as well as practical application. The tested results were quilt satisfied demonstrating the potential use of the fabricated aptasensor to Chl capture and detection in aqueous solution and real samples.
All glasswares for preparation of AuNPs were dipped thoroughly in aquaregia (3:1 (v/v) HNO3-HCl) for 24 h, then washed with double distilled water and dried for use. AuNPs with a diameter around 13.0 nm were synthesized by means of the classical citrate reduction method [50] with a slightly improvement. Briefly, 25 mL of HAuCl4 (0.01% (w/v)), 0.8 mL of 1% (w/v) fresh trisodium citrate were mixed thoroughly in the bottle. Subsequently, the bottle was put into the oven at 100 ℃ for 2 h. Concentration of AuNPs was calculated using the following formula C = A/(εb), where C is the concentration of AuNPs, A is the UV-vis absorbance of AuNPs at 520 nm, ε equals to 2.7 × 10⁸ L mol−1 cm−1, is the extinction coefficients of 13.0 nm AuNPs, b is the thickness of the measurement cuvette. To characterize the dispersion of AuNPs aqueous, UV-vis spectra and transmission electron microscopy (TEM) images were acquired.
To fabricate a Chl colorimetric aptasensor, 25 µL (1 µmol/L) of Chl-aptamer, 100 µL (3.1 nmol/L) of AuNPs and Chl with different concentrations were evenly mixed and incubated for 30 min to let the target pesticide binding with aptamer completely. Later, 35 µL (500 mmol/L) of NaCl was added to above mixture and further diluted with deionized water to 250 µL. After incubation for 15 min, the solutions were characterised by UV-vis spectrum, and the absorbance wavelength was measured in 400–700 nm. The absorbances at 650 nm (A650) and 520 nm (A520) were recorded. The ratio of A650/A520 was given. All the conditions were at room temperature.
Then, a wide range of Chl concentration from 50 nmol/L to 10 µmol/L was used to test the sensitivity of the fabricated colorimetric aptasensor. The specificity of the aptasensor was determined with different pesticides (dimethoate, dichlorphos, carbofuran, malathion, profenofos), respectively. Besides, a mixture containing all other pesticides as well as Chl was also tested. The concentration of Chl was 1 µmol/L, while the other pesticides were 10 µmol/L.
In order to validate and evaluate the accuracy as well as practical application of the constructed chlorpyrifos colorimetric aptasensor, the cucumber, cabbage and tap water samples were tested. Tap water was collected from our laboratory, and the cucumber and cabbage were purchased from the local market. The pre-treatment procedure details are as follows: tap water was filtered with a 0.22 µm membrane (Millipore), then spiked with different concentrations of Chl. Cucumber and cabbage were washed, dried at room temperature, then sprayed with various concentrations of Chl and kept at room temperature for 12 h, later the sampling stick evenly scraped the sample surface several times, and solved by 1 mL deionized water.
According to our previous works [49], we selected a highly binding Chl-aptamer. After eight selection rounds, a high enrichment ssDNA pool for Chl was obtained, the retention rates of each round were shown in Fig. S1 (Supporting information). We can see that with the increase in screening pressure, the retention rate of positive selection reaches 4.49% after the eighth round. The secondary structure of the selected Chl-aptamer was shown in Fig. S2 (Supporting information), which is composed of stem-loop and hairpin structures. The Kd curve of the Chl-aptamer was shown in Fig. S3 (Supporting information), showing that the Chl-aptamer has a low dissociation constant (Kd = 58.59 ± 6.08 nmol/L), which means highly binding to Chl.
The experiment conditions are important for developing a sensitive colorimetric aptasensor, such as the concentration of NaCl, the incubation time between Chl and aptamer, and the incubation time of NaCl. As shown in Fig. S4A (Supporting information), the concentrations of NaCl from 20 mmol/L to 100 mmol/L were tested. The A650/A520 value of AuNPs solution increased with the increasing in NaCl concentration, while the A650/A520 value of AuNPs with aptamer solution almost keep the same during the concentration of NaCl increasing to 70 mmol/L, which means the proper concentration of NaCl could not aggregate the aptamer stabilized AuNPs, but a higher concentration of NaCl could. Besides, for the AuNPs in the system with or without aptamer, the difference of A650/A520 value reaches the maximum after incubating with 70 mmol/L NaCl. Thus, we chose 70 mmol/L NaCl for further study. In the incubation time optimization experiments, 1 µmol/L Chl was used. From Fig. S4B (Supporting information), we can see the A650/A520 value was increased with the increase in incubation time first, then stabilized after incubating for 30 min, indicating that the binding interaction between Chl and aptamer reached saturation at 30 min. From Fig. S4C (Supporting information), we can see the optimal incubation time of NaCl is 15 min.
AuNPs in different systems were characterized with UV-vis spectrum and TEM images. As shown in Fig. 2A, we can see that in the system of AuNPs in 70 mmol/L NaCl, the A520 hugely decreased and the A650 increased (red line), meaning the aggregation of AuNPs. The Chl-aptamer with random coil structure can be adsorbed on the surface of AuNPs by electrostatic interaction thus can protect AuNPs from ion-induced aggregation and, therefore, AuNPs are more stable in salt solution [51]. Once the AuNPs were incubated with aptamer (purple line), the proper concentration of NaCl could not make the AuNPs aggregate, which means the Chl-aptamer could stabilize the AuNPs dispersion. In the presence of Chl, the strong interaction between Chl and aptamer could make the conformation of aptamer change, and the formation of aptamer-target complex could avoid the adsorption from aptamer to the surface of AuNPs. Hence, the unprotected AuNPs would aggregate in salt solution and the extinction peak was shifted to a longer wavelength. Thus, a decrease of A520 and an increase of A650 were observed, leading an increase in A650/A520 (blue line). As mentioned in the study of Sato and co-workers [52], this aggregation phenomenon is driven by the London-van der Waals attractive force between AuNPs, when the repulsive interaction is greatly reduced by the formation of duplexes on their surface. The attractive force works from a distance and leads to the aggregation. Meanwhile, Figs. 2B–E are the corresponding TEM images of each systems.

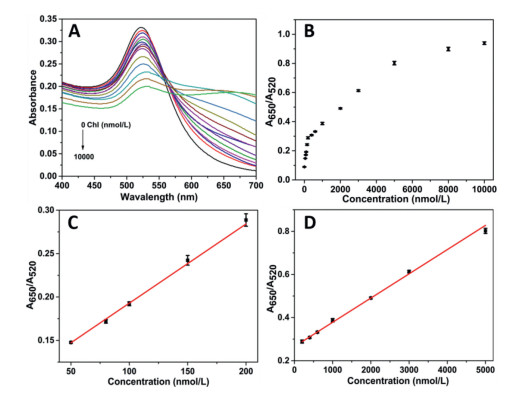
Subsequently, the label-free AuNPs based colorimetric aptasensor was established for Chl standard solution (0–10 µmol/L) analysis. The UV-vis spectra were shown in Fig. 3A, we can see that with the increase in Chl concentration, the A520 value kept decreasing, while the A650 value also kept increasing. The scatterplot of the A650/A520 values with different concentrations of Chl was shown in Fig. 3B, it was shown that the A650/A520 value increased significantly at the concentration of Chl from 0 to 5 µmol/L, and slowed down after the Chl concentration kept increasing to 10 µmol/L. It is worth mentioning that there are two linear relationships between A650/A520 value and the concentration of Chl. At low concentration range of Chl (ranging from 50 nmol/L to 200 nmol/L), the linearization equation is y = 0.102 + 9.126 × 10⁻⁴C (R2 = 0.996) (Fig. 3C), while at high concentration range of Chl (ranging from 200 nmol/L to 5000 nmol/L), the linearization equation is y = 0.266 + 1.124 × 10⁻⁴C (R2 = 0.997) (Fig. 3D). The limit of detection (LOD) is as low as 14.46 nmol/L, which is given by the equation: LOD = 3 × SB/b, where SB is the standard deviation of twenty independent blank samples and b is the sensitivity of the calibration graph [29].
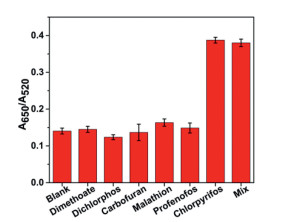
The specificity of the fabricated colorimetric aptasensor was evaluated by comparing the A650/A520 value of solutions containing 1 µmol/L chlorpyrifos with other pesticides at concentrations 10 times higher, such as dimethoate, dichlorphos, carbofuran, malathion, and profenofos. A water solution was used as the blank. As shown in Fig. 4, the A650/A520 value showed the ability of the current aptasensor to specifically detect chlorpyrifos even in a mixture, while a negligible change of A650/A520 value in detecting other pesticides. The result indicates this aptasensor could specifically detect chlorpyrifos among other pesticides.
The sample detection results were shown in Table 1. It was confirmed that the developed colorimetric aptasensor displays excellent capability for the accurate detection of chlorpyrifos in tap water, cucumber and cabbage samples. The excellent recovery values with acceptable RSD values below 5% demonstrates that the proposed aptasensor could be applied to detecet chlorpyrifos in real samples.
In summary, we fabricated a label-free AuNPs based colorimetric aptasensor for sensitive detection of Chl. The Chl-aptamer was obtained using ssDNA library immobilized streptavidin-magnetic beads SELEX technique. The fabricated colorimetric aptasensor exhibits excellent sensitivity for Chl detection with the limit of detection as low as 14.46 nmol/L. Furthermore, the real samples detection showed satisfying results with excellent recovery values between 96.2% and 105.6% and acceptable RSD values below 5%, demonstrating the developed aptasensor can serve as a promising candidate for Chl detection in the area of biosensors, which also showed a great potential in simple, cheap and rapid detection of Chl.
The authors declare that they have no known competing financial interests or personal relationships that could have appeared to influence the work reported in this paper.
This work was financially supported by the National Key Research and Development Program of China (No. 2018YFC1602905), and the National Natural Science Foundation of China (Nos. 61871180 and 61527806) for the financial supports.
Supplementary material associated with this article can be found, in the online version, at doi:10.1016/j.cclet.2021.11.025.
S.Y. Foong, N.L. Ma, S.S. Lam, et al., J. Hazard. Mater. 400 (2020) 123006. doi: 10.1016/j.jhazmat.2020.123006
X. Huang, H. Cui, W. Duan, Ecotox. Environ. Safa. 200 (2020) 110731. doi: 10.1016/j.ecoenv.2020.110731
A.P. Mestre, P.S. Amavet, I.S. Sloot, et al., Chemosphere 252 (2020) 126433. doi: 10.1016/j.chemosphere.2020.126433
X. Zhang, W. Cui, K. Wang, et al., Environ. Res. 188 (2020) 109785. doi: 10.1016/j.envres.2020.109785
S.W. Todd, E.W. Lumsden, Y. Aracava, et al., Neuropharmacology 180 (2020) 108271. doi: 10.1016/j.neuropharm.2020.108271
M.Y. Xu, P. Wang, Y.J. Sun, et al., Chem. Res. Toxicol. 32 (2019) 122-129. doi: 10.1021/acs.chemrestox.8b00219
M. Lasagna, M.S. Hielpos, C. Ventura, et al., Ecotox. Environ. Safa. 205 (2020) 111312. doi: 10.1016/j.ecoenv.2020.111312
P. Moyano, J. Garcia, J.M. Garcia, et al., Chemosphere 251 (2020) 126426. doi: 10.1016/j.chemosphere.2020.126426
J. Zhang, L. Liu, L. Ren, et al., J. Hazard. Mater. 334 (2017) 121-131. doi: 10.1016/j.jhazmat.2017.03.055
L. He, X. Luo, H. Xie, et al., Anal. Chim. Acta 655 (2009) 52-59. doi: 10.1016/j.aca.2009.09.044
F. Darvishnejad, J.B. Raoof, M. Ghani, Anal. Chim. Acta 1140 (2020) 99-110. doi: 10.1016/j.aca.2020.10.015
P. Balsini, H. Parastar, J. Sep. Sci. 42 (2019) 3553-3562. doi: 10.1002/jssc.201900823
Y. Lee, Y.J. Kim, M.S.I. Khan, et al., J. Sep. Sci. 42 (2020) 4047-4057.
C. Zhai, T.F. Xu, Y.K. Peng, et al., Spectrosc. Spectr. Anal. 36 (2016) 2835-2840.
L. Fan, G. Zhao, H. Shi, M. Liu, Z. Li, Biosens. Bioelectron. 43 (2013) 12-18. doi: 10.1016/j.bios.2012.11.033
H. Wang, H. Cheng, J. Wang, et al., Talanta 154 (2016) 498-503. doi: 10.1016/j.talanta.2016.04.005
A. Sinha, P. Gopinathan, Y.D. Chung, et al., Biosens. Bioelectron. 122 (2018) 104-112. doi: 10.1016/j.bios.2018.09.040
Y. Luo, J. Wang, L. Yang, et al., Sens. Actuators B: Chem. 276 (2018) 128-135. doi: 10.1016/j.snb.2018.08.105
R. Huang, L. He, S. Li, et al., Nanoscale 12 (2020) 2445-2451. doi: 10.1039/C9NR08747H
Z.K. Guo, Y. Liu, N.Y. He, et al., Chin. Chem. Lett. 32 (2021) 40-47. doi: 10.1016/j.cclet.2020.11.061
Z. Xi, R. Huang, Z. Li, et al., ACS Appl. Mater. Inter. 7 (2015) 11215-11223. doi: 10.1021/acsami.5b01180
M. Liu, Z. Yang, B. Li, et al., Food Chem. 339 (2021) 128059. doi: 10.1016/j.foodchem.2020.128059
H. Li, S. Xing, J. Xu, et al., Talanta 221 (2021) 121670. doi: 10.1016/j.talanta.2020.121670
M. Liu, L. Xi, T. Tan, et al., Chin. Chem. Lett. 32 (2021) 1726-1730. doi: 10.1016/j.cclet.2020.11.072
R.R. Huang, L. He, Y.Y. Xia, et al., Small 15 (2019) 1900735. doi: 10.1002/smll.201900735
Z. Guo, C. Wang, S. Li, et al., J. Nanosci. Nanotechnol. 20 (2020) 3373-3377. doi: 10.1166/jnn.2020.17424
T. Li, J. Yang, Z. Ali, et al., Sci. China Chem. 60 (2017) 370-376. doi: 10.1007/s11426-016-0159-2
J. Pan, Q. Li, D. Zhou, et al., Talanta 189 (2018) 370-376. doi: 10.1016/j.talanta.2018.07.024
Y. Liu, Y.X. Lai, G.J. Yang, et al., J. Biomed. Nanotechnol. 13 (2017) 1253-1259. doi: 10.1166/jbn.2017.2424
S. Chen, X. Yang, S. Fu, et al., Food Control 115 (2020) 107281. doi: 10.1016/j.foodcont.2020.107281
M. Jiang, C. Chen, J. He, et al., Food Chem. 307 (2020) 125534. doi: 10.1016/j.foodchem.2019.125534
Y. Qi, Y. Chen, F. Xiu, et al., Sens. Actuators B: Chem. 304 (2020) 127359. doi: 10.1016/j.snb.2019.127359
H. Shen, W. Deng, Y. He, et al., Biosens. Bioelectron. 168 (2020) 112516. doi: 10.1016/j.bios.2020.112516
Y. Yang, Y. Yin, X. Li, et al., Sens. Actuators B: Chem. 319 (2020) 128250. doi: 10.1016/j.snb.2020.128250
Q. Ma, Y. Wang, J. Jia, et al., Food Chem. 249 (2018) 98-103. doi: 10.1016/j.foodchem.2018.01.022
N. Duan, S. Qi, Y. Guo, et al., LWT Food Sci. Technol. 134 (2020) 110017. doi: 10.1016/j.lwt.2020.110017
M. Liu, A. Khan, Z. Wang, et al., Biosens. Bioelectron. 130 (2019) 174-184. doi: 10.1016/j.bios.2019.01.006
N. Duan, S. Wu, X. Chen, et al., J. Agric. Food Chem. 61 (2013) 3229-3234. doi: 10.1021/jf400767d
J. Yi, P. Wu, G. Li, et al., Microchim. Acta 186 (2019) 711. doi: 10.1007/s00604-019-3827-5
L. He, R.R. Huang, P.F. Xiao, et al., Chin. Chem. Lett. 32 (2021) 1593-1602. doi: 10.1016/j.cclet.2020.12.054
H. Shi, G. Zhao, M. Liu, et al., J. Hazard. Mater. 260 (2013) 754-761. doi: 10.1016/j.jhazmat.2013.06.031
A.N. Berlina, A.V. Zherdev, S.M. Pridvorova, et al., J. Nanosci. Nanotechnol. 19 (2020) 5489-5495.
K. Abnous, N.M. Danesh, M. Ramezani, et al., Microchim. Acta 185 (2018) 216. doi: 10.1007/s00604-018-2752-3
J. Jia, S. Yan, X. Lai, et al., Food Anal. Methods 11 (2018) 1668-1676. doi: 10.1007/s12161-017-1144-3
Y. Liu, T. Li, C. Ling, et al., Chin. Chem. Lett. 30 (2019) 2359-2362. doi: 10.1016/j.cclet.2019.10.033
C. Xu, Y. Ying, J. Ping, Microchim. Acta 186 (2019) 448. doi: 10.1007/s00604-019-3574-7
M. Qi, C. Tu, Y. Dai, et al., Anal. Methods 10 (2018) 3402-3407. doi: 10.1039/C8AY00713F
L. Qiao, H. Wang, J. He, et al., Food Chem. 340 (2021) 128181. doi: 10.1016/j.foodchem.2020.128181
Y. Liu, G.J. Yang, T.T. Li, et al., Chin. Chem. Lett. 32 (2021) 1957-1962. doi: 10.1016/j.cclet.2021.01.016
G. Frens, Nat. Phys. Sci. 241 (1973) 20-22. doi: 10.1038/physci241020a0
Y.S. Kim, J.H. Kim, I.A. Kim, et al., Biosens. Bioelectron. 26 (2010) 1644-1649. doi: 10.1016/j.bios.2010.08.046
K. Sato, K. Hosokawa, M. Maeda, J. Am. Chem. Soc. 125 (2003) 8102-8103. doi: 10.1021/ja034876s

Figure 1 Schematic illustration of the fabricated colorimetric aptasensor for chlorpyrifos detection.

Figure 2 (A) UV-vis spectra of AuNPs in different systems. From up to down is AuNPs (black line), AuNPs+aptamer+NaCl (purple line), AuNPs + aptamer + Chl + NaCl (blue line), AuNPs + NaCl (red line), respectively. TEM images of AuNPs in different systems. (B) AuNPs, (C) AuNPs + aptamer + NaCl, (D) AuNPs + aptamer + Chl + NaCl, (E) AuNPs + NaCl. Scale bar: 100 nm.

Figure 3 (A) UV-vis spectra of different concentration of Chl (0, 50, 80, 100, 150, 200, 400, 600, 1000, 2000, 3000, 5000, 8000, 10, 000 nmol/L); (B) Scatterplot of A650/A520 value at different concentration of Chl; (C) The linear relationship between the A650/A520 value and low concentration of Chl (50–200 nmol/L); (D) The linear relationship between the A650/A520 value and high concentration of Chl (200–5000 nmol/L).

Figure 4 The selectivity of the proposed colorimetric aptasensor, Blank means without any pesticide; Mix means the solution contains 1 μmol/L Chl and 10 μmol/L of dimethoate, dichlorphos, carbofuran, malathion, profenofos, respectively.

 扫一扫看文章

扫一扫关注我们
 DownLoad:

 下载:
下载:
 下载:
下载: