
Figure 1.
Molecular structure of the IM and the list of organic acids used in this study.
A series of stable, metastable and unstable salts of Imatinib with improved solubility
Zheng-Yu Fang , Bao-Xi Zhang , Wen-Hui Xing , Hong-Li Jia , Xue Wang , Ning-Bo Gong , Yang Lu , Guan-Hua Du

Imatinib (IM) is a specific small-molecule inhibitor of the Bcr-Abl protein tyrosine kinase, platelet derived growth factor and c-KIT tyrosine kinases [1-3]. The drug was formerly referred to as STI571 or CGP57148B by Novartis Pharmaceuticals (Switzerland) [4]. It was marketed as a salt form, called as Glivec®, GleevecTM (Imatinib mesylate) and approved by the US Food and Drug Administration (FDA) in 2001 [5] and described as the "magic bullet" on the cover of TIME magazine. Gleevec was successfully used for treating chronic myeloid leukaemia (CML) [6] and gastrointestinal stromal tumors (GIST) [7]. Imatinib can be used not only as an apoptosis inducer, a tyrosine kinase inhibitor and an antineoplastic agent, but also be used for treating other diseases, such as aggressive systemic mastocytosis [8], fibrotic diseases (including lung [9], liver [10], skin [11]), tuberculosis, pulmonary arterial hypertension [12, 13], autoimmune diseases [14, 15]. According to recent published literature, Imatinib maybe has the potential beneficial effect on COVID-19 [16-18].
More than 40% of marketed drugs and nearly 90% of the active pharmaceutical ingredients (APIs) show poor water solubility [19]. Therefore, one of the major challenges of the current pharmaceutical industry is how to improve the water solubility of the bioactive compounds. Various strategies are used to modify the physicochemical properties suitable for formulation design of the poorly soluble drug candidates. Among those methods, salt formation is an effective method of improving solubility and dissolution rate of acidic and basic pharmaceutical materials [20, 21]. The imatinib free base is practically insoluble at the uncharged form and the solubility of the imatinib in the pure water is 21.8 µg/mL at 37 ℃ [22]. Due to the formation of mesylate, the aqueous solubility of imatinib increases significantly at pH < 5.5. However, the solubility of the salt decreases with the increasing pH. It is still poorly soluble or insoluble at neutral and alkaline pH.
The objective of this study was to screen and prepare a series of new salts of imatinib using different methods. Two stable salts, one metastable salt and two unstable salts of Imatinib were discovered. Single-crystal X-ray diffraction (SCXRD) was used to explore the three-dimensional space structure of the new compounds. In addition, the physicochemical properties were characterized using different techniques including powder X-ray diffraction (PXRD), Fourier transform infrared (FT-IR), differential scanning calorimetry (DSC) and thermogravimetric (TG) analyses. The solubility and stability of the solid were also evaluated, and three salts significantly improved the solubility of Imatinib in water and pH 6.8 buffer, respectively.
Imatinib was commercially obtained from Wuhan Yuancheng Technology Development Co., Ltd. (Wuhan, China), malonic acid (MA), fumaric acid (FA), citric acid (CA) and citric acid monohydrate (CA-H2O) were purchased from Sinopharm Chemical Reagent Co., Ltd. (Beijing, China). All other chemicals used were of analytical reagent grade and used without further purification.
Slurry and liquid-assisted grinding method were used to prepare of bulk samples of the Imatinib malonate (S1), Imatinib fumarate methanol hydrate (S2), Imatinib citrate methanol hydrate (S3) and Imatinib citrate methylate (S4). Equimolar amounts of Imatinib and malonic acid, fumaric acid, citric acid monohydrate and citric acid were suspended in ethanol or methanol, respectively. The suspensions were agitated at 300 g for 12 h at room temperature, and the solid sediment were filtered and dried at 40 ℃ for 6 h Solvent evaporation method was used to prepare the crystals for single crystal X-ray diffraction. A certain amount of the obtained powder was dissolved in ethanol or methanol or methanol water mixed solvent and allowed to stand at 20 ℃ to obtain the suitable crystals of S1, S2, S3 and S4.
Thermal transformation method was used to preparation of bulk samples of the Imatinib citrate (S5). S3 or S4 samples were ground into powder at first and put in the glass dish in oven and heating at 105 ℃ for 30 min, and then cooling to room temperature to obtain S5.
Powder X-ray diffraction (PXRD) data were collected using a D/Max 2550 powder X-ray diffractometer with CuKα radiation, with a tube voltage of 40 kV and tube current of 150 mA. 50 mg of powder was gently pressed on a glass slide to afford a flat surface and scanned in the range from 2θ 3° to 40° at a rate of 8°/min.
Suitable crystals of S1, S2, S3 and S4 were selected for the single-crystal X-ray diffraction (SCXRD) experiments on a microMax 002+ diffractometer with CuKα radiation (λ = 1.54187 Å) at a temperature of 100(2) K. The program suite CrystalClear [23] was used for data collection, cell refinement and data reduction. The structures were solved by direct methods [24] and refined with a fullmatrix least-squares analysis using SHELX-2018 [25] on F2.
The Fourier transform infrared (FTIR) spectra of starting material and salts were recorded in the range of 4000 cm-1 to 650 cm-1 by a PE Spectrum 400 infrared spectrometer with an ATR device at room temperature. Samples (powders or crystal particles gently grinding in an agate mortar) were put on the diamond plate, and spectra were acquired accumulating 16 scans at 4 cm-1 resolution.
Differential scanning calorimetry and thermogravimetric analyses. The preliminary thermal characterization of the starting material and salts were carried out by using a differential scanning calorimeter (Mettler Toledo DSC1 500 module) and the thermogravimetry instrument (Mettler Toledo TGA/DSC 700 module) separately, at a heating rate of 10 ℃/min under N2 (flow rate of 20 mL/min) used as protective and purge gas.
The stability of IM and the new salts has been studied under three accelerate conditions for 10 days, including 60 ℃; 25 ℃/90% RH; 25 ℃ and 4500 lx light, and normal condition (25 ℃/40% RM) for 6 months. The samples were stored under four conditions inside a drug stability test instrument (SHH-150SD), and periodically evaluated by PXRD.
The equilibrium solubility of IM raw materials and three stable salts were determined by the shake-flask method at 37 ℃. An excess of samples was added to 4 mL of pure water and different buffer media pH 1.2, 4.5, 6.8 maintained by hydrochloric acid, acetate, phosphate buffers. Dissolution measurements were carried out using basket method in above media, respectively. The amount of powder samples is 30 mg (equivalent to imatinib) and the particle size of the sample can pass through a 200 mesh sieve. Dissolution experiments were performed in triplicate. And after solubility and dissolution experiments, the pH of media was measured and the residual solids were tested by PXRD. The solubility measurements were conducted by the high-performance liquid chromatography (HPLC) method by an Agilent 1260 HPLC instrument (Agilent Technologies, USA). The chromatographic condition [26] was: XB-C18 5 µm (250 mm × 4.6 mm) column. The mobile phase consisted of acetonitrile and 0.05 mol/L potassium dihydrogen phosphate water solution (23:77, v/v). The flow rate was set at 1.0 mL/min and the injection volume was 10 µL. The absorbance was measured at a wavelength of 272 nm with column temperature setting at 30 ℃.
Within this work, five imatinib new salts were successfully prepared by slurry, liquid-assisted grinding and high temperature transformation method, reacting Imatinib with malonic acid, fumaric acid, citric acid and citric acid monohydrate (Fig. 1). The IM molecule is a base compound with pKa 8.07, 3.73, 2.56, 1.52 for the different nitrogen group. Thus, to obtain salts, MA (pKa 2.86, 5.70), FA (pKa 3.03, 4.44), and CA (pKa 3.10, 4.70, 5.40) were selected as the strong acids, which is consistent with ΔpKa > 3 between API and coformers.
Salt IM-MA crystallizes in the C 2/c monoclinic space group, with one molecule of cationic Imatinib (IM+) and one molecule of anionic malonic acid (MA-) per asymmetric unit. Crystal data and structural refinement parameters are given in Table 1. The salt formation was also identified by the bond length difference between two C-O bonds in the carboxylate group. The ΔdC in the salt-forming carboxyl group obvious lower than that the unsalted carboxyl groups indicates the transfer of proton and the formation of salt [27-29]. The details of ΔdC in this work were shown in Table S1 (Supporting information). In the crystal structure, a salt bond via N1-H1⋯O2 (2.658 Å, -x + 2, -y + 1, -z + 1) and an intramolecular hydrogen bond O5-H5⋯O3 (2.449 Å) within the two hydroxyl groups of MA molecular were found. The adjacent IM molecules are further connected through intermolecular hydrogen bonds N3-H3⋯N7 (3.070 Å, x, y + 1, z) and result in wavy along [010] direction (Fig. 2a).

Salt cocrystal IM-FA methanol hydrate crystallizes in monoclinic system, P 21/c space group. It is interesting that there are two types of FA, one is the anionic FA (FA-), and the other is neutral FA molecule. One cationic IM (IM+), half of the FA- half of the neutral FA molecule, one methanol and one water molecules contained in the asymmetric unit. IM+ and FA- salt formation via N1-H1⋯O3 (2.656 Å, x, -y + 1/2, z - 1/2). Methanol and water molecules are involved into the intermolecular hydrogen bond O7-H7⋯O2 (2.702 Å, x, y, z), O6-H6⋯O7 (2.706 Å, x, y, z), O7-H7B⋯O6 (2.744 Å, x, 3/2 - y, 1/2 + z) to generate a branch structure. Without the help of the solvent, half of the neutral FA molecule and the IM form R22(8) motif in the molecular packing. Similar to IM-MA, the adjacent IM molecules are further connected with the intermolecular hydrogen bond N3-H3⋯N7 (3.055 Å, x, y - 1, z) to generate a 1D wavy (Fig. 2b).
Salt IM-CA methanol hydrate S3 crystallizes in triclinic system, P-1 space group and Z = 2. There are two cationic IM (IM+), two anionic CA (CA-), 1.68 methanol molecules and 2.139 water molecules in the asymmetric unit. IM+ and CA- salt formation via N1A-H1⋯O13A (2.722 Å) and N1B-H1'⋯O5 (2.749 Å). Methanol and water molecules are involved into the intermolecular hydrogen bond O19A-H19b⋯O8A (2.637 Å, -x + 1, -y + 1, -z + 1), O11-H11'⋯O5 (2.850 Å, x, y, z + 1), O16-H16'⋯O20 (2.700 Å) to generate a bead structure. IM molecule and CA molecule form R22(8) motif in the molecular packing via N4A-H4⋯O2 (2.911 Å, x-1, y, z), O3-H3AA⋯N6A (2.731 Å, x + 1, y, z), N4B-H4'⋯O9 (2.884 Å, -1 + x, y, z), O10-H10'⋯N6B (2.745 Å, x-1, y, z). The adjacent IM molecules form as loop cycle via N3A-H3⋯N7B (2.984 Å) and N3B-H3'⋯N7A (2.994 Å) (Fig. 2c).
Salt IM-CA methylate S4 also crystallizes in triclinic system, P -1 space group and Z = 2. There are three cationic IM (IM+), three anionic CA (CA-), and four methanol molecules in the asymmetric unit. IM+ and CA- salt formation via N1A-H1NA⋯O13 (2.698 Å), N1B-H1NB⋯O5 (2.703 Å) and N1C-H1NC⋯O20 (2.755 Å). IM molecules are associated with CA via R22(8) involving N4A-H2NA⋯O21 (2.917 Å) and O22-H22O⋯N6A (2.729 Å) hydrogen bonds (motif1, Fig. 2d). Adjacent two CA molecules form R22(8) involving O18-H18O⋯O13 (2.917 Å, x, y-1, z) and O11-H11O⋯O20 (2.789 Å, x, y + 1, z) hydrogen bonds (motif2, Fig. 2d). Adjacent two CA molecules and two methanol molecules form a cycle in the cell involving O23-H23O⋯O14 (2.758 Å, -x, -y + 1, -z + 2) and O15-H15O⋯O23 (2.552 Å, x, y + 1, z) (motif3, Fig. 2d).
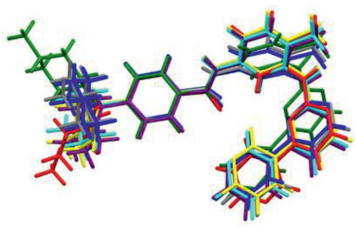
The conformation of IM in the unit cell has significantly difference in the four salts. The twist angle ψ1(C1-N2-C5-C6), ψ2(N2-C5-C6-C7), ψ3(C8-C9-C12-N3), ψ4(C12-N3-C13-C14), ψ5(C16-C17-N4-C19), ψ6(C17-N4-C19-N5), ψ7(N5-C20-C23-C24), were shown in Table 2. The overlap of the four salts was shown in Fig. 3.
PXRD has been used to identify the new salts. The patterns overlay the experimental patterns, the calculated patterns from the crystal structure data, and those of the starting materials (Fig. 4). In all cases, the different peaks indicated the formation of the new phase, and the agreement with the experimental patterns and the simulated patterns indicated that the high identity and homogeneity samples were obtained.

The starting materials and salts exhibit quite different thermal properties (Fig. 5a). A summary with the endothermic peaks of the salt and raw materials were shown in Table 3. The thermal analysis of the salt S1 and S5 only showed melting point at 174.40 ℃ and 181.37 ℃, which meant S1 and S5 were all solvent free substance. S2, S3, S4 showed solvent peaks 79.53 ℃, 70.24 ℃ and 70.07 ℃, respectively, which was consistent with the SCXRD results. The analogous endothermic peak temperatures of solvent molecule in S3 and S4 might be attribute to the analogous hydrogen bond energies in those two salts. From the correlation between melting point and energy, it is reasonable that high melting point means low energy and low solubility. After salt formation, the new salts all have lower melting point than IM, which indicates the better solubility.

Meanwhile, the TG patterns also reflect the thermodynamic behavior of IM salts (Fig. 5b and Table S2 in Supporting information). TGA data for S1 and S5 show no mass loss below the melting temperature, consistent with the assignment of S1, S5 as anhydrous material. For S2, a mass loss step of ca. 4.86% is observed between 60 ℃ and 100 ℃, which corresponding to the loss of methanol molecules in S2. For S2, S3 and S4, obvious mass loss of solvate before melting point reveals that solvent molecule exists in the crystal lattice, which was also evidenced by the SCXRD analysis.
The FT-IR spectra technique is a helpful tool to detect the formation of new salts from the corresponding raw materials. The proton transformation between IM, CCF and the shifting of the characteristic peaks evidence the intermolecular interactions can be found in the IR spectra. In the present study, the details of the characteristic peaks of the salts, pure IM and CCF were recorded in Fig. 6. For pure IM, the characteristic peaks at 1646 and 3280 cm-1 represented C=O and N-H stretching vibrations, respectively. For pure CCF, the characteristic peaks at 1695 cm-1 (MA), 1660 cm-1 (FA), 1692 cm-1 (CA-H2O) and 1699 cm-1 (CA) represented C=O stretching vibrations, respectively. Comparatively, the characteristic peak 1646 cm-1 remained unchanged, the characteristic peak 3280 cm-1 widened and the C=O stretching vibrations were shifted to higher frequency 1699–1713 cm-1 in the IR pattern of the new salts. This can be used as the evidence that there are intermolecular interactions between IM and CCF.

IM, S1, S2 and S5 were found to be stable after 6 months of stability studies at 25 ℃/40% RH. In addition, IM, S1, S5 retained stable under all the studied conditions. S2 was metastable under 25 ℃/90% RH and 60 ℃ for 10 days, it had a tendency to transform to amorphous state. S3 and S4 were unstable under ambient conditions, they would transform to S5 quickly (Fig. S1 and Table S3 in Supporting information). Therefore, S1 and S5 are stable, S2 is metastable, and S3 and S4 are unstable.
Solubility and dissolution are vital physicochemical parameters for APIs because they influence the bioavailability of drugs. The equilibrium solubility of IM, S1, S2 and S5 in pure water was 21.8, 390, 981.7, 2650.8 and 3511.7 µg/mL, respectively (Table S4 in Supporting information). IM undergoes a crystal form transformation in pH 1.2 and 4.5 which can be explained by the fact that it serving as a strong base may be salt with hydrochloric acid or acetic acid in the media. S1 sample performs a great improvement of the solubility and keeps stable in the four media. As for S2, it undergoes transformation in four media. S5 is stable during the solubility experiments and can significantly improve the solubility of the IM (Fig. S2 in Supporting information).
An examination of the dissolution profiles (Fig. 7) indicates that salts S1, S2 and S5 all had a more than 20 folds of solubility and a fast dissolution rate improved in pure water and pH 6.8 phosphate buffer. However, the salts S1, S2 and S5 show no significant difference with the raw material in pH 1.2 buffer or pH 4.5 buffer. The similarity factor f is employed to compare the dissolution profiles. A high f value corresponds to more similarity between the profiles of salts and the raw material, with a threshold of 50. The factor f of salts compared with IM was shown in Table S5 (Supporting information). Therefore, the dissolution profiles of S1, S2 and S5 are dissimilar to that of IM in pure water and pH 6.8 phosphate buffer.

It can be seen that the solubility and dissolution rate of IM was increased obviously after salt formation. After salted with organic acid, IM was protonated into IM+ and the melting point of new salts of IM decreased compared with IM, which improved the hydrophilicity and free energy of the IM, all those promote the solubility of IM.
In conclusion, pharmaceutical salt formation is the most preferred and effective method to enhance the physicochemical properties of APIs such as solubility, dissolution rate, bioavailability, stability, compressibility and permeability. The aim of the study was to design and synthesize a series of new salts to improve the solubility of IM. Two stable salts S1 and S5, one metastable salt S2 and two unstable salts S3 and S4 were prepared, and their crystal structures (except S5) were confirmed by single-crystal X-ray diffraction. The SCXRD showed that all the four salts had some analogous arrangement. Cationic IM+ and anionic CCF- formed salt via amino N1 and carboxyl O. All the adjacent IM molecules linked as 1D wavy by the intermolecular hydrogen bond N3-H3⋯N7. All the solvates had a R22(8) motif according to the intermolecular hydrogen bond N-H⋯O and O-H⋯N. Moreover, all the solvent molecules were involved into the intermolecular hydrogen bond to maintain the stable spatial arrangement. However, the conformation of IM in the unit cell had significantly difference in the four salts. PXRD, DSC, IR and TGA were all used to characterize the novel salts. All the salts S1, S2 and S5 exhibited remarkable solubility improvement than pure IM in pure water and pH 6.8 phosphate. Taking into consideration the improved dissolution rate of the novel salts, the good stability and pharmaceutically acceptable S1 and S5 salts are the promising candidate for oral drug formulation.
The authors declare that they have no known competing financial interests or personal relationships that could have appeared to influence the work reported in this paper.
We thank CAMS Innovation Fund for Medical Sciences (Nos. 2017-I2M-1–010, 2020-I2M-1–003), Key National Research and Development Program (No. 2016YFC1000901), Construction and Application of Technology Integration System for Efficient Identification of Natural/Effective Active Small Molecules (No. 2018ZX09711001–001) and National Science and Technology Major Project: Resource Library of Traditional Chinese Medicine Component (No. 2019ZX09735002) for the financial support.
Supplementary material associated with this article can be found, in the online version, at doi:10.1016/j.cclet.2021.10.056.
V.S. Barta, N.N. Uppal, J.M. Pullman, A.T. Levy, K.D. Jhaveri, J. Onco-Nephrol. 1 (2017) 57-61. doi: 10.5301/jo-n.5000008
H. Sato, K. Sugimura, M. Miura, et al., Tohoku J. Exp. Med. 247 (2019) 69-73. doi: 10.1620/tjem.247.69
A. Eversman, S. Fatima, K. Honda, M. Beveridge, Skin J. Cutaneous Med. 5 (2021) 75-77. doi: 10.25251/skin.5.1.18
C.F. Waller, Imatinib Mesylate, in: U.M. Martens (Ed.), Small Molecules in Oncology, Springer Berlin Heidelberg, Berlin, Heidelberg, 2014, pp. 1-25.
R.A. Okimoto, R.V. Etten, Curr. Opin. Hematol. 18 (2011) 89-97. doi: 10.1097/MOH.0b013e32834399a5
A. Nasser, A. Hussein, C. Chamba, et al., Blood Adv. 5 (2021) 1403-1411. doi: 10.1182/bloodadvances.2020002973
M. Prause, S. Niedermoser, C. Wängler, et al., Nucl. Med. Biol. 57 (2018) 1-11. doi: 10.1016/j.nucmedbio.2017.11.004
H.J. Droogendijk, H. Kluin-Nelemans, J. Doormaal, et al., Cancer 107 (2010) 345-351. doi: 10.1016/S0093-3619(08)70668-3
C.E. Daniels, M.C. Wilkes, M. Edens, T.J. Kottom, E.B. Leof, J. Clin. Invest. 114 (2004) 1308-1316. doi: 10.1172/JCI200419603
H. Yoshiji, R. Noguchi, S. Kuriyama, et al., Am. J. Physiol. Gastrointest. Liver Physiol. 288 (2005) 907-913. doi: 10.1152/ajpgi.00420.2004
J. Distler, A. Jüngel, L.C. Huber, U. Schulze-Horsel, O. Distler, Arthritis Rheumatol. 56 (2010) 311-322.
A. Yamamura, M.J. Nayeem, A. Al Mamun, et al., FASEB J. 33 (2019) 7363-7374. doi: 10.1096/fj.201802620R
S. Farha, R. Dweik, F. Rahaghi, R. Benza, K. Asosingh, Pulm. Circ. 4 (2014) 452-455. doi: 10.1086/677359
S. Morita, S.A. Villalta, H.C. Feldman, et al., Cell Metab. 25 (2017) 883-897. doi: 10.1016/j.cmet.2017.03.018
G. Azizi, M.R. Haidari, M. Khorramizadeh, et al., Asthma Immunol. 13 (2014) 198. doi: 10.1016/j.molimm.2014.02.013
A. Morales-Ortega, D. Bernal-Bello, C. Llarena-Barroso, et al., Clin. Immunol. 218 (2020) 108518. doi: 10.1016/j.clim.2020.108518
D. Bernal-Bello, B. Jaenes-Barrios, A. Morales-Ortega, et al., Autoimmun. Rev. 19 (2020) 102565. doi: 10.1016/j.autrev.2020.102565
R. Nejat, A.S. Sadr, In Silico Pharmacol. 9 (2021) 1-22. doi: 10.1007/s40203-020-00058-7
G. Pauli, W.L. Tang, S.D. Li, Pharmaceutics 11 (2019) 465. doi: 10.3390/pharmaceutics11090465
S.K. Rai, S. Allu, A.K. Nangia, Cryst. Growth Des. 20 (2020) 4512-4522. doi: 10.1021/acs.cgd.0c00313
E. Skorepová, D. Bím, M. Hušák, et al., Cryst. Growth Des. 17 (2017) 5283-5294. doi: 10.1021/acs.cgd.7b00805
M. Reggane, J. Wiest, M. Saedtler, et al., Eur. J. Pharm. 128 (2018) 290-299. doi: 10.1016/j.ejpb.2018.05.012
G. Gál, N.V. May, P. Bombicz, Acta Crystallogr. 72 (2016) 612-615. doi: 10.1107/S2056989016004916
T.M. Asha, M.R.P. Kurup, J. Chem. Crystallogr. 49 (2019) 219-231. doi: 10.1007/s10870-018-0756-9
G.M. Sheldrick, T.R. Schneider, Methods Enzymol. 277 (1997) 319-343. doi: 10.1016/S0076-6879(97)77018-6
X.X. Luo, L. Huang, T.F. Li, X.C. Xue, W.Y. Feng, Chin. J. New Drugs 27 (2018) 1159-1164.
D. Wu, J. Li, Y. Xiao, et al., Cryst. Growth Des. 21 (2021) 2371-2388. doi: 10.1021/acs.cgd.1c00009
Y. Zhao, B. Sun, L. Jia, et al., Cryst. Growth Des. 20 (2020) 3747-3761. doi: 10.1021/acs.cgd.0c00022
J.M. Chen, Z.Z. Wang, C.B. Wu, S. Li, T.B. Lu, CrystEngComm 14 (2012) 6221-6229. doi: 10.1039/c2ce25724f

Figure 1 Molecular structure of the IM and the list of organic acids used in this study.

Figure 2 Crystal structure and the 1D, 2D salt bond and H-bond contacts of IM salts. (a) S1 (IM-MA); (b) S2 (IM-FA methanol hydrate); (c) S3 (IM-CA methanol hydrate); (d) S4 (IM-CA methylate).

Figure 3 Overlay of molecular conformations (red, S1; green, S2; blue, S3, molecule A; yellow, S3, molecule B; purple, S4, molecule A; cyan, S4, molecule B; gray, S4, molecule C).

Figure 7 Dissolution profiles of IM salts and the raw materials in pH 6.8 and pure water.

 扫一扫看文章

扫一扫关注我们
 DownLoad:


 下载:
下载:


 下载:
下载: