Citation:
Huimin Chen, Han Wang, Yongchun Wei, Maomao Hu, Bo Dong, Hongbao Fang, Qixin Chen. Super-resolution imaging reveals the subcellular distribution of dextran at the nanoscale in living cells[J]. Chinese Chemical Letters,
2022, 33(4): 1865-1869.
doi:
10.1016/j.cclet.2021.10.025
Super-resolution imaging reveals the subcellular distribution of dextran at the nanoscale in living cells
English
Super-resolution imaging reveals the subcellular distribution of dextran at the nanoscale in living cells
Institute of Materia Medica, Shandong First Medical University & Shandong Academy of Medical Sciences, Ji'nan 250062, China
b.
Department of Cardiology, Shandong Provincial Hospital Affiliated to Shandong University, Ji'nan 250012, China
c.
State Key Laboratory of Coordination Chemistry, Chemistry and Biomedicine Innovation Center (ChemBIC), School of Chemistry and Chemical Engineering, Nanjing University, Nanjing 210023, China
Received Date:
26 June 2021 Accepted Date:
11 October 2021 Revised Date:
09 October 2021 Available Online:
15 April 2022
Abstract:
Theranostic visualization of dextran at the nanoscale is beneficial for understanding the bioregulatory mechanisms of this molecule. In this study, we applied structured illumination microscopy (SIM) to capture the distribution of Cy5-Dextran at different incubation periods in living cells. The results showed that Cy5-Dextran could be absorbed by HeLa cells. In addition, we clarified that Cy5-Dextran exhibited differential organelle distribution (lysosomal or mitochondrial) in a time-dependent manner. Moreover, lysosomal Cy5-Dextran localization was found to be independent of the autophagy process, while Cy5-Dextran localized to the mitochondria triggered a pro-apoptotic event, upregulating the levels of reactive oxygen species (ROS) to accelerate mitochondrial fragmentation. This work uses a visualized strategy to reveal the anti-tumor bioactivity of dextran, which was achieved by regulating apoptosis and autophagy.
Dextran, a harmless biopolymer physiologically, is composed of glucose monomers connected by glycosidic bonds, and the molecule can be found in bacteria, fungi, and cereal [1]. In these years, dextran has become an ideal choice in the application of bio-medicine owing to its hydrophilicity, biocompatibility and biodegradability [2]. Dextran demonstrates diverse biological effects, including immune enhancement [3] and antitumor properties [4]. Recently, studies have focused on the anti-cancer effect of dextran; Wang et al. reported that yeast β-d-glucan, an autophagy inhibitor, achieved a significant anti-tumor effect by increasing lysosomal pH and inhibiting the ability of lysosomal cathepsin to accelerate damaged mitochondria [4]. Xu et al. reported that β-glucan from Lentinus edodes promoted apoptosis by suppressing the PI3K/Akt/mTOR and P53 pathways during breast cancer treatment [5]. In general, researchers have used conventional detection techniques, such as western blotting [6] and immunofluorescence staining [5], to confirm that dextran exhibits its anti-tumor effect by mediating the balance between autophagy and apoptosis. To date, it has been difficult to visually describe dextran at the organelle level due to technical limitations.
Classical pharmacokinetics is used to investigate factors such as drug absorption, distribution, metabolism, and excretion at the level of individual animals [7], while cellular pharmacokinetics focuses of the change in drug concentrations throughout subcellular structure. However, conventional studies of cellular pharmacokinetics mainly rely on laser confocal microscopy [8], which is limited by the fact that Abbe diffraction makes it difficult to obtain accurate drug distribution data below 200 nm [9, 10]. This limitation has also resulted in researchers being unable to visualize the clear distribution of other polysaccharides (e.g., hyaluronic acid) in living cells [11].
Recently developed super-resolution microscopy imaging techniques, such as structured illumination microscopy (SIM) [12], stimulated emission deletion [13], and stochastic optical reconstruction microscopy [14], can be used to investigate organelle-organelle interactions at the nanoscale in living cells. SIM, a super-resolution fluorescence microscopy imaging technology, increases its spatial resolution up to 100 nm through structured light illumination [15]. In addition, it can be used for long-time super-resolution imaging in living cells [16], providing a powerful tool for the super-resolution track of organelle dynamic changes and the visualized study of drugs [17, 18].
To capture the detailed distribution of polysaccharides at the organelle level, recently developed SIM [12] technology was introduced. This technique is suitable for most fluorescent labeling probes (such as Cy5, FITC, and GFP), and can achieve an imaging resolution of approximately 100 nm. Cy5 is widely used for drug labeling, such as dexamethasone [19]. To utilize this tool to visualize the specific subcellular distribution of dextran at the nanoscale, we obtained a Cy5-linked dextran (Cy5-Dextran, Figs. S1a and S2 in Supporting information) for use in SIM imaging.
Previous reports have shown that dextran exhibits anti-tumor activity in HeLa cells [20]. To verify that the introduction of the Cy5 fluorophore did not affect the biological functions of dextran, we performed a cell proliferation experiment (Fig. S1b in Supporting information). The results demonstrated that when the concentration of Cy5-Dextran was 0.5, 1 and 10 µmol/L, cell proliferation was inhibited (approximately 60%, compared with the control group), while when the concentration of Cy5-Dextran was increased to 20 µmol/L, cell proliferation was significantly inhibited (15.4%, compared with the control group). In addition, when the cells were treated with Cy5 alone, cell proliferation was not inhibited (Fig. S3 in Supporting information). Our results suggest that the Cy5 fluorophore did not change the biological activity of dextran, and that Cy5-Dextran can still exhibit an anti-tumor effect, which is similar to the findings highlighted in a previous report [4].
To examine the detailed dextran subcellular distribution, we applied 10 µmol/L Cy5-Dextran to HeLa cells for a 0.5 h incubation period prior to SIM imaging using the single-channel mode with excitation at 640 nm (Fig. 1a). When compared to the fluorescence images taken at 0 h, after Cy5-Dextran treatment for 0.5 h the SIM image showed weak fluorescence evenly dispersed throughout the cytoplasm, indicating that Cy5-Dextran had entered the living cells. Considering that dextran is a macromolecular polysaccharide [1] and cannot quickly cross the cell membrane, we incubated the cells with 10 µmol/L Cy5-Dextran for 0.5, 1, 3, 6, and 12 h to investigate whether any time-dependent behavior could be observed within the tumor cells (Fig. 1b). The results showed that with an increase in time, the fluorescence intensity of the particles in the cells gradually increased (Fig. 1c). We also noticed that during the 0.5–3 h incubation period there was no significant change in the distribution (Figs. 1a and b) and fluorescence intensity (Fig. 1c) in the cells. The diameter of fluorescence puncta stained with Cy5-Dextran for 3 h period was approximately 0.4 µmol/L (Fig. S4 in Supporting information), which is similar to previous reports on the description of lysosomes [21]. After 6 and 12 h Cy5-Dextran incubation periods we observed increased fluorescence intensity and a new distribution pattern, with the images now showing fibrous and rod-like shapes (Figs. 1a and b), which is similar to previous reports on the morphology of mitochondria [22]. We also confirmed that Cy5 dye incubation alone could not obtain these subcellular distribution events (Fig. S5 in Supporting information), which similar to previously reported [19]. These results confirmed that Cy5-Dextran exhibited a time-dependent variation in cellular distribution.
Figure 1
Figure 1.
Super-resolution visualization of Cy5-Dextran distribution in living cells. (a) Fluorescence images of HeLa cells incubated with Cy5-Dextran (10 μmol/L, λex = 640 nm) for 0, 0.5, 1, 3, 6, and 12 h. (b) Enlargement of single Cy5-Dextran puncta outlined in (a). (c) The normalized fluorescence intensity of Cy5-Dextran at various time points. (d) Schematic representation of Cy5-Dextran staining in lysosomes and mitochondria in living cells over time.
The puncta size after Cy5-Dextran incubation for 3 h followed typical lysosomal characteristics, prompting us to further confirm the colocalization of fluorescent particles caused by Cy5-Dextran incubation during this 3 h period. A commercial lysosome probe (Lyso-Tracker Green, LTG) was used to co-stain HeLa cells alongside Cy5-Dextran. The results showed that some of the magenta particles stained by Cy5-Dextran were localized in the LTG-labeled lysosomes at 1 and 3 h (Figs. 2a and c), suggesting that part of the subcellular localization of Cy5-Dextran during the 1–3 h incubation period could be attributed to localization within the lysosomes of the cell.
Figure 2
Figure 2.
Time-dependent Cy5-Dextran distribution in different organelles (mitochondria or lysosomes). (a) SIM images of HeLa cells co-stained with lysosome-tracker-green (LTG) (λex = 488 nm) for 0.5 h, and Cy5-Dextran (λex = 640 nm) at 1 and 3 h time points. Zoom-in images are of the areas surrounded by white rectangles. (b) Cells were treated with Cy5-Dextran (λex = 640 nm) for 6 and 12 h and then stained with mito-tracker green (MTG) (λex = 488 nm) for 0.5 h. (c) The PCC values for Cy5-Dextran and LTG/MTG at different time points. (d) Different angle images for cells co-stained with Cy5-Dextran for 6 h and MTG for 0.5 h. The solid white line indicates a fluorescence intensity of 0°, shown in (e). (e) The red and green lines represent Cy5-Dextran and MTG intensity, respectively. (f) Schematic representation of the subcellular distribution of Cy5-Dextran in lysosomes or mitochondria at various time points.
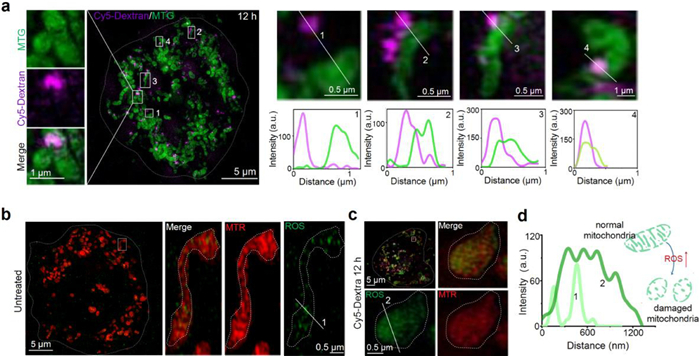
For the fibrous and rod-shaped distribution pattern demonstrated by Cy5-Dextran incubation between 6 and 12 h (Fig. 1a), we further verified whether Cy5-Dextran was localized within the mitochondria. A commercial mitochondrial probe (Mito-Tracker Green, MTG) and Cy5-Dextran were used to co-stain HeLa cells. The results showed that Cy5-Dextran was localized to the MTG-labeled mitochondria zones during Cy5-Dextran incubation for 6 and 12 h (Figs. 2b and c). Moreover, some normal fibrous-like mitochondria became swollen or fragmented after Cy5-Dextran incubation for 12 h (Fig. 2b). To further observe and investigate Cy5-Dextran entering the mitochondria at 6 h, we captured 3D images from different rotation angles around a solid white line (Fig. 2d, 0–180°). Analysis of these images revealed that Cy5-Dextran had contacted the mitochondria at 6 h (Fig. 2e) and wrapped around their surface like a "concealed button." These results supported the fact that Cy5-Dextran incubation for 6 and 12 h involved localization of the molecule to the mitochondria. Altogether, we found that Cy5-Dextran exhibited a different organelle distribution (lysosomal or mitochondrial) in a time-dependent manner (Fig. 2f).
After clarifying that Cy5-Dextran incubation for 6 and 12 h could induce mitochondrial fragmentation (Fig. 2b), we further investigated the mechanism underpinning the damage induced by Cy5-Dextran to mitochondria through further imaging. We captured more representative Cy5-Dextran-mitochondrial contacts and the fragmentation of mitochondria after Cy5-Dextran incubation for 12 h and with MTG staining for 0.5 h (Fig. 3a). We found that Cy5-Dextran initially kept some distance between itself and mitochondria at 1 h, after which the molecule then localized more closely, entering the mitochondria at 6 h (Fig. S6 in Supporting information). These results confirmed that Cy5-Dextran could contact and damage mitochondria after incubation for 6-12 h in HeLa cells.
Figure 3
Figure 3.
Cy5-Dextran localized to the mitochondria triggers a pro-apoptosis event. (a) The interaction between Cy5-Dextran (λex = 640 nm) and mitochondria after a 12 h incubation period. Zoom-in images are of areas surrounded by the white rectangles. (b) The ROS levels detected in untreated and Cy5-Dextran-treated (12 h) HeLa cells (c) Cells were stained with MTR (λex = 561 nm) for 0.5 h and ROS commercial green probe for 0.5 h. The white solid square indicates where fluorescence intensity profiles shown in (d) were measured. (d) Intensity profiles indicating that HeLa cells incubated with Cy5-Dextran for 12 h can increase mitochondria ROS levels, accelerating mitochondria fission.
It is well known that there are many factors that contributing to mitochondrial damage, including the presence of reactive oxygen species (ROS) [23, 24]. ROS are small molecules with high activity and a short lifetime [25] that play a central role in the regulation of major apoptotic pathways mediated by mitochondria, dead recipients, and the endoplasmic reticulum [26]. High levels of ROS can oxidize cellular components, proteins, and DNA, which can then threaten the integrity of cell structure and function [27]. In addition, ROS can cause mitochondrial membrane rupture and apoptotic protein release, which can also further induce cell apoptosis [28]. Therefore, we sought to determine if the level of mitochondrial ROS changed between untreated and Cy5-Dextran-treated HeLa cells through the use of a green ROS commercial probe and a red-fluorescent mitochondrial dye (MTR) (Figs. 3b and c). The results revealed that the filamentous mitochondria in the untreated group became spherical after Cy5-Dextran incubation for 12 h (Fig. 3c, Fig. S7 in Supporting information). Moreover, the ROS level in the Cy5-Dextran-treated HeLa cells was significantly higher than that in untreated HeLa cells (Fig. 3d), indicating that Cy5-Dextran increased the level of ROS-induced mitochondrial damage after entering the mitochondria to switch on apoptosis.
A previous study has shown that the process of autophagy is an important target for tumor therapies [29], meaning that dextran has potential as an anti-tumor drug due to its use as an autophagy inhibitor [4]. To examine the influence dextran had on autophagy at the cellular and subcellular levels using SIM, cells were stained with 0.1 µmol/L of autophagosome dye (DAPGreen) [30] for 0.5 h, and then treated with 10 µmol/L of Cy5-Dextran for 1 and 3 h periods (Fig. 4a). Compared with untreated cells, the number of DAPGreen-labeled particles in the treated cells did not increase significantly (Fig. 4a) and Cy5-Dextran-labeled magenta particles did not overlap with these green particles (Figs. 4b and c). This indicates that the subcellular distribution of Cy5-Dextran was independent of the autophagy process (Fig. 4d), which is consistent with previously reported results [4]. This result provides the first visual data supporting the fact that Cy5-Dextran subcellular distribution is independent of the autophagy process, building upon traditional western blotting [4] and other similar strategies [5, 6, 31].
Figure 4
Figure 4.
SIM visualization of the influence of Cy5-Dextran localization on autophagy. (a) Cells were treated with Cy5-Dextran (λex = 640 nm) for 0, 1, and 3 h and then stained with the autophagosome dye DAPGreen (λex = 488 nm) for 0.5 h. (b) Zoom-in images of regions of interest in the white rectangle from (a). (c) The co-localization value (PCC) for DAPGreen and Cy5-Dextran at 1 and 3 h of incubation. (d) Schematic representation of how Cy5-Dextran subcellular distribution is independent of the autophagosome.
In summary, when compared to traditional technologies, SIM achieves super-resolution imaging at the nanoscale in living cells. In our study, SIM was applied to track dextran localization at different incubation periods in living cells in order to realize theranostic visualization. Our work provides notable visualization data highlighting the biological mechanism of dextran, showing how Cy5-Dextran can be absorbed by cells and distributed in different organelles (lysosomes or mitochondria) over time. Moreover, we demonstrated that the Cy5-Dextran localized to the lysosomes was independent of the autophagy process, while Cy5-Dextran localized to the mitochondria promoted cancer cell apoptosis by increasing ROS levels to accelerate mitochondrial fragmentation (Fig. S8 in Supporting information). Furthermore, super-resolution imaging can be applied to investigate the subcellular distribution of drugs at the nanoscale level, which may be used to reveal the mechanisms underlying their biological activity at different levels of visualization.
Declaration of competing interest
The authors declare that they have no known competing financial interests or personal relationships that could have appeared to influence the work reported in this paper.
Acknowledgments
This work was supported by National Natural Science Foundation of China (Nos. 22107059, 21801158, 81870283, 82070382), Program of Taishan Scholars Programme (No. 20190979), Academic Promotion Programme of Shandong First Medical University (No. 2019LJ003), National Postdoctoral Program for Innovative Talents (No. BX2021123), The China Postdoctoral Science Foundation (No. 2021M691505) and the Jiangsu Postdoctoral Research Funding Program (No. 2021K125B). We thank Translational Medicine Core Facility of Shandong University for consultation and instrument support.
Supplementary materials
Supplementary material associated with this article can be found, in the online version, at doi:10.1016/j.cclet.2021.10.025.
Figure 1
Super-resolution visualization of Cy5-Dextran distribution in living cells. (a) Fluorescence images of HeLa cells incubated with Cy5-Dextran (10 μmol/L, λex = 640 nm) for 0, 0.5, 1, 3, 6, and 12 h. (b) Enlargement of single Cy5-Dextran puncta outlined in (a). (c) The normalized fluorescence intensity of Cy5-Dextran at various time points. (d) Schematic representation of Cy5-Dextran staining in lysosomes and mitochondria in living cells over time.
Figure 2
Time-dependent Cy5-Dextran distribution in different organelles (mitochondria or lysosomes). (a) SIM images of HeLa cells co-stained with lysosome-tracker-green (LTG) (λex = 488 nm) for 0.5 h, and Cy5-Dextran (λex = 640 nm) at 1 and 3 h time points. Zoom-in images are of the areas surrounded by white rectangles. (b) Cells were treated with Cy5-Dextran (λex = 640 nm) for 6 and 12 h and then stained with mito-tracker green (MTG) (λex = 488 nm) for 0.5 h. (c) The PCC values for Cy5-Dextran and LTG/MTG at different time points. (d) Different angle images for cells co-stained with Cy5-Dextran for 6 h and MTG for 0.5 h. The solid white line indicates a fluorescence intensity of 0°, shown in (e). (e) The red and green lines represent Cy5-Dextran and MTG intensity, respectively. (f) Schematic representation of the subcellular distribution of Cy5-Dextran in lysosomes or mitochondria at various time points.
Figure 3
Cy5-Dextran localized to the mitochondria triggers a pro-apoptosis event. (a) The interaction between Cy5-Dextran (λex = 640 nm) and mitochondria after a 12 h incubation period. Zoom-in images are of areas surrounded by the white rectangles. (b) The ROS levels detected in untreated and Cy5-Dextran-treated (12 h) HeLa cells (c) Cells were stained with MTR (λex = 561 nm) for 0.5 h and ROS commercial green probe for 0.5 h. The white solid square indicates where fluorescence intensity profiles shown in (d) were measured. (d) Intensity profiles indicating that HeLa cells incubated with Cy5-Dextran for 12 h can increase mitochondria ROS levels, accelerating mitochondria fission.
Figure 4
SIM visualization of the influence of Cy5-Dextran localization on autophagy. (a) Cells were treated with Cy5-Dextran (λex = 640 nm) for 0, 1, and 3 h and then stained with the autophagosome dye DAPGreen (λex = 488 nm) for 0.5 h. (b) Zoom-in images of regions of interest in the white rectangle from (a). (c) The co-localization value (PCC) for DAPGreen and Cy5-Dextran at 1 and 3 h of incubation. (d) Schematic representation of how Cy5-Dextran subcellular distribution is independent of the autophagosome.


 DownLoad:


 下载:
下载:


 下载:
下载:
