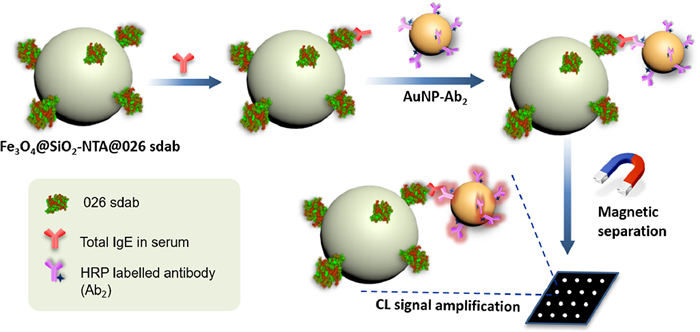
Scheme 1.
Schematic illustration of our immunosensor for quantitative detection of total IgE in serum samples with a significant signal enhancement.
Ultrasensitive detection of IgE levels based on magnetic nanocapturer linked immunosensor assay for early diagnosis of cancer
Yongxin Liu , Mengda Cao , Zhongxi Huang , Changmin Yu , Naidi Yang , Qiong Wu , Liang Shi , Wenjie Duan , Yi Zhu , Jifu Wei , Lin Li , Wei Huang

Immunoglobulin E (IgE), produced by B cells as a response to an allergen, is the least abundant isotype of immunoglobulin in human serum [1, 2]. IgE plays an important role in many diseases with significant morbidity and mortality, including allergic diseases, cancer, acquired immune deficiency syndrome (AIDS), cardiovascular diseases and diabetes [3-6]. In general, elevated IgE level may assume more clinical significance, especially in the diagnosis of allergic diseases and cardiovascular diseases [7, 8]. Recently, ultra-low IgE was discovered as a potential novel biomarker in cancer [9]. Clear evidence showed that IgE could induce the generation of antitumor cytotoxic CD8+ T lymphocytes, contributing to tumor immunosurveillance [1, 10]. IgE-deficient individuals (IgE < 2.5 kU/L) or individuals with IgE < 100 kU/L had higher rates and risk of having a diagnosis of any type of cancer compared with non-IgE deficient individuals [9, 11-14]. Apart from cancer, ultra-low IgE levels may also be found in patients with common variable immunodeficiency (CVID), hyper IgM syndrome and XLA agammaglobulinemia [9, 15], thus prompting the urgent need for ultrasensitive detection of IgE.
The most popular and well-established methods for the detection of IgE are adapted from traditional immunoenzymatic techniques, such as enzyme-linked immunosorbent assays (ELISA) [16, 17] and ImmunoCAP (clinical gold standard for IgE detection) [18-20]. These approaches, although very reliable, are often expensive and require highly trained personnel to perform the assay [21-23]. The multistage washing and sample addition process are also time consuming, making them unsuitable for on-site detection [24]. Commercially available ELISA-based kits or ImmunoCAP for IgE detection usually require 20-50 µL of blood serum and provide the limit of detection (LOD) for IgE as low as 0.1 kU/L [25]. Individuals with higher prevalence and risk of developing malignancy tend to have lower or undetectable IgE levels [13]. Ultrasensitive detection for IgE helps to determine the specific threshold for serum total IgE that determines cancer susceptibility, which may contribute to early diagnosis of cancers. To achieve the higher sensitivity, many methods have been developed, including fluorescence enhancement methods and electrochemical assay methods [26-29]. These methods can address requirements for sensitive IgE detection to some extent. However, many of them failed to provide stable and persistent enhancement, satisfy the system requirements for quickness, high-sensitivity and low-cost, or have low average enhancement in sensitivity [27, 30]. Accordingly, new biorecognition elements are highly desirable to explore more sensitive assays for IgE detection.
In the last decade, single-domain antibodies (sdabs, also known as nanobody), the recombinant antigen-binding fragments of camelid heavy-chain-only antibodies, have emerged as accepted and even advantageous alternative to conventional antibodies and have shown great potential as diagnostic tools [2, 31, 32]. Sdabs exert high specificity and affinity to their targets, and display more stable than conventional antibodies [33]. Furthermore, their easy preparation and modularity makes them amenable for the generation of multivalent complexes [33]. Amongst the sdabs family, 026 sdab is a nanobody for IgE, which can target IgE by binding to an epitope within the Fc domains [34]. In view of the above advantages, we herein developed a nanocapturer Fe3O4@SiO2-NTA@026 sdab based on magnetic nanoparticle with surface modification of 026 sdab and combined with the gold nanoparticles (AuNP)-based signal amplification system to achieve ultrasensitive IgE detection. The surfaces of the magnetic nanoparticles have been modified with silica to give them good dispersibility and chemical stability [35]. As metal-containing nanoparticles, magnetic nanoparticles and AuNPs have emerged and grown up as a revolutionary technique for the inexpensive and highly sensitive detection of biomolecules due to their wide linear range, high sensitivity, good immunological properties and feasibility for surface modification with molecular probes [36-38].
In this work, magnetic nanoparticles (Fe3O4@SiO2) were firstly modified with nickel nitrilotriacetic acid (Ni-NTA) moieties through high-efficient amidation reaction. Recombinant 026 sdab was expressed and immobilized on the surface of the Fe3O4@SiO2-NTA via the high-affinity and specific interaction between Ni-NTA and its His-tag. Our previous work has showed that this kind of antibody immobilization is superior to the former traditional ways (chemical bonds linkage or physisorption) because of eliminating steric constraint of the protein's reactivity or interaction capability [22]. As shown in Scheme 1, we utilized Fe3O4@SiO2-NTA@026 sdab as capture probe to isolate IgE from patients' serum samples (provided by the First Affiliated Hospital of Nanjing Medical University) by rapid magnetic separation, which could shorten the assay time and reduce background signals for enhanced sensitivity [39]. On the other hand, numerous horseradish peroxidase (HRP)-labeled antibodies (Ab2) were modified onto AuNPs surface through a stable Au-S bond to form AuNP-Ab2 as signal amplification platform. Once one antibody binds to IgE, other HRP-labeled Ab2 modified on the same AuNP would all react with the BeyoECL Plus and create signals. The large amount of HRP resulted in significant amplification of the chemiluminescence (CL) signal [30]. In this study, various factors affecting the immunoassay were investigated, and the analytical performance of the proposed immunosensor was evaluated. Finally, the proposed method was successfully applied to the detection of total IgE in patients' serum (including normal and cancer patients, provided by the First Affiliated Hospital of Nanjing Medical University) for validation. The study protocol was approved by the Ethical Committee of the First Affiliated Hospital of Nanjing Medical University. Compared with traditional methods, this strategy has the advantages of high sensitivity, simple separation, low cost and high efficiency, which offers compatibility with less invasive sample collection via finger-prick. This proposed immunosensor provides new insights to the minute quantity of IgE detection.
We first expressed and purified the 026 sdab to grab IgE in serum. The codon optimized of 026 sdab sequence was subcloned into pET-28a (+) vector and transformed into BL21 (DE3) pLysS E. coli. A comparison of sequences before and after optimization is shown in Fig. S1 (Supporting information). By the SDS-PAGE, it was discovered that 026 sdab was expressed mainly in the supernatant. Then, the recombinant 026 sdab was purified by Ni column. The purified 026 sdab was showed as a single band identified by SDS-PAGE. The apparent molecular weight of purified 026 sdab was 15 kDa.
In order to assess the binding ability of 026 sdab with IgE, inhibition ELISA was conducted to figure out whether the binding sites of 026 sdab and commercial antibodies are different. As shown in Fig. S2a (Supporting information), the reactivity of commercial antibodies nearly unchanged when IgE was pre-inhibited with increasing concentrations of 026 sdab, which clearly demonstrated a different IgE binding site of 026 sdab from commercial antibodies. Then, we used ELISA to study the functional activity of the 026 sdab. The microplate wells were pre-coated with 026 sdab or PBS to grab the IgE in patients' sera. The results showed an excellent IgE binding ability of 026 sdab, enabling practical application of the immunosensor (Fig. S2b in Supporting information).
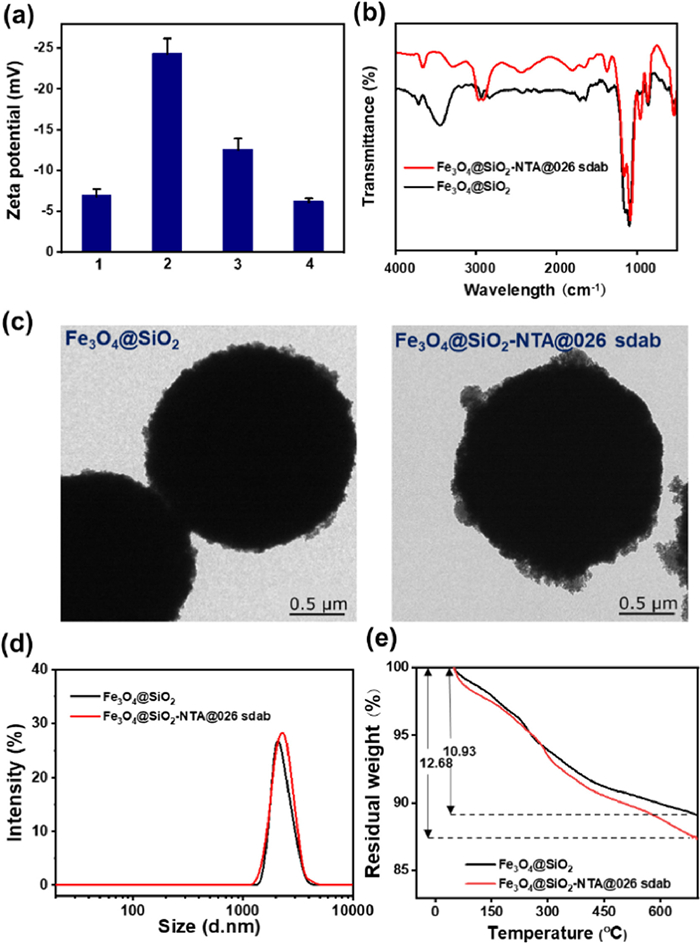
Fe3O4@SiO2-NTA@026 sdab was prepared according to our previous work with minor modification [23]. As shown in Scheme S2 (Supporting information), Ni-NTA was fixed directly on the surface of the magnetic nanoparticles through the amidation reaction. The recombinant His-tagged 026 sdab was specifically bound to the surface of magnetic nanoparticles via the interaction with Ni-NTA moiety. The changes of zeta potential were firstly studied and successfully demonstrated the preparation process (Fig. 1a). The FTIR spectra were further carried out to investigate the reaction process. After Fe3O4@SiO2-NTA complexing with 026 sdab, the absorption peak showed obvious C-O stretching at 1001 cm−1 (Fig. 1b). The TEM and DLS results indicated that the magnetic nanoparticles were in a spherical shape and well-defined size (ca. 2.0 µm) (Figs. 1c and d). Furthermore, we used thermogravimetric analysis (TGA) to assess the grafting degree of 026 sdab. After the immobilization of 026 sdab, the weight loss rate of magnetic nanoparticles increased from 10.93% to 12.68%. According to the TGA data, the amount of 026 sdab immobilized on the surface of Fe3O4@SiO2-NTA was calculated as 1.267 mol/g (Fig. 1e).
As shown in Scheme 1, the signal amplification is due to the attachment of the multiple HRP-labeled Ab2 with one AuNP. Herein, we directly connected multiple HRP-labeled commercial Ab2 on the surface of AuNPs by hydrophilic, hydrophobic and electrostatic interactions. The zeta potential of AuNPs in sodium citrate solution is –9.04 ± 1.02 mV, while the potential of AuNP-Ab2 was changed to be –0.52 ± 0. 85 mV due to the replacement of citrate with Ab2 (Fig. S3a in Supporting information). In addition, the FTIR spectra showed clearly that the main banded of the AuNP-Ab2 originated by C-O stretching (1135 cm−1) and C-N (1340 cm−1) stretching (Fig. S3b in Supporting information). The TEM imaged and DLS showed that AuNPs were approximately 13 nm in size and aggregated to some extent after attaching Ab2 (Figs. S3c and d in Supporting information), which is also demonstrated by UV-vis spectrum (Fig. S3e in Supporting information).
The concentration of 026 sdab and Ab2 are vital importance for the accuracy of IgE detection. Therefore, we firstly screened and optimized the concentration of 026 sdab and Ab2. As shown in Fig. S4 (Supporting information), the CL intensity of the immunosensor increased with the concentration of 026 sdab increasing, and reached the plateau at 0.025 mg/mL, which was set as the optimized concentration of 026 sdab for the following experiments. Similarly, the concentration of Ab2 was determined to be 1:1000 (Fig. S5 in Supporting information). The incubation time of biological samples also played an important role, so we next screened the incubation time of 026 sdab, serum and Ab2 (Figs. S6-S8 in Supporting information). With increasing incubation time, all of the CL intensity gradually increased and maximized at 10 min, 30 min and 5 min for 026 sdab, serum and Ab2 respectively. It is noted that when the incubation time continued to extend, the CL intensity began to decline, which is possible due to the protein/antibody inactivation at room temperature. Therefore, the incubation time of 026 sdab, Ab2 and serum were set as 10 min, 30 min and 5 min. Thus, the whole process can be completed within 1 h, which is faster than that in clinical test procedure, including commercial ELISA and ImmunoCAP. In addition, we have studied the water dispersity of our immunosensor for different time. As shown in Fig. S9a (Supporting information), the immunosensor had good dispersibility without obvious aggregation within 2 h, which covered the whole testing time. Obviously, the absence of NTA, 026 sdab, IgE or Ab2 in the detection process would affect the final detection signal (Fig. S9b in Supporting information).
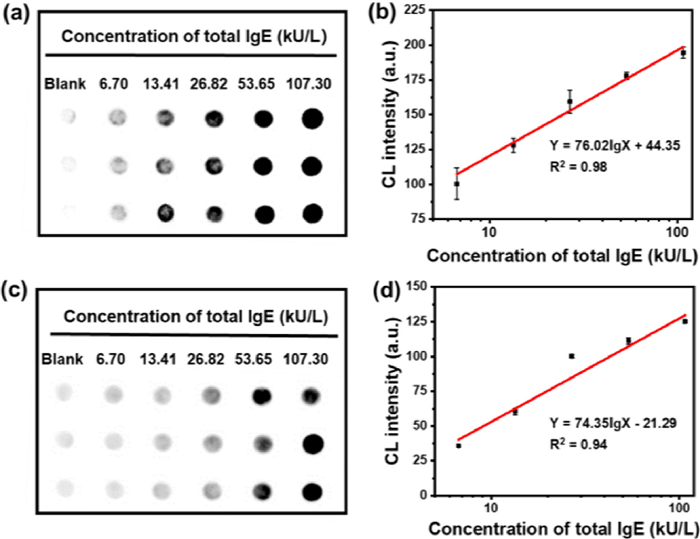
To assess the sensitivity of our immunosensor, the calibration curve was firstly obtained by quantifying the CL intensity of different IgE concentrations in serum (The total IgE concentrations were determined by ImmunoCAP). As shown in Figs. 2a and b, the CL intensity enhanced with the increase of IgE concentration in serum samples. There was a good linear relationship between the CL intensity value and the total IgE concentration in the range of 0–107.3 kU/L (R2 = 0.98) [40]. According to the calibration curve, the limit of detection (LOD) was determined to be 0.03 kU/L (0.15 pmol/L), which is the lowest LOD in comparison with current reported methods (Table S3 in Supporting information). As a comparison, we used the free HRP-labeled Ab2 instead of AuNP-Ab2 to assess the sensitivity of the immunosensor. As shown in Figs. 2c and d, the LOD was increased to 0.11 kU/L according to the calibration curve, which was much higher than our strategy. Furthermore, the LOD of our immunosensor was also lower than other reported methods for the detection of IgE (Table S3). Thus, our strategy is suitable for the ultrasensitive detection of IgE.
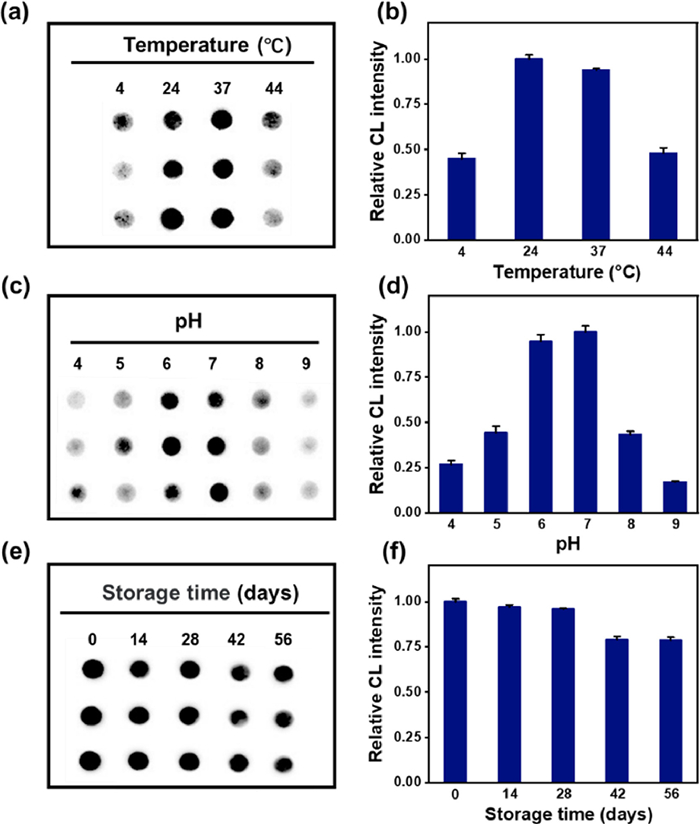
The stability at different temperatures was firstly evaluated. As shown in Figs. 3a and b, the immunosensor had a good stability from 24 ℃ to 37 ℃, indicating its availability at room temperature. In addition, the pH of washing buffer also can influence the stability of the immunosensor. When the pH value was changed from 4.0 to 9.0 (Figs. 3c and d), the CL intensity of the corresponding positive sample first increased, and then decreased after the pH value exceeding 7.0. In the pH range of 4.0-7.0, the physiological pH range was covered, and significant CL intensity enhancement was observed in the positive serum samples. The long-time stability of the immunosensor was also studied within a 56-day period of storage at 4 ℃. As shown in Figs. 3e and f, the CL intensity displayed a slightly decrease but could still realize the detection of IgE in real samples. In short, the immunosensor had good stability and repeatability.
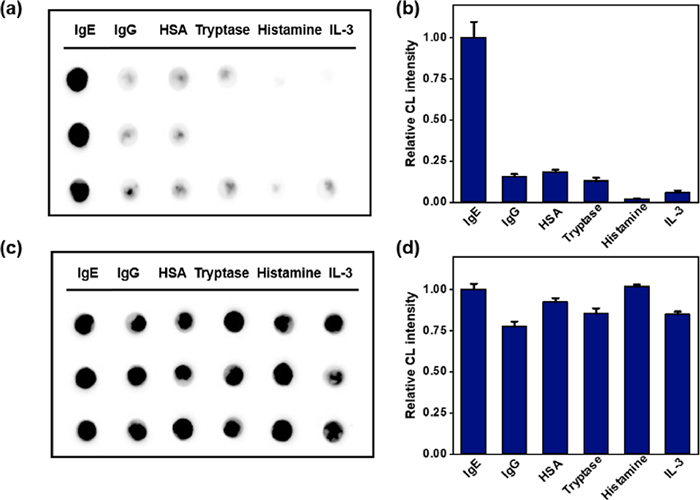
Moreover, the selectivity and anti-interference ability of our immunosensor to IgE in serum were compared with some potential interfering substances, including IgG, human serum albumin (HSA), tryptase, histamine and IL-3 [41-43]. It can be seen from Figs. 4a and b that the CL intensities of IgG, HSA, tryptase, histamine and IL-3 were all very weak, indicating a good selectivity for IgE in serum. Furthermore, we mixed the above substances with IgE to detect the good anti-interference ability of the immunosensor. The CL intensity in Figs. 4c and d changes negligiblly, showing a good anti-interference ability.
The accuracy of immunosensor detection is one of the key factors to evaluate its performance. We firstly evaluated the recovery rate of the as-prepared immunosensor based on the detection of serum samples with different concentrations of IgE. As shown in Table S4 (Supporting information), satisfied performance with recovery rates of 83.05%–119.92% in the quantitative detection of IgE was finally achieved. Next, we performed the applicability of the immunosensor in clinical diagnosis. Twenty clinical serum samples were randomly selected to detect total IgE level by both ImmunoCAP and our ultrasensitive detection system in a randomized, double-blind way. As shown in Fig. 5a, the results of the two methods were highly consistent and the margin of error of total IgE content was within 0.08-0.90, except for sample 8 (6.81). These results further demonstrate that the immunosensor exhibits good performances and has the potential to become an alternative method for the ultrasensitive detection of IgE in clinical samples.

Previous works showed that individuals with higher prevalence and risk of developing malignancy tend to have lower or undetectable IgE levels [13]. Ultrasensitive detection of total IgE in serum is benefit for the early diagnosis of cancers. We finally tried to evaluate the IgE concentrations in cancer patients with our strategy. As shown in Fig. 5b, sera from 44 cancer patients and 15 non-cancer individuals were randomly selected for detection using our immunosensors. The test results of 59 samples were quantified by ImageJ and the total IgE of each sample was calculated according to the standard curve. It can be seen from the scatter plot that the total IgE level of cancer patients is relatively lower than that of non-cancer ones (Fig. 5c). These experiments suggested that our strategy could track ultra-low concentration of total IgE level in serum, which would inevitably promote the accuracy for the early diagnosis of cancer.
In conclusion, by introducing 026 sdab as the IgE capturer, we herein developed ultrasensitive detection system that allows quantitative detection of total IgE in serum samples. Fe3O4@SiO2-NTA@026 sdab was firstly used to capture and isolate IgE through rapid magnetic separation, which can shorten the detection time, reduce background signals, and improve sensitivity. Numerous HRP-labeled Ab2 that were modified on AuNPs surface are served as CL signal amplifier. In this way, we could achieve ultra-low LOD as low as 0.03 kU/L. We have proved that this strategy has the advantages of rapid, stable, and highly accurate to trace amount of IgE in real biological samples. Furthermore, our method was successfully utilized for assessing the IgE traces in breast cancer patients, which provides a new idea for the diagnosis of early cancer. Therefore, we expect that such versatile immunosensor will offer a promising tool for tracing the levels in various IgE-related diseases.
All the contributing authors have reviewed this paper and approved the submission. The authors declare no competing financial interest.
This research was partially supported by the National Key Research and Development Project (No. 2020YFA0709900), the National Natural Science Foundation of China (Nos. 81871265, 81672508, 81702617), Key University Science Research Project of Jiangsu Province (No. 19KJA520005), Natural Science Basic Research Program of Shaanxi Province (No. 2019JM-016), National Natural Science Foundation of Jiangxi Province (No. 20202BABL206043), Science and Technology Project of Jiangxi Provincial Health Commission (No. 20204495), Open Research Fund of Anhui Key Laboratory of Tobacco.
Supplementary material associated with this article can be found, in the online version, at doi:10.1016/j.cclet.2021.08.117.
B. Platzer, K.G. Elpek, V. Cremasco, et al., Cell reports 10(2015) 1487-1495. doi: 10.1016/j.celrep.2015.02.015
J. Hu, M. Gao, Y. Wang, et al., Langmuir 35(2019) 14896-14901. doi: 10.1021/acs.langmuir.9b02631
X. Guo, S. Yuan, Y. Liu, et al., Atherosclerosis 251(2016) 355-360. doi: 10.1016/j.atherosclerosis.2016.05.020
E. Magen, J. Mishal, D. Vardy, Allergy Asthma Proc. 36(2015) 225-229. doi: 10.2500/aap.2015.36.3825
J.C. Pascual, F.J. García-Martínez, A. Martorell, I. González, P. Hispan, Br. J. Dermatol. 175(2016) 1101-1102. doi: 10.1111/bjd.14870
Z. Xu, T. Wang, X. Guo, et al., Int. J. Med. Sci. 15(2018) 1098-1104. doi: 10.7150/ijms.25857
K.B. Min, J.Y. Min, Res. Public Health 16(2019) 22.
J.M. Wilson, C.A. McNamara, T.A.E. Platts-Mills, Aging 11(2019) 1900-1902. doi: 10.18632/aging.101894
D. Ferastraoaru, H.J. Bax, Allergy 10(2020) 32. doi: 10.1186/s13601-020-00335-w
E.A. Nigro, A.T. Brini, J. Immunol. 197(2016) 2583-2588. doi: 10.4049/jimmunol.1601026
D. Ferastraoaru, R. Gross, D. Rosenstreich, Ann. Allergy. Asthma. Immunol. 119(2017) 267-273. doi: 10.1016/j.anai.2017.07.006
D. Ferastraoaru, D. Rosenstreich, Ann. Allergy. Asthma. Immunol. 121(2018) 613-618. doi: 10.1016/j.anai.2018.07.036
D. Ferastraoaru, D. Rosenstreich, J. Allergy Clin. Immunol. Pract. 8(2020) 413-415. doi: 10.1016/j.jaip.2019.06.031
F.C. Calboli, D.G. Cox, J.E. Buring, et al., J. Natl. Cancer Inst. 103(2011) 1588-1595. doi: 10.1093/jnci/djr361
M.G. Lawrence, T.V. Palacios-Kibler, L.J. Workman, et al., J. Clin. Immunol. 38(2018) 225-233. doi: 10.1007/s10875-018-0476-0
J. Chen, H. Xue, Q. Chen, et al., Chin. Chem. Lett. 30(2019) 1631-1634. doi: 10.1016/j.cclet.2019.03.045
S. He, L. He, B. Liu, et al., Chin. Chem. Lett. 30(2019) 1031-1034. doi: 10.1016/j.cclet.2019.03.013
M. Ollert, S. Weissenbacher, J. Rakoski, et al., Clin. Chem. 51(2005) 1241-1249. doi: 10.1373/clinchem.2004.046565
T. Bacarese-Hamilton, L. Mezzasoma, C. Ingham, et al., Clin. Chem. 48(2002) 1367-1370. doi: 10.1093/clinchem/48.8.1367
C.C. Chang, C.Y. Chen, X. Zhao, et al., Analyst 139(2014) 3347-3351. doi: 10.1039/C4AN00253A
X. Han, M. Cao, M. Wu, et al., Analyst 144(2019) 2584-2593. doi: 10.1039/C8AN02020E
M. Cao, X. Han, C. Lu, et al., Allergy 76(2021) 567-571. doi: 10.1111/all.14500
X. Han, M. Cao, B. Zhou, et al., Talanta 219(2020) 121301. doi: 10.1016/j.talanta.2020.121301
B. Jiang, F. Li, C. Yang, et al., Anal. Chem. 87(2015) 3094-3098. doi: 10.1021/acs.analchem.5b00041
X. Zhong, L. Qiao, N. Gasilova, B. Liu, H.H. Girault, Anal. Chem. 88(2016) 6184-6189. doi: 10.1021/acs.analchem.6b01142
I.J. Ansotegui, G. Melioli, G.W. Canonica, et al., World Allergy Organ. J. 13(2020) 100080. doi: 10.1016/j.waojou.2019.100080
J.T. Dias, G. Svedberg, Sci. Rep. 7(2017) 6837. doi: 10.1038/s41598-017-07030-0
E.J. Nam, E.J. Kim, A.W. Wark, et al., Analyst 137(2012) 2011-2016. doi: 10.1039/c2an15994e
S. Wang, B. Zhou, N. Wang, et al., Chin. Chem. Lett. 31(2020) 2897-2902. doi: 10.1016/j.cclet.2020.03.037
Y. Tan, J.F. Halsey, T. Tang, et al., Biosens. Bioelectron. 77(2016) 194-201. doi: 10.1016/j.bios.2015.08.071
S. Flicker, I. Zettl, S.V. Tillib, Front. Immunol. 11(2020) 576255. doi: 10.3389/fimmu.2020.576255
O. Seifert, Langmuir 11(2019) 919-929.
S. Steeland, R.E. Vandenbroucke, C. Libert, Drug Discov. Today 21(2016) 1076-1113. doi: 10.1016/j.drudis.2016.04.003
F. Jabs, M. Plum, N.S. Laursen, et al., Nat. Commun. 9(2018) 7. doi: 10.1038/s41467-017-02312-7
F. Zamani, E. Izadi, Chin. J. Catal. 35(2014) 21-27. doi: 10.1016/S1872-2067(12)60685-8
O. Awotunde, S. Okyem, R. Chikoti, J.D. Driskell, Langmuir 36(2020) 9241-9249. doi: 10.1021/acs.langmuir.0c01550
L. Zeng, Z. Liao, W. Li, et al., Chin. Chem. Lett. 31(2020) 1162-1164. doi: 10.1016/j.cclet.2019.10.015
L. Liang, J. Yin, J. Bao, et al., Chin. Chem. Lett. 30(2019) 167-170. doi: 10.1016/j.cclet.2018.01.049
O.K. Adeniyi, A. Ngqinambi, P.N. Mashazi, Biosens. Bioelectron. 170(2020) 112640. doi: 10.1016/j.bios.2020.112640
Y. Tan, J.F. Halsey, T. Tang, et al., Biosens. Bioelectron. 77(2016) 194-201. doi: 10.1016/j.bios.2015.08.071
H. Li, C. Chen, Z.M. Li, et al., Front. Pharmacol. 11(2020) 498. doi: 10.3389/fphar.2020.00498
R. Rignault-Bricard, F. Machavoine, S. Mecheri, et al., Allergy 73(2018) 2342-2351. doi: 10.1111/all.13480
P. Lin, M. Cao, F. Xia, et al., Adv. Sci. 8(2021) 2004115. doi: 10.1002/advs.202004115

Scheme 1 Schematic illustration of our immunosensor for quantitative detection of total IgE in serum samples with a significant signal enhancement.

Figure 1 (a) Zeta potential of magnetic nanoparticles. 1: Fe3O4@SiO2, 2: Fe3O4@SiO2-NTA, 3: Fe3O4@SiO2-Ni-NTA, 4: Fe3O4@SiO2-NTA@026 sdab; (b) FTIR spectra of Fe3O4@SiO2 and Fe3O4@SiO2-NTA@026 sdab; (c) TEM images and (d) DLS of Fe3O4@SiO2 and Fe3O4@SiO2-NTA@026 sdab; (e) TGA data of Fe3O4@SiO2-NTA and Fe3O4@SiO2-NTA@026 sdab. The amount of 026 sdab coupled onto the magnetic nanoparticles was calculated to be 1.267 μmol/g. The detailed calculation was shown in Supporting information.

Figure 2 (a) The CL images and (b) their corresponding CL intensity of IgE quantitative detection with our immunosensor; (c) The CL images of IgE quantitative detection with Fe3O4@SiO2-NTA@026 sdab without amplification system and their corresponding CL intensity (d).

Figure 3 The CL images and their corresponding CL intensity of the immunosensor at different temperature (a, b), pH (c, d) and storage time (e, f). The CL intensity was normalized.

Figure 4 Specific experiment on interfering substances. The CL image (a) of different potential interfering substances and their corresponding CL intensity (b); The CL image (c) of IgE in the presence of different potential interfering substances and their corresponding CL intensity (d).

Figure 5 (a) Comparison of the results of 20 samples detected by immunosensor and ImmunoCAP; (b) The CL intensity of the IgE in serum from 44 breast cancer patients and 15 non-cancer ones detected by immunosensor; (c) The distribution of total IgE concentrations in cancer and non-cancer human serum detected by our immunosensor. ****P < 0.0001.

 扫一扫看文章

扫一扫关注我们
 DownLoad:
 下载:
下载:
 下载:
下载: