College of Electronic and Optical Engineering & College of Microelectronics, Institute of Flexible Electronics (Future Technology), Nanjing University of Posts & Telecommunications (NUPT), Nanjing 210023, China
b.
Key Laboratory for Organic Electronics and Information Displays & Jiangsu Key Laboratory for Biosensors, Institute of Advanced Materials (IAM), Nanjing University of Posts & Telecommunications, Nanjing 210023, China
c.
College of Chemistry and Environmental Engineering, Shenzhen University, Shenzhen 518060, China
Received Date:
17 June 2021 Accepted Date:
11 August 2021 Revised Date:
10 July 2021 Available Online:
15 April 2022
Abstract:
Molybdenum disulfide (MoS2), a typical two-dimensional transition metallic layered material, attracts tremendous attentions in the electrochemical energy storage due to its excellent physicochemical properties. However, with the deepening of the research and exploration of the lithium storage mechanism of these advanced MoS2-based anode materials, the complex reaction process influenced by internal and external factors hinders the exhaustive understanding of the lithium storage process. To design stable anode material with high performance, it is urgent to review the mechanisms of reported anode materials and summarize the related factors that influence the reaction processes. This review aims to dissect all possible side reactions during charging and discharging process, uncover internal and external factors inducing various anode reactions and finally put forward strategies of controlling high cycling capacity and super-stable lithium storage capability of MoS2. This review will be helpful to the design of MoS2-based lithium-ion batteries (LIBs) with excellent cycle performance to enlarge the application fields of these advanced electrochemical energy storage devices.
With the fast development of modern society, the consumption of fossil fuels has been ascending in the past few decades, resulting in a large amount of carbon release and environmental pollution. Besides, due to the non-renewable nature of fossil fuels, energy shortage is now emerging as a central issue worldwide. With the development of energy storage technology, lithium-ion batteries have achieved a great success in the commercial application and almost dominated the battery market worldwide [1, 2]. Nowadays, LIBs have been widely used in the field of digital devices and electric vehicles, which effectively alleviates energy and environmental problems [3]. Graphite, one of the most conventional intercalation anode materials of lithium-ion battery, has been industrialized and commercialized successfully, taking the advantages of its low cost, facile preparation procedure and high conductivity. However, the intercalation-type graphite is about to reach limitation in capacity in the near future [4] due to the relatively low theoretical capacity of 372 mAh/g [5], making it difficult for commercial intercalation-type graphite-based LIBs to satisfy the increasing requirements for energy conversion device. Therefore, it is necessary to explore alternative materials with different storage mechanisms, high reversible capacity and long cycle life to replace traditional graphite material [6, 7].
In recent years, two-dimensional transition metal disulfides, especially MoS2, have attracted much attention [8-10], which aroused broad interests in the field of nano-electronics [11], optoelectronics [12], energy storage [13] and catalysis [14] due to their attractive physical and chemical properties and layered structure. The atoms in a single MoS2 layer are bonded by covalent bonds while the interaction between layers relies on the relatively weak van der Waals force [15, 16], which endows the MoS2 layers with a promising property for Li+ accommodation and transport. This new anode material offers a much higher theoretical cycle capacity (~670 mAh/g) compared with graphite [17, 18], and its lithium storage mechanisms are combined with both intercalation and conversion mechanisms, which is significantly different from those of conventional electrodes with only Li+ intercalation process. Nevertheless, the 2D-structural MoS2 would be pulverized and easily collapse which can convert into Mo and Li2S in the first discharging process. The activity of formed Mo significantly affects the reversibility of conversion reaction while the dissolution and shuttle effect of polysulfide may lead to a rapid capacity decay, which seriously hinders the wide applications of MoS2-based anode materials in LIBs [19-21]. To reveal the reasons regarding these shortcomings of MoS2-based anode materials, understanding of the electrochemical process during cycling and the structural changes of this kind of anode material is urgently needed.
One of the main problems for MoS2 serving as anode materials is that the lithium storage mechanisms in MoS2 are too complex to be understood exhaustively for both internal and external factors including voltage window and current density during cycling, size and morphology of initial MoS2 and strain-engineering. For instance, the initial phase of MoS2 affects the electronic conductivity of anode material, which leads to different charge transfer rates and ends up in different rate performance of LIBs. Meanwhile, the working voltage windows influence the reaction pathway, resulting in diverse discharging and charging capacities. Thus, it is vital to utilize superior methods to uncover the inner relationship between different mechanisms and inherent properties of anode materials. Recently, more and more advanced characterization techniques especially in situ facilities have been successfully implemented to clarify Li+ storage mechanisms under practical working conditions. For example, taking advantage of in situ electron microscopy (EM) [22], in situ X-ray diffraction (XRD) [23], in situ X-ray absorption spectroscopy (XAS) [24] and in situ Raman spectrum (Raman) [25], we are able to characterize the real-time information on the morphology, lattice parameter, chemical valence, and crystal phase transition of MoS2 during charge and discharge, which can provide us with a profound understanding of how these factors influence the mechanism.
Additionally, some MoS2-based anode materials exhibit extra reversible capacity over their theoretical value, which is an interesting phenomenon. The reasons for the tremendous extra capacity are still under debate, and the controversies can be mainly divided into 3 branches: (1) The extra capacity is due to the Li+ storage capacity of the interface between the metal and lithium salt particles while the charge is compensated by additional electrons on the metal surface [26-28]; (2) Metallic Mo produced at the end of discharging process can absorb a large amount of Li+ and the lithium storage capacity is closely related to the morphology of Mo [29]; (3) Multi-layered ion adsorption and metal-metal interaction at both the surface and edge of 2D-monolayers TMDs [30]. However, there is rare report on these precise mechanisms and the reasons of the extra capacity, since the lacking of advanced characterization methods to obtain convincing evidence to confirm this appealing phenomenon.
Herein, we briefly review the lithium storage mechanisms of MoS2. To the best of our knowledge, systematical summary about the reaction mechanisms of MoS2-based electrode and complex factors controlling reversibility of conversion reaction is rarely reported. In this review, we first revisit lithium storage mechanisms of MoS2-based anode materials in order to discuss the phenomena during cycling which have not been deeply studied, and then summarize different mechanisms as well as their causes and finally enlighten or give some inspirations to further studies aiming to improve the performance of MoS2-based LIBs. We sincerely hope this review will be helpful to the acceleration of the practical applications of MoS2-based LIBs with high-performances in broad fields.
2.
Structure of MoS2
The 'layered' structure of MoS2 comes from hexagonal arrangement of Mo and S atoms which form S–Mo–S sandwiches and are bonded by weak van-der-Waals forces. The two S atoms of 1H phase are aligned, while the two S atoms of 1T phase are staggered to form octahedron. For 1T phase, its metastable structure can be distorted to some extent, forming a distorted 1T phase which is called 1T' phase. The schematic of three common crystal phases of MoS2 and their corresponding band structures are shown in Figs. 1a and b [31, 32]. It is generally acknowledged that the trigonal prismatic (1H-MoS2) is semi-conductive while 1T and 1T' is metallic phase. From Fig. 1b, it can be gained that 1H-MoS2, 1T-MoS2 and 1T'-MoS2 have the band gap of 1.67 eV, 0 eV and 0.22 eV, respectively. As electrode materials, the intrinsic conductivity directly decides the electrode reactions and the cycle performance like rate performance.
Figure 1
Figure 1.
(a) Structural unit and geometrical structure of H-MoS2, T-MoS2 and T'-MoS2 and (b) corresponding band structure respectively. Reprinted with permission [31]. Copyright 2014, American Chemical Society. (c) Evolution of the band structure of 2H-MoS2 calculated for samples of decreasing thickness. Reprinted with permission [32]. Copyright 2010, American Chemical Society.
Thus, it is necessary to discuss 3 crystal phases with different electronic properties to enhance the performance of this advanced anode material. Some crucial parameters of 3 crystal phases are shown in Table 1. According to the band gap theory, the band gap structures of different crystal phases reflect their conductivity which is closely related to the electron transmission ability leading to different properties in Li+ storage reaction. Besides, the gap of 2H-MoS2 is also determined by the number of layers (Fig. 1c). From bulk material to single layer, the gaps increase from ~1.29 eV to ~1.8 eV [33]. Besides, phase engineering is an effective way to change the lithium storage mechanisms, which will be discussed below.
Table 1
Table 1.
Comparison of performance of MoS2 with different phase.
It is generally acknowledged that the fabrication methods have an enormous influence on the physical and chemical properties of MoS2. Usually, synthesis methods of MoS2 commonly include hydrothermal method [34], chemical vapor deposition (CVD) [35], microwave plasma method [36], arc process [37] and electrochemical method [38]. Besides, the structure of MoS2 can also be influenced by different fabrication methods. MoS2 fabricated by these methods is usually H-MoS2. On the contrary, 1T-MoS2 is hard to synthesize. Recently, some 1T-MoS2 synthesis methods have appeared. Many researchers synthesize 1T-MoS2 by hydrothermal process [39-43]. Additionally, ion intercalation is another main-stream method. Liu et al. fabricate large-scale 1T-MoS2 by ammonium ion intercalation [43]. Li et al. synthesize 1T-MoS2 by lithium intercalation into H-MoS2 [44]. These reports provide some feasible fabrication methods of 1T-MoS2which contribute to application of 1T-MoS2 in LIBs.
Till now, the lithium storage mechanisms of MoS2-based anode materials have not been exhaustively investigated. Some researches demonstrate that the reversible capacity of MoS2-based anode materials is consistently higher than the theoretical capacity of the litigation conversion reactions [45-48]. This appealing phenomenon attracts the attention of researchers, and some advanced characterization methods have been designed to study deep-seated mechanisms, which is of vital importance to the in-depth understanding of the electrochemical behaviors for MoS2-based anode materials.
3.
In situ techniques for MoS2-based LIBs
With the depth of the understanding of anode reaction mechanisms, more and more pathways of anode reaction have been proposed. Unfortunately, constricted by the inherent disadvantages of traditional ex situ characterization techniques, the signals for the reaction under real-time working conditions are quite difficult to be collected. In this case, the in-depth understanding of reaction mechanisms and the structural changes of the anode electrodes are quite challenging. In situ characterization techniques are the powerful tools to break this Gordian problem by providing a real-time observation of reaction taking place in MoS2 anode material under real working conditions. These advanced techniques provide a real-time perspective to reveal how the different factors affect reaction process. Fig. 2 summarizes the widely-used in situ characterization techniques and their respective usage in the studies of MoS2-based anode materials [49-52].
Figure 2
Figure 2.In situ techniques commonly applied in characterization of MoS2-based anode materials. Characterization of electrode materials includes diversified perspectives in the morphology, crystal phase, lattice, interface and composition of diverse anode materials. A picture of the characterization index can be obtained in real operando conditions by implementing these advanced facilities (In situ XAS. Reprinted with permission [24]. Copyright 2018, American Chemical Society. In situ XRD. Reprinted with permission [23]. Copyright 2012, Elsevier. In situ Raman. Reprinted with permission [25]. Copyright 2019, Wiley-VCH. In situ X-ray photoelectron spectroscopy (XPS). Reprinted with permission [49]. Copyright 2017, American Chemical Society. Cryo-electron microscopy (Cryo-EM). Reprinted with permission [50]. Copyright 2019, Wiley-VCH. In situ transmission electron microscopy (TEM). Reprinted with permission [22]. Copyright 2014, American Chemical Society. In situ atomic force microscopy (AFM). Reprinted with permission [51]. Copyright 2019, Springer. In situ optical microscopy (OM). Reprinted with permission [52]. Copyright 2018, Springer.)
Possibly, one of the most widely-used characterization techniques, in situ XAS demonstrates the chemical valence and electronic structure by using X-ray to excite the core electron of active species into vacant orbitals (XANES model) [53, 54]. This technique requires unnecessarily being good crystal or long-range ordered structures for the samples, and has no damage to the initial samples. It is clear that the change of the peaks of the spectrum reflects the relative quantities and category of active species. Practically, the change of active species showing the pathway of the electrode reaction can be detected through the variation of peak intensity and locations. The charging and discharging products of pristine MoS2 electrodes can be systematically investigated by operando XAS characterization, which evaluates the properties of the active species such as the electronic and chemical evolution during cycling [24].
In situ XRD has unique advantages in characterizing the structure evolution of electrode materials during charging and discharging process. For example, the change of diffraction angle is the reflection of the change of lattice spacing. Thus, the structure of active species can be examined clearly. Comparing to ex situ XRD method, it provides a new prospective of characterizing electrochemical reaction process and structure changes of anode materials in real time. In situ XRD characterization of MoS2 electrode shows the feature peaks of MoS2 shifting, which clearly demonstrates the d-spacing changing in the intercalation reaction process [23]. The decreasing of the scattering angle values shows an expansion of the layers, which is a reflection of the Li+ inserting. It is generally acknowledged that the crystal phase transition is due to the intercalation of Li+. Accordingly, crystal phase transition can be studied by the shift of characteristic peaks for MoS2 during lithium intercalation [55]. Besides, the change of the peak intensity enables the quantitative analysis of different substance and its reaction extent.
Owing to the sensitiveness of varying rotation/vibration states of different molecules, in situ Raman spectroscopy has been widely implemented in the characterization of crystal phase transition of MoS2. The shift of Raman peaks and the descending and recovering process of peak intensity indicate the crystal phase transition of MoS2 in the discharging and charging cycles [25]. The variation of peak locations is an effective evidence of crystal phase conversion of MoS2. In conclusion, in situ Raman spectroscopy can provide an intuitional way for demonstrating the variation of crystal phase transition and analyzing the component variation as well.
In situ XPS provides real-time information of the valence for active species. By studying the variation of intensity of different peaks and the shift of characteristic peaks, the semi-quantitative component ratio can be measured, which provides the direction of reactions and chemical environment changes. For example, with the deposition of Li+, the peak intensity of Mo 3d5/2 would be ascending much quicker than other peaks, which indicates the formation of Mo4+. Besides, the entire spectrum undergoes a ~0.3–0.4 eV shift to higher binding energy after initial Li deposition, which is due to the band bending induced by electronic interaction of MoS2 with the deposited metal [49].
3.2
In situ micro imaging analysis
OM is able to observe the multicolor variation of the specimens which has an advantage over the EM in some conditions where high-resolution ratio characterization is not required. In situ OM can intuitionistic ally demonstrate the variation of sample by displaying the color change of images. In this way, the reversibility of intercalation reaction from different intercalation direction (top surface and edges) is easily to be confirmed [52]. In situ OM indicates the real-time color change of the MoS2 sheet, which indirectly confirms the intercalation stability of electrode.
In situ AFM can be used to reveal the morphology, physicochemical properties and dynamic evolution of the electrode surface so as to realize the interface visualization. The electrochemical deposition process, metal corrosion process and change of membrane thickness can be detected by AFM probe, which provides the real-time surface parameter contributing to the study of surface behaviors. AFM have been widely used in SEI film characterization [46, 56].
In situ TEM can evaluate the structure change process as well as morphology and observe the lithium-ion diffusion phenomenon in real-time working conditions at atomic scale. The development of in situ TEM provides a powerful tool to understand the mechanism of atom migration in lithium-ion batteries. From the perspective of morphology, the dynamic structural changes can be easily demonstrated by operating in situ high-resolution TEM (HRTEM). During charging process, the pristine 2H-MoS2 has transformed into 1T-MoS2 after the wavy front passed by which is consistent with the crystal phase transition process shown by the electron diffraction picture. From the perspective at atomic scale, the movement of the wavy clearly reflects the litigation process or rather the migration of Li+. This appearance suggests that it is essential to understand the kinetics of the lithium ions transport to ensure the dynamic interfacial structure. Additionally, the boundary migration can be studied from the atom scale image for the arrangement of atoms [22]. To sum up, in situ TEM provides a more direct observation to the microstructure changes of materials with external signals at real working conditions, which is of great significance for expanding the experimental means of materials at the micro scale, understanding the nature of various dynamic reactions, and designing materials with novel properties.
Cryo-EM is an important tool for atomic and molecular characterization in the researches of biomolecules in their native state [57]. Apart from native applications in the field of biology, Cryo-EM can also be applied to many key areas such as batteries [58] and catalysis [59]. Interfacial nanostructures evolved in batteries can be characterized by implementing Cryo-EM in operating conditions [60]. The discharging products of metallic Mo of MoS2-based anode materials and their states are characterized by this advanced technique [50]. Cryo-EM makes it possible to directly uncover complex phenomenon such as the formation of solid electrolyte interphase (SEI) and production after charging and discharging process, which will deepen the understanding of the lithium storage mechanisms of MoS2-based LIBs.
4.
Reactions involved in discharging and charging process
Electrode reactions in battery are closely related to voltage windows. Thus, we discuss the complex reaction process in the order of voltage. Fig. 3 sorts out the behaviors of active species at different potentials.
Figure 3
Figure 3.
Charge and discharge process according to the potential distribution.
Owing to these advanced in situ characterization technique, complex lithium storage mechanisms have been uncovered generally. A summary of relevant factors influencing reaction mechanisms and reaction equations is presented in Fig. 4 respectively. It clearly summarizes sorts of mainstream mechanisms and compares different reaction process.
Figure 4
Figure 4.
Summary of the different reaction mechanisms of MoS2 as LIBs anode material.
There are many factors related to the reaction mechanisms making the reaction process quite complicated. Thus, it is not necessary to debate one uniform conclusion while the summary of the different mechanisms in different conditions is helpful to direct the design of MoS2-based anode materials.
In the domain of first conversion process (1.1–0.01 V), layered structure of MoS2 breaks down into small sheets and subsequently the nano sheets convert to Li2S and Mo. However, since the formed inert Mo is hard to react with Li2S to reform MoS2, the Li2S and S become the real redox couple leading to irreversible conversion mechanism, as a result, the battery performs like a Li-S battery. This means that it is important to study the redox reaction of active species in anode materials to uncover the reasons leading to different electrochemical reaction pathways, which will be helpful to control these mechanism-influencing factors for the design of high-performance MoS2-based anode materials.
4.1
Discharging process
As the most important part of anode reaction, redox reaction of anode materials is the essence of energy storage. Different oxidation pathways lead to diverse production which in turn influences the reactions in the opposite direction, and thus the cycling reversibility and capacity are affected. Accordingly, it is necessary to discuss different behaviors of activities during anode reaction to exhaustively understand the process of energy conversion. The products after discharging process are closely related to the intercalation and conversion process. Thus, it is necessary to deeply analyze the behaviors of anode active species during discharging process.
4.1.1
Intercalation reaction
It is generally acknowledged that the intercalation reaction occurs around ~1.1 V (vs. Li/Li+) during the first discharging process. Above 1.1 V, lithium ions are first stored in the interlayer of MoS2, which is often accompanied by the crystal phase transformation. The crystal phase conversion from 2H-MoS2 to 1T-LixMoS2 is a widespread conclusion, and the intercalation reaction is reversible [24, 60, 61].
At the beginning of intercalation process, Li intercalates into the van der Waals gaps of 2H-MoS2 to donate electrons to the slabs which expands the layer spacing [14]. As the increase of intercalated Li+, the crystal phase transition from 2H to 1T process happens (Fig. 5a). The intercalation directions of ions can be divided into two branches: 1) top channels and 2) edge channels (Figs. 5b and c). Small scale alkali ions such as Li+ and Na+ can intercalate into van der Waals gaps from both top and edge channels while large ions (K+) could only intercalate from edge channels [52].
Figure 5
Figure 5.
(a) Galvan static discharge curve representing the litigation process. Reprinted with permission [14]. Copyright 2013, National Academy of Sciences. (b) Schematic representation of alkali–ion intercalation through a single MoS2 layer. (c) Li+, Na+ and K+ intercalation into MoS2 through top and edge channels. Reprinted with permission [52]. Copyright 2018, Springer. (d) Enlarged XRD patterns of the fully charged MoS2 electrodes after cycling in different voltages for one cycle. (e-h) Corresponding TEM images with contrast profiles along the arrow-direction indicating average interlayer distance. (i) Scheme for the structural changes and lithium storage performance of MoS2 cycled in different voltage windows. Reprinted with permission [62]. Copyright 2019, Wiley-VCH.
The whole reaction process of the MoS2 anode material is closely related to the voltage window, since those different reaction steps occur at different potential. Taking Zhu's experiment as an illustration [62], the d-spacing (002) for the electrodes cycled in 3.0–1.0 V and 3.0–0.6 V are a little larger than that of pristine MoS2 (Figs. 5e-g). When the electrodes cycled in 3.0–0.5 V, the peak (002) disappears (Fig. 5d), indicating that MoS2 can only preserve the layered structure at a potential above 0.6 V. Additionally, the deeper litigation and larger interlayer endow MoS2 with higher capacity and faster kinetics within 3.0–0.6 V. The different performance of diverse mechanisms will be discussed below.
4.1.2
Conversion reaction
According to the conversion reaction equations in Fig. 3, after a deep discharging process, metallic Mo appears in the products. The existence of metallic Mo in the discharging production has reached an agreement. However, as to the formation of the metallic Mo, some reports suggest that the Mo is in the atomic state including Mo cluster [25, 29, 63] and individual Mo atom [50] while other reports insist that the state is nano particle or nano grain [25, 29]. The geometric structure and electronic structure of Mo are shown in Fig. 6.
Figure 6
Figure 6.
The possible state of Mo in litigated MoS2.
Another noteworthy phenomenon is that the scale of Mo metal clusters is closely related to the dimension or rather the number of layers of MoS2 anode material. The size of the Mo metal clusters in monolayer-MoS2 is above 1 nm (1.16 nm) on average [50], while Mo clusters formed from bulk materials (3D) are around 2–5 nm. This may be due to a high kinetically effect of monolayer MoS2, making it easy for Mo atoms to transport in comparison with bulk material.
Besides, the litigation degree at different regions is distinctive, so the existence forms of electrode materials differ from one another. From Figs. 7a and b, it is obviously that the existence forms can be divided into 4 states at the discharging process. Before intercalation reaction, the crystal phase of the material is H/T.
Figure 7
Figure 7.
(a) Annular dark-field Cryo-STEM image of partially litigated bilayer-MoS2.
(b) FFT patterns of selected regions in (a). (c) Annular dark-field Cryo-STEM image of partially litigated monolayer-MoS2. (d) Schematic illustration of the conversion reaction in monolayer-MoS2. Reprinted with permission [50]. Copyright 2019, Wiley-VCH.
With the increase of lithium degree, the original H or T phase MoS2 turns into T'-MoS2, but no clear T' phase is observed between the initial and fully litigated regions in monolayer-MoS2, which demonstrates that the adsorption rather than intercalation reaction occurs [50]. Monolayer-MoS2 does not undergo an intercalation reaction. After deep litigation, the molybdenum–sulfur bonds break. Eventually, the Mo atoms migrate and form Mo clusters. The reaction mechanism is not the common intercalation because monolayer-MoS2 cannot undergo an intercalation process (causing by its special monolayer structure). To the best of our knowledge, the absorption reaction of Li+ is much faster than intercalation process. Besides, for monolayer-MoS2, the Li ions are easily absorbed on the active material to initiate a reaction, which may provide a direction of promoting the rate performance. However, no even trace of Mo clusters is detected in the discharged bilayer-MoS2 (Figs. 7a and b). It is generally acknowledged that bilayer-MoS2 is able to produce more Mo atoms in a certain area after a complete discharging process. The more individual Mo atoms form in a certain area, these atoms are more easily gathered and then generate Mo clusters or Mo nanoparticles. Herein, we strongly recommend more in situ and operando characterization techniques coordinating with theoretical calculation can be implemented to indicate the behavior of Mo atoms and explain the formation mechanisms of metallic Mo with different scales.
Fig. 7c shows the image of partially litigated monolayer-MoS2. In the transition region of litigated monolayer MoS2, the individual Mo atoms appear. On the contrary, fully litigated monolayer-MoS2 mainly shows Mo clusters. This demonstrates an amazing path that the Mo atoms migrate individually, when molybdenum–sulfur bonds break during deep litigation, and eventually become stabilized after forming clusters (Fig. 7d) [50].
Some opinions have been put forward that the conversion reaction of pristine MoS2 in the litigation/de-litigation process can also be actually reversible [25, 64, 65]. Mo rather than Li2S is oxidized and eventually transforms into MoS2. In Zhu's report, the product of discharging and charging process is characterized by in situ Raman spectra [25]. The recovery of the characteristic peaks of 2H-MoS2 indicates the reversibility of conversion reaction. An emerged crucial phenomenon is that the formation of metallic Mo significantly improves the cycle stability and makes the conversion almost reversible. To find out the reason of this interesting phenomenon, DFT calculation is implemented. The calculation results demonstrate the activity of metallic Mo with different scales. The distance of Li and S becomes much larger after being absorbed on the Mo63 cluster (3.93 Å) than bulk Mo (2.39 Å), with almost the same the absorption energy of Li2S on Mo63 cluster (−4.74 eV) and bulk Mo (−4.72 eV), validating the strong interaction between Li2S and Mo63 cluster over general bulk Mo (Figs. 8a-c).
Figure 8
Figure 8.
(a) Bulk MoS2 and (b) Mo63 cluster from DFT calculations. (c) Comparison of the absorption energy and Li–S distance of Li2S absorbed on bulk Mo and Mo63 cluster. Reprinted with permission [25]. Copyright 2019, Wiley-VCH. (d) The HRTEM images of the 1T-MoS2/graphene electrode after 100th, 300th, 500th discharge cycles. (e) CVs of the 2H-MoS2 nanosheets electrode during the initial three cycles for LIBs and CVs of the 1T-MoS2/graphene electrode during the initial three cycles and after 800th cycle for LIBs. (f) Cycle behaviors of 1T-MoS2/graphene electrode at 1000 mA/g for LIBs. Reprinted with permission [29]. Copyright 2018, Elsevier.
In our former research, the products after cycling process are also characterized by HRTEM (Fig. 8d). With the increase of cycle number, the scale of metallic Mo significantly reduces. It is very clear to see many light spots for Mo/Lix clusters after 500th discharge cycles. As shown in Fig. 8e, comparing to initial 2H-MoS2, 1T-MoS2/graphene electrode shows almost no oxidation peak for S at the voltage of 2.3 V even after 800 cycles. This indicates that 1T-MoS2/graphene electrode experiences a highly reversible conversion process. Besides, we also use DFT calculation to successfully demonstrate that metallic Mo has the ability to store a large amount of Li+, which provides an excellent increasing capacity (Fig. 8f) [29]. Moreover, the lithium storage capacity of Mo clusters is closely related to the number of Mo atoms in clusters.
Through above analysis, it is reasonable to believe that the activity of metallic Mo is closely related to its size. In conclusion, by controlling the scale of metallic Mo in discharging production, the reversible charge and discharge of MoS2-based anode materials can be achieved, avoiding the reaction processes with similar mechanism to Li-S battery. Nevertheless, the mechanism behind the abnormal phenomenon is still lack of research because the confusing electrode interface condition is beyond the traditional characterization approaches. Li et al. uncover that the extra capacity of magnetic metallic oxide electrode comes from the spin-polarized electrons of metallic nanoparticles using self-build in situ magnetometry [66]. This new breakthrough offers a new inspiration that the transition metal like Mo also has a mechanism related to the extra storage capacity due to the lithium storage capability with metallic Mo. However, restricted by means of characterization, the reason of lithium storage mechanism of metallic Mo is still lack of investigation. The phenomenon that Mo with different morphologies has different lithium storage capacity also needs to be further studied. Here, advanced characterization methods are urgently needed to break the limits of traditional characterization methods and explain the lithium storage mechanism of metallic Mo.
As a metallic product, Mo can act as a conductive network in anode material after first discharging process [63]. In Wan's group, the battery system becomes a Li-S battery with Mo nanoparticles. Owing to the conductivity of Mo conductive network structured by the formation of Mo nanoparticles after the first rapid discharging process, the cycling performance is promoted since the electrical connectivity of the insulating Li2S is improved in another way [63]. However, it is true that the conductivity contributes to the conversion of Li2S to S. At the same time, it is difficult for Mo to react with Li2S to reform MoS2.
4.2
Charging process
As what we have discussed above, the redox reaction of discharging process is generally decided and the reversibility of intercalation and deintercalation reaction is closely related to voltage (Part 4.1.1). However, the oxidation reactions during charging process are still lack of systematically discussion. Several redox reactions during charging process lead to different cycle mechanisms which are exhaustively summarized below.
4.2.1
Oxidation of Mo
In Fig. 9a, the peaks around 1.74 V are attributed to the formation of Mo6+ sulfides (mostly MoS3), which is quite different from common knowledge. Nevertheless, the operated CV analysis in many reports demonstrates no peaks around 1.8 V but only peaks around 1.5 V can be observed, which is attributed to the formation of MoS2. Mass spectra of the sample in Figs. 9b and c show the variation of different compounds. After the initial charge process, MoS42- fragments (Fig. 9b) and Li2Mo2+ fragments (Fig. 9c) are observed, indicating the existence of MoS3 and Mo respectively. This indicates that metallic Mo has the ability to adsorb lithium, which may contribute to the extra capacity. It is the close contacts between Li2S, Mo and carbon nano fibers (CNF) that lead to the generation of Mo6+ [67]. Formed Mo6+ has the ability to bind with surrounding poly sulfides around the surface of the Mo nanoparticles to form MoS3. Besides, the charge-transfer resistances of carbon nano fibers decorated with molybdenum disulfide sheets (CNFs@MoS2) descend with the increase of cycle number, which is due to the remaining Mo nanoparticles. The ascending utilization of S also contributes to the increase of capacity during the initial tens of cycles.
Figure 9
Figure 9.
(a) The first five CVs of the CNFs@MoS2 anode. (b, c) Mass spectra of the sample before (b) and after (c) the initial charge process (CNFs@MoS2). Reprinted with permission [67]. Copyright 2014, Wiley-VCH. (d) Schematic illustration of the mechanisms during redox reaction for NC-S and (e) NC/MoS3-S NBs-based batteries. Reprinted with permission [68]. Copyright 2020, Wiley-VCH.
Guo et al. find that amorphous MoS3 has a strong binding ability to confine poly sulfides [68]. Theoretical calculation indicates that MoS3 has a higher binding strength than simple carbon materials. Additionally, MoS3 acts as a catalyst during the conversion of poly sulfides (Figs. 9d and e). Comparing to N-doped carbon (NC) materials, amorphous MoS3 reduces the energy barrier for high-order polysulfide conversion between Li2S8, Li2S6 and Li2S4 to ~0.1 eV (vs. 0.87 eV of NC). This phenomenon offers a new way of promoting cycle stability of MoS2-based anode materials by adding or in situ synthesizing MoS3 in MoS2-based LIB system as Zhou's report [67].
Ye et al. demonstrate that MoS3 exhibits sulfur-like behavior with large reversible specific capacity [69]. MoS3 anode is equivalent to S anode making the whole battery perform like a Li-S battery. In situ XAS experiments indicate that MoS3 does not cause significant Mo-S bond breaking or Mo-Mo bond formation. Besides, there is no significant Li2S or polysulfide detected during the whole cycling process. This amazing discovery may explain the oxidation peaks around 2.3 V in Fig. 9a. MoS3 can work as a sulfur-consolidating additive to stable the conversion of poly sulfides and as a sulfur anode with high stability providing excellent capacity.
Up to now, there are still some problems needed to be solved. The capacity of MoS2-based LIBs usually decays after few hundreds of cycles, which may impute to the collapse of anode structure. Besides, the formation mechanisms of Mo6+ is still lack of studies. Further studies around the formation reasons of Mo6+ are strongly recommended to utilize this phenomenon to improve the lithium storage potentials of MoS2-based LIBs. What is more, the capacity decay of anode materials with this mechanism also needs to be investigated to direct the manufacturing of high-performance LIBs with long life.
4.2.2
Oxidation of S and behaviors of poly sulfides
The conversion reaction of MoS2 is unambiguously irreversible and the battery system behaves like a lithium-sulfur (Li–S) battery that has been reported by Liang et al. [24]. As the Cyclic Voltammetry (CV) results shown in Fig. 10a, the peak at 0.5 V corresponding to the conversion reaction is only observed in the first cathodic scan while the strong peak at 1.9 V corresponding to the reduction of S appears in the following scan. Besides, the oxidation peak of Li2S into S at 2.3 V is well discerned in the charging process. It is obviously indicated that Li2S/S become the sole redox couple in the MoS2 electrode in following cycles and the battery behaves like a Li–S battery.
Figure 10
Figure 10.
(a) Cyclic voltammograms of the MoS2 electrode with a discharge cutoff voltage of 0.05 V. (b) In situ and operando S K-edge XAS spectra at different discharge and charge stages. (c) The proposed electrochemical reaction mechanism of the MoS2 electrode. Reprinted with permission [24]. Copyright 2018, American Chemical Society. CV curves of (d) MoSx-rGO and (e) MoS2-rGO. Reprinted with permission [74]. Copyright 2020, Elsevier. (f) CV measurements of the metallic MoS2 nanotube. Reprinted with permission [76]. Copyright 2018, Wiley-VCH.
In situ XAS results in Fig. 10b show that no recovery of fingerprint feature of MoS2 is found in the sulfur K-edge XAS, which indicates the irreversibility of the conversion reaction. This theory is attributed to the irreversible conversion reaction which is caused by the oxidization of Li2S to S at high potential. Thus, the whole battery system acts as Fig. 10c. The shuttle effect of poly sulfides emerging after several deep litigation processes, which is the main reason of the capacity fading of Li–S batteries, becomes the key issue for the MoS2-based electrodes. However, the DEC solution containing a cycled MoS2 electrode maintains colorless after 100th cycle while yellow-gold color of poly sulfides emerges in the solution containing cycled sulfur electrode. This may be attributed to the formed Mo nanoparticles serve as pinning sites for intermediate poly sulfides [70] and unreacted MoS2 provides strong anchoring sties to intermediate poly sulfides [71]. In experiment, they performed the polysulfide adsorption test. After the addition of MoS2, polysulfide solution becomes colorless, which demonstrates MoS2 has the ability to absorb poly sulfides. Besides, 2D-MoS2 flakes can act as a "semipermeable membrane" in Li-S battery systems to constrict the poly sulfides shuttle but enable the electrolyte to pass through and absorb poly sulfides dissolving in electrolyte [72]. Inspired by these results, adding MoS2 is a new method to suppress the dissolution of poly sulfides. However, there is still a problem that cannot be ignored. The added MoS2 can be litigated into smaller nanoparticles or even conversed into final production (Mo and Li2S). Thus, the constrict effect invalids. Further studies are urgently needed to constrain the shuttle effect of poly sulfides in MoS2-based battery systems.
CV curves show that oxidation peaks of S (pristine 2H-MoS2 anode materials) around 2.3 V disappear after 25 cycles. Some reports say that this phenomenon is attributed to the formed Mo nanoparticles could serve as pinning sites for intermediate poly sulfides helping to prevent their dissolution [23, 30, 63, 73]. However, CV curves of 1T-MoS2 show obvious oxidation peaks at 2.3 V. Further researches are recommended to uncover the mechanisms of the absorption effect of formed metallic Mo with different scales and find the diversity between the existences of oxidation peaks of S element in anode materials with different crystal phase. Another interesting phenomenon is step-wise oxidation of sulfur in the charging process. Normally, the oxidation of S2− to S happens at 2.3 V. From Figs. 10d and e, the peaks located at 2.1 V indicates the oxidation of S2− to S−, which demonstrates the formation of poly sulfides [74]. Subsequently, with the increasing of the charging voltage, further oxidation process occurs. Comparing to Fig. 5f, Fig. 5e shows nearly no obvious oxidation peak at 2.1 V, which indicates the formation of poly sulfides. XPS analysis of MoSx-rGO demonstrates the existence of S with multiple states S22- while MoS2-rGO has only one state (S2−). Besides, S22- is reported to be electrochemically active [69, 75], which may contribute to promote lithium storage capacity of MoSx-rGO for providing more active Li+ absorption sites, thus leading to an ultra-high performance (1700 mAh/g at 1 A/g after 200 cycles). Further studies are needed to find out the interaction between Li+ and sulfur compounds, the products after charging process and the change of valence state of sulfur in the whole reaction process.
Jiao et al. synthesize a metallic porous nanotube assembled with vertically aligned metallic MoS2 which provides an extraordinary performance [76]. Fig. 10f shows that there is no obvious reduction peak of 1T-MoS2 around 1.1 V, which is attributed to that 1T-MoS2 does not undergo the intercalation reaction. Besides, an interesting phenomenon is that the intensity of the reduction peaks of 2H-MoS2 anode materials at 2.3 V decreases continuously with cycling. This phenomenon is rarely reported because the mechanisms of ordinary pristine 2H-MoS2 based battery system after a few cycles are similar to Li-S battery. Thus, there will be strong oxidation peaks around 2.3 V. This phenomenon may come from the sulfur depletion during cycling [75]. However, the reason of S depletion still remains unknown. Here, we strongly recommend that more studies can be carried out to find out the true reason.
4.2.3
Reversibility of conversion reaction in delitigation process
Since the theory of the progressive electrode material based on MoS2 was reported, the controversy on the conversion reaction mechanisms has been lasting for a long period of time. Specifically, the reversibility of conversion reaction encountered a debate [13, 23, 48, 72, 77, 78]. Some reports reckon the discharge product of MoS2 cannot be converted to MoS2, which leads to an irreversible conversion reaction [13, 23, 48, 72, 77-80] while other reports thought that the conversion reaction is reversible [25, 64, 65]. At this point, Mo rather than Li2S is oxidized and eventually transforms into MoS2. In fact, there are many factors that influence the reversibility of conversion process. In discharging process, with the depth of litigation, the lattice expands and layers pulverize into nano-particles, which makes it difficult to recover the initial stabled 2D-layered structure in subsequent charging process. Raman analysis of pristine and cycled MoS2 electrodes demonstrates that the Raman peaks of the fully charged electrode are slightly weakened and broadened comparing to pristine MoS2 [25], which is mainly attributed to the low crystallinity of the regenerated MoS2 [81]. In charging process, the oxidation of S2− around 2.3 V hinders the regeneration of MoS2.
As for initial 2H-MoS2, it is scarcely possible to make the conversion reaction absolutely reversible in that the phenomenon of oxidation of S is inevitable. Besides, the shuttle effect and dissolution of poly sulfides make the battery system performs as a Li-S battery. To solve these problems, it is feasible to reduce the size of metallic Mo in discharging production by synthesizing anode material with fewer layers or combining conductive metallic MoS2 with carbon materials to make full use of the activity between Mo and Li2S to promote the conversion reversibility.
5.
Mechanism-influencing factors
With the gradual deepening of the understanding of anode reaction during cycles, the factors influencing mechanisms have flouted out. Summary of some factors significantly impacting the lithium storage of MoS2-based anode materials is shown in Fig. 11.
Figure 11
Figure 11.
Summary of factors influencing mechanism and cycle performance
External factors such as voltage window and current density during cycling can easily be controlled through setting the working conditions. Thus, it may be meaningful and feasible to control the working parameters in practical applications to stable the conversion reaction so as to prompt cycling stability of MoS2-based LIBs.
Voltage window is a main controlling factor which influences the reaction pathway and litigation and de litigation extent of anode materials. MoS2 undergoes an intercalation process at voltage window ranging of ~3.0–0.6 V and conversion reaction process under 0.6 V. Above 0.6 V, the 2D structure can be preserved and a good cycle stability can be remained after hundreds of cycles. Nevertheless, the following disadvantage is that the capacity is much lower than the electrodes which undergoes a conversion reaction happening below 0.6 V. In contrast, structural collapse takes place in the electrode cycling in 3.0–0.5 V showing rapid capacity fading even though this reaction pathway can offer higher capacity (Figs. 5d-i). In a word, the potential control can optimize the cycle performance pathway and choose different reaction mechanisms under different voltage so as to design varieties of batteries for a wide range of application. However, the shortcoming of low capacity (cut off voltage above 0.6 V) cannot be solved since the anode does not undergo a conversion reaction. Accordingly, the only way of producing MoS2 anode materials with high performances is optimizing the conversion reaction to make conversion process more stable.
Current density is closely related to the capacity and production properties. For instance, under high current density, a large size of production can be obtained for the reason that MoS2 cannot be fully litigated. At the same time, the promoting rate performance at high current density ensures the rapid charging and discharging properties of the batteries. It is worth noting that the attentions of researchers on the metallic 1T-MoS2 material skyrockets in the past few years. Comparing to the 2H phase transition metal sulfide material, the metal phase (1T) material has unique band structure and electron arrangement (which is conducive to improve the conductivity of the material). The larger interlayer spacing (vs. 2H), induces a higher ion migration rate. With the attraction of these excellent properties, some researchers have paid much attention to the exfoliation of layered materials and the design of electrodes with a significantly enhanced energy conversion performance by restacking ultra-small exfoliated nano sheets [8, 82, 83]. As we all know, current density has a significant effect on the size of discharging products. Different current density leads to different extent of lithium intercalation. This provides a new way to synthesize MoS2-based materials with different scales, which owes MoS2 a significant size effect. The quantum dots (QDs) of monolayer 2H-TMDs have special optical, electronic and chemical properties [84]. As a result, many researchers are interested in the special properties of the attracting 1T-TMD QDs material. Nevertheless, the synthesis methods for 2D TMD QDs with a high concentration of 1T phase are still lacking. It is generally acknowledged that the synthesis of 2D TMD flakes is the key to obtain 2D TMD QDs with a high 1T phase fraction. Since the normal 2H-MoS2 undergoes a crystal phase transformation process after intercalation reaction, Zeng et al. observe the fragmentation of MoS2 flakes during electrochemical litigation by operating TEM simultaneously [85]. Chen et al. synthesize 1T-MoS2 QDs by using an electrochemical system [86]. A low reduced electrochemical litigation rate (0.001 A/g) leads to the high Li content intercalated in the 1T-MoS2 lattice, which provides a significant inner stress facilitating lattice breaking. Figs. 12a and b clearly explain the advantages of electrochemical intercalation method over chemical methods. The Li+/Li gives a reduction potential of −3.0 V vs. RHE, which is much lower than other chemicals (e.g., LiC4H9 and LiBH4) usually used for chemical litigation. Thus, a deeper litigation process can be easily achieved, which makes full use of lithium storage capacity. The discharging cut off voltage can remarkably influence the reaction path. A low cut off voltage will lead to a conversion reaction from [MoS2]n− into Mo subsequently (Fig. 12a). The relationship between discharging current density and mean size of MoS2 (positively correlated with the value of x in LixMoS2) is clearly demonstrated in Fig. 12c. These results show that there are obvious effects of the current density on the size and purity of the 1T MoS2 QDs (Figs. 12d and e). XPS study of the 1T-MoS2 fraction and the bonding states of the elements for the exfoliated nano sheets in different discharge current density shows that the fraction of 1T-MoS2 QDs ascends with the decreasing of current density. This controllable synthesis method as an advantage over the previous chemical synthesis method [28, 87] and uncontrolled electrochemical methods [88].
Figure 12
Figure 12.
Structural fragmentation of MoS2 induced by electrochemical litigation. (a) Discharge curve and reaction paths during the electrochemical Li intercalation. (b) Potential range of three redox couples involved in the chemical and electrochemical Li intercalation of MoS2. (c) x values in electrochemically intercalated LixMoS2 compounds and discharge curves (in dashed blue) and the mean lateral size (in solid red) of exfoliated 2D MoS2 sheets under different discharge current densities. (d, e) Schematic of electrochemical exfoliation process under different current density. Reprinted with permission [86]. Copyright2018, American Chemical Society.
The performance of lithium-ion batteries (LIBs) at low temperature (LT) is seriously weakened, which hampers the application in electric vehicles and intelligent electronic products, especially in cold areas [89-92]. Liu et al. report a novel MoS2/C mixed electrode with enlarged interlayer spacing, which has excellent performances under LT condition [93]. This material delivers a stable discharge capacity ~854.3 mAh/g (72.8% of room temperature) at −20 ℃. Under LT (−20 ℃), a multistep litigation reaction process (from outside domains to inside domains) is found while two-step litigation reaction (insertion first and then conversion) happen at room temperature (RT). In their opinion, the increase of MoS2 layer spacing due to the gradual intercalation reaction happening at LT contributes to the rapid diffusion of Li+, which enhances the performance of anode material at LT. Herein, a puzzle comes, that is, after several cycles, layered MoS2 is conversed into small particles including metallic Mo and Li2S during deep discharging process. Accordingly, whether the reason of the good performance after many cycles is still ascribed to the expanded interlayered spacing? We sincerely hope this confusion can be explained more lucidly.
5.2
Internal factors
Internal factors of materials conspicuously influence the anode reaction process. For instance, the size of MoS2-nanosheets is closely related to the rate of Li+ intercalation reaction. More importantly, controlling internal properties of anode materials is one of the most effective ways to conduct the direction of various anode reactions of different materials. Here, we summarize some internal factors which remarkably influence the cycling performance of sorts of MoS2-based anode materials, which may contribute to the design and synthesis of anode materials.
5.2.1
Initial crystal phase and interlayer spacing
Crystal phase engineering is generally reckoned as a promising method to further enhance the performance of MoS2 anode. There are totally two reasons; one is the enhanced conductivity of MoS2 nano sheets, which contributes to the rate performance and the reversibility of conversion reaction. As the most ordinary one, 2H-MoS2 is the common crystal phase of initial MoS2. 1T-MoS2 or 1T'-MoS2 (distorted 1T phase) can be synthesized by crystal phase conversion from the 2H-MoS2 through lithium-ion intercalation. The band structures of three typical crystal phases are shown in Fig. 1b. 2H-MoS2 is semiconducting, which leads to a low electron conducting, rate, resulting in irreversible conversion reactions. Additionally, 1T-MoS2 (or 1T'-MoS2) is metallic phase with a high electron migration rate and is 107 times more conductive than that of semiconducting 2H phase, which contributes to promotion of rate performance [28]. The performance of 2H-MoS2 and 1T-MoS2 in anode reaction is shown in Figs. 13a and b. The analysis of resistance of 1T-MoS2/CFC and 2H-MoS2/CFC is shown in Figs. 13c and d. The intercept of the semicircle at the imaginary axis reflects the resistance of electrolyte diffusion (Re) and its diameter corresponds to the charge-transfer resistance (Rct) within the MoS2 arrays.
Figure 13
Figure 13.
(a) Galvanostatic charge-discharge curves of the 1T-MoS2/CFC and 2H-MoS2/CFC at current density of 0.1 A/g. (b) Rate capabilities of 1T-MoS2/CFC and 2H-MoS2/CFC at the current densities ranging from 0.1 A/g to 2 A/g. (c) Nyquist plots of 1T-MoS2/CFC and 2H-MoS2/CFC. (d) Equivalent circuit model to fit the Nyquist plots and values of Re and Rct obtained by fitting data. Reprinted with permission [94]. Copyright 2017, The Royal Society of Chemistry. (e) Schematic diagram of the electrochemical process of the 1T-MoS2/C hybrid and 2H-MoS2 materials. Reprinted with permission [95]. Copyright 2019, Wiley-VCH.
It is obviously that the conductivity of 1T-MoS2/CFC is higher than 2H-MoS2/CFC. Therefore, it is most important to improve the conductivity of MoS2. The MoS2 nano sheets with a high concentration of 1T-MoS2 can deliver ultrahigh specific volumetric capacitances in a variety of aqueous electrolytes without inducing any binding or conductive agents [94].
The initial interlayer spacing has a great influence on the rate of lithium-ion transport. The diversity between 2H-MoS2 and 1T-MoS2 during the electrochemical process is shown in Fig. 13e [95]. Expanded interlayer spacing of 1T-MoS2 facilitates the intercalation of Li+, which provides sufficient active edge sites for Li+ to absorb without causing a significant volume expansion simultaneously [94, 96, 97]. This property enables 1T-MoS2 a better rate performance.
5.2.2
Layers and size
Different initial MoS2 electrodes have different physicochemical properties. For instance, the number of layers of initial MoS2 significantly affects the electrical conductivity of materials and ion transfer kinetics, which leads to the diversity of the reactions for pristine MoS2. For initial MoS2, there are two typical morphologies which are MoS2 nano sheets and bulk MoS2. Comparing to bulk MoS2, MoS2 nano sheets have a shorter diffusion distance for lithium ions and higher concentrations of edge active sites, which ensures the rapid ion migration and ultra-high ion capacity, and thus contributes to a tremendous capacity and rate performance [98]. The calculated values for the band-gap of 2H-MoS2 (from bulk to Monolayer) are shown in Fig. 1c. As the images displays, monolayer 2H-MoS2 has the widest band gap, resulting in a low conductivity.
The characteristics of electrode materials are closely related to the number of layers and size of nano flakes. It is generally acknowledged that few-layered and ultra-small MoS2 nano sheets possess much more edge sites, which results in a stronger binding interaction. Single-layer MoS2 has attracted great interest for its unique properties compared to bulk material [31, 99]. Wu et al. find that the thinner region of MoS2 flake might recover its original structure after litigation while the thicker region experienced some irreversible structural changes due to the larger accumulated strain, which may be responsible for the rapid capacity decay of the MoS2 electrode during initial cycles [100].
Yu et al. uncover different Li storage mechanisms between monolayer-MoS2 and bilayer-MoS2 [50]. Fig. 7b clearly shows the coexistence of multiple crystal phases in the bilayer-MoS2. In Yu's report, the Cryo-EM characterization of bilayer-MoS2 and monolayer-MoS2 has been operated. The crystal phase transition in bilayer-MoS2 is observed, but there is no obvious transition phenomenon in monolayer-MoS2. In fact, this phenomenon reflects the different lithium storage mechanisms of single-layer and double-layer. There is no crystal phase transition in single-layer MoS2, because no intercalation reaction happens in single-layer MoS2 as what we have discussed above. Different from the results of monolayer-MoS2, T' phases (with high structure order) are frequently observed between unreacted and fully litigated (conversion reaction occurred) regions in bilayer-MoS2. Former research has shown that the stability of different MoS2 crystal phases is closely related to the concentration of adsorbed Li+ on monolayer-MoS2 [45]. It is generally acknowledged that monolayer-MoS2 is completely exposed to the electrolyte, which enables the electrode to absorb a large number of Li-ions in a short period of time. Accordingly, the conversion reaction may occur rapidly enough to bypass the intermediate T' phase, which is the reason why no T' phase is discovered [50].
The particle size and morphology are shown to have a significant influence on the electrochemical properties of MoS2 [10, 101, 102]. Zhu et al. report that ultra-small single-layer MoS2 has a better performance than bulk material which is mainly attributed to that the single-layered nature allows interfacial lithium storage and minimizes the ion transport distance in the sulfide [18]. Accordingly, the single-layered ultra small nano-plates of MoS2 embedded in thin carbon nanowires yields a capacity of 661 mAh/g even after 1000 cycles at a high current density of 10 A/g [18].
5.2.3
S vacancy
Edge and surface modification is an effective way to promote the interface chemistry properties of MoS2 and improve the cyclic performance of MoS2-based LIBs. Fan et al. synthesize mono-layered molybdenum sulfide nano-crystals (Mo–S NCs) with controlled S-vacancies for high-performing LIBs and the atomic model of MoS2 with S vacancy is shown in Fig. 14a [103]. During the cycle process, the electrode undergoes a crystal phase transform from 1H to 1T, which improve the conductivity of the anode material (Figs. 14b and c). The electrochemical test demonstrates that the MoS1.5/rGO has the best cycle performance and stability (Fig. 14d). Besides, there is no obvious oxidation peak around 2.3 V which indicates no S element is oxidized contributing to the reversibility of the anode material (Fig. 14e). The smooth curves in Fig. 14f also demonstrate the cycle stability of MoS1.5/rGO. The decreasing ion diffusion barrier upon S depletion and crystal phase change lead to the improving of capacity. However, the structure deformation after hundreds of cycles results in rapid capacity decay. Thus, it is of vital importance to come up with methods of forestalling the structure collapse to stable the cycling capacity. Together with high-active S22- generated by "rich-sulfur" structure that we have discussed above, defect engineering is a promising way to design new-type anode materials with high performance.
Figure 14
Figure 14.
(a) Geometries of 1H–MoS2, 1H–MoS1.8, 1H–MoS1.5 and 1T-MoS1.5. (b) HRTEM images of the fresh MoS1.5/rGO-I electrode showing 1H structure of the NCs. (c) HRTEM images of the MoS1.5/rGO-I electrode after 640 cyclic tests at 1 A/g. (d) Rate performance of MoS1.5/rGO-I, MoS1.8/rGO, MoS2.0/rGO and rGO. (e) CV curves of the MoS1.5/rGO-I at first 3 cycles (scan rate: 0.1 mV/s). (f) The cycle profiles of the MoS1.5/rGO-I at different cycles with current density of 0.1 A/g. Reprinted with permission [103]. Copyright 2020, Elsevier.
Basically, the highly reversible conversion reaction usually takes place in composite materials. Accordingly, to further promote the capacity and the performance of anode materials, it is an efficient method by growing the MoS2 with poor conductivity on carbonaceous supports to improve the electron and ion transport. Till now, a series of electrode with different morphologies are prepared, such as MoS2 nanosheets coated by carbon nanotubes [104, 105], graphene [2, 29, 106-110], granular and spherical morphology of carbon material [111-115].
Chen et al. design hierarchical MoS2 tubular structures internally wired by carbon nanotubes (CNTs) [46]. The protective CoSx layer introduced onto the surface of polymeric fibers serves as a sacrificial component to produce pores on the wall of MoS2 nanotubes in the final products, which contributes to the diffusion of Li-ion. It is noteworthy that the structure of the anode displays an excellent stability (Figs. 15a and b). Benefit from the unique tubular structural and compositional features, the 1D CNT/MoS2 nano-hybrids provide an ultra-high specific capacity of ~1320 mAh/g at a current density of 0.1 A/g, exceptional rate capability and an ultra-long cycle life of up to 1000 cycles. The cycle performance is shown in Fig. 15c.
Figure 15
Figure 15.
(a) TEM and (b) FESEM images of the CNT/MoS2 structure after cycling for 200 cycles. (c) Cycling performance at 0.5 A/g and rate capability test (inset) for CNT/MoS2. Reprinted with permission [41]. Copyright 2016, American Association for the Advancement of Science. (d) TEM images indicating multilayer nanostructures of 1T-MoS2/graphene. (e) Rate performance of 1T-MoS2/graphene under a current density from 100 mA/g to 10, 000 mA/g. Reprinted with permission [29]. Copyright 2019, Elsevier. (f, g) C@MoS2 nano-boxes after annealing in H2 at 700 ℃ for 2 h. (h) Rate performance at various current rates. Reprinted with permission [117]. Copyright 2015, Wiley-VCH.
Graphene, an amazing 2D conductor, plays an increasingly important role in the restriction of active electrode materials and effectively alleviates the agglomeration of nano-materials. We have synthesized a super-stable nano-reactor in our former research which confines the cracks of the anode materials, leading to a fantastic cycle stability shown in Fig. 15e. Additionally, the TEM images of the system are displayed in Fig. 15d and we find the scale of the reactor is just around 20 nm and the surface area is extraordinary-large, indicating a rapid Li+ diffusion, which results in a fascinating rate performance. The 1T-MoS2/graphene electrode material shows tremendous cycle stability. Instead of capacity decay happening in traditional pristine MoS2, the capacity is gradually rising during the 800 cycles (Fig. 15e). Volume expansion is a key issue which impedes the commercial application of MoS2 based anode materials in LIBs [116]. Hollow structures like 3D-nanoboxes and 1D-nanotubes have the advantages over traditional powder structure because the inner hollow space can alleviate mechanical strain and volume change during cycling. Yu et al. synthesise a unique hybrid hollow structure by growing ultrathin MoS2 nano sheets on N-doped carbon shells [117]. N-dropping method can significantly enhance the conductivity of anode materials [118]. The N-doped carbon shells improve the conductivity of the hybrid structure and effectively prevent the aggregation of MoS2 nano sheets. The ultrathin MoS2 nano sheets can provide more active sites for electrochemical reactions. The hollow structure of the anode can be characterized by TEM (Figs. 15f and g). The 3D-nanoboxes effectively solve the volume expansion, leading to brilliant cycle stability. These C@MoS2 nano-boxes show high specific capacity of around 1000 mAh/g, excellent cycling stability up to 200 cycles and superior rate performance (Fig. 15h).
Aside from the cooperation of carbon material and MoS2, micro strain action is another crucial phenomenon that cannot be neglected. Many researchers have come up with varieties of methods to improve the performance or fully utilize the features of MoS2 since the pure MoS2 electrodes have many disadvantages especially the poor cycle stability. One of the most effective methods is structure modulation because the main challenges associated with MoS2 anodes are the structural pulverization and the low rate performance caused by the low electric conductivity and large strain on cycling [18]. Recently, strain-engineering 2D TMDC materials have been verified to strongly modulate the band gap and band structure, which enriches modified electrical and optical properties of 2D electronic material [119-121].
Recent report finds that mechanical strain can impact strained interfaces in 2D materials on electrochemical and energy storage processes in composite materials (Fig. 16) [122]. Oakes et al. identify that the strain engineering of interfaces is able to control the energetic pathway for the chemical conversion of MoS2 using optical and electrochemical characterization. The interface strain induced by lattice mismatch in a carbon-MoS2 solid–solid interface leads to an average ~0.1% compressive strain which enables the control of voltage of conversion reaction. Normally, the conversion reaction of pristine 2H-MoS2 nano sheets cannot occur at 1.1 V (Figs. 16a and b). However, under the action of interface strain, the electrochemical reaction process changes apparently. Vertically stacked C-MoS2 nano sheets undergo a chemical reaction at ~2.3 V which avoids a "two-step" chemical process (Figs. 16c and d). Ex situ Raman analysis indicates that vertically stacked C-MoS2 nano sheets has experienced a complete conversion above 1.75 V and produced active metallic Mo and Li2Sn which usually completes at 0.01 V (Figs. 16e and f).
Figure 16
Figure 16.
(a) CV and (b) normalized differential capacity measurements for MoS2 under lithium insertion and extraction. (c) CV and (d) normalized differential capacity plots for vertically stacked C-MoS2 nano sheets, with an arrow indicating the electrochemical signature of direct chemical conversion. (e) Scheme showing the different chemical states between interface-strained MoS2 nano sheets and pristine MoS2 nano sheets after Li insertion. Ex situ Raman spectroscopy for both materials at (f) open-circuit voltage (OCV), (g) 1.75 V and (h) 0.01 V versus Li/Li+. Reprinted with permission [122]. Copyright 2016, Springer.
Till now, some methods have been used to modify the anode materials, such as material composite, increasing the effective contact area between anode materials and electrolyte and enhancing the conductivity of anode materials. These novel modification methods can effectively improve the electrochemical performance of the materials. Although a variety of high-energy density anode materials emerge in endlessly, the problem of capacity decay still remains unsolved. Some anode materials with ultra-high capacity at first show conspicuous capacity decay after hundreds of cycles, which may be ascribed to collapse of structure. Besides, SEI films are recognized as the most crucial yet least well-understood phenomenon in batteries [123, 124]. The instability of SEI films during cycling is detrimental to the cycle stability and capacity. These two problems must be solved in order to realize the large-scale commercialization of MoS2-based LIBs.
6.1
Stabling SEI film growth
During charging and discharging process, electrochemical reduction of the electrolyte occurs and produces a SEI layer around the surface of anode material for the working potentials of anode materials are below the reduction potential of organic carbonates (around ~1 V) [125]. Nonetheless, the mechanism of the growth of SEI film is still lack of systematical comprehension due to its complex electrode interface reaction. Researchers have dedicated to exploring the growth mechanism as well as composition features of SEI films [126, 127]. The accumulation of unstable SEI films during charge–discharge cycles is one of the reasons that decreases the cycle capacity, cyclic stability and rate capability [128, 129]. The performance of SEI film has a direct impact on the cycle performance, service life, self-discharge and safety of batteries. Thus, it is of vital importance to discuss the SEI layer formation mechanism, which is instrumental in applications. A stable SEI layer allows for high Columbic efficiency and the long-term stability of anodes material. Nevertheless, due to the large volume changes during litigation and de litigation process [130], it is a big challenge to maintain the SEI stable.
To overcome this shortcoming, many effective methods have been demonstrated, which can be divided into 3 branches: (1) Reduce surface area by coating layer on secondary particles or controlling the wetting behavior of the electrolyte [131-134]; (2) Use artificial induction to stabilize SEI formation by in situ pre-litigating anode material [135] or adding electrolyte additive [51, 136, 137]; (3) Synthesize artificial SEI film by ex situ methods [138, 139]. These methods of making the SEI membrane form under the restriction of artificial conditions can effectively prevent the side reactions between the solvent and the active material, and hinder the co-embedding of the solvent molecules.
Here, we conclude some properties of these different methods. Reducing surface area by coating layer on anode material is also helpful for addressing the problem of volume expansion. Because of the redundant space inside the coating space, the material would be prevented from crushing in a certain extend due to volume expansion during the charging and discharging process, which maintains good cycle stability and reversible capacity. However, the rate of intercalation or conversion of alkali metals may be affected, resulting in the loss of rate performance [131].
Using in situ artificial induction to stabilize SEI formation has an advantage that the stable SEI film can be formed by in situ electrochemical method, which simplifies the preparation process of electrode materials and ensures the stability and self-synthesis of SEI film at real-time in the cycle process, improving the cycle stability of the whole battery system.
Synthesizing artificial SEI film by ex situ methods makes the artificial SEI film closely connect with the active substances with strong mechanical strength but flexible enough to accommodate volume change, which has good strain resistance to avoid complex morphology changes during cycling.
No matter which method is used, the following requirements should be satisfied. The SEI film must be ionic conductive and is the able to isolate electrolyte, making the electrochemical reaction to continue without redox of electrolyte on the surface of SEI film.
Interfacial processes of SEI film formation and litigation/de litigation on ultra-flat monolayer MoS2 can be monitored by in situ AFM [51]. The growth process of SEI films on the surface of MoS2 in electrolyte with additive has been clearly clarified (Fig. 17a). A brush-shaped film is initially generated on the MoS2 surface, and then this growth develops into an intensive and uniform film covering the majority of the electrode with an average thickness measured as approximately 0.6 nm. Cycle stability test demonstrates that fluoro-ethylene carbonate (FEC) additive plays a crucial role in optimizing the stability of electrode/electrolyte interfaces and further improving the reversibility and capacity of batteries during cycles [51]. This research provides a method for studying wrinkle process of the anode surface and the characterization of formation process of the complex SEI film by using in situ AFM.
Figure 17
Figure 17.
(a) Schematic illustration of the structural evolution and reaction mechanism of the monolayer MoS2 electrode. Reprinted with permission [51]. Copyright 2019, Springer. (b-e) SEI formation on the left side Ti electrode. Time series of TEM images showing the growth of SEI film on MoS2 nano sheets and at the edge of the Ti electrode. (f) The corresponding applied electric potential and measured electric current from panel (b-e). (g) Change in area of SEI layer. Reprinted with permission [85]. Copyright 2015, American Chemical Society.
As an in situ high spatial resolution characterization method, in situ TEM has enabled imaging of chemical reactions in liquids [140-142], which makes it possible for the studies related to electrode-electrolyte interfaces in LIBs [143, 144]. The dynamic evolution of SEI film on the electrode surface of Li-ion liquid battery can be observed in real time from atom scale by sensitive TEM.
In Zeng's work, TEM images captured in chronological order show the surface morphology evolution of SEI films (Figs. 17b-e) [85]. The formation of SEI film on the Ti anode and MoS2 nano sheets in contact with Li metal is detected real time during cycle process. The voltammetry relation and quantitative analysis of area of interface are shown in Figs. 17f and g, respectively. The discussion of the dynamic SEI film formation process provides insights on the understanding of surface changes of MoS2-based anode. Apart from that, the applied electrical potential and measured electrical current during the charging/discharging process provide a fascinating inspiration that the SEI formation process can be studied with the supporting of the relationship between current and voltage, which contributes to the former research for controlling the electrochemical parameters (current and voltage) to realize controllable SEI synthesis.
6.2
Avoiding pulverization and collapse
For some conversion-type anode materials like MoS2, the electrode structures can easily pulverize and collapse because the conversion reaction leads to the phase transformation (from 2D crystal to amorphous system). As discussed above, 2D layered structure MoS2 has a higher Li+ transition rate than bulk MoS2. The pulverized anode materials are easy to agglomerate, which results in a relative low surface area comparing to stable 2D or 3D structure. Surface area is closely related to the utilization rate of active substances. For example, the Mo nanoparticles formed after discharging is hard to completely convert to MoS2. Thus, inhibiting the pulverization of electrode materials is an effective way to promote the cycle stability of MoS2-based anode materials. Some reports have demonstrated that composite with stable carbon materials can effectively avoid the agglomeration of active species after deep discharging process [29, 145, 146]. Besides, core-shell structure [147] and nanotube structure [148] are feasible ways to improve the structure stability of nanomaterials. These anode materials keep a fantastic stability in experiment. Thus, it is feasible to design collapse-against anode structure to solve this problem.
7.
Conclusion and future opportunities
As a promising LIB electrode material, MoS2 is demonstrated to have significant advantages in various rechargeable battery systems. MoS2 anode with a high capacity makes it a promising alternative to replace commercialized graphite anode. Nevertheless, pristine MoS2 electrodes still suffer from some shortcomings, such as low electric conductivity and volume expansion during Li+ insertion/extraction. To further address these issues, it is necessary to have a comprehensive understanding about the Li+ storage mechanisms of MoS2. In this review, we check different reaction mechanisms of MoS2-based anodes. In particular, we discussed several phenomena under intensive debates such as the extra capacity over theoretical values and summarized the factors influencing energy storage mechanism, which makes a big difference to the design of MoS2-based LIBs. Meanwhile, we enumerate several in situ characterization methods which have been successfully employed to explain some electrochemical behaviors of MoS2 electrodes in LIBs. The schematic of relationships between mechanisms, mechanism-influencing factors, materials design and practical applications is shown in Fig. 18.
Figure 18
Figure 18.
Schematic of relationships between mechanisms, mechanism-influencing factors, materials design and practical applications.
Future works on understanding reaction mechanism of different MoS2-based anode materials and their physicochemical behaviors in the battery system are needed because there are still some problems around:
First, the metallic Mo for mingat the end of discharging process has been confirmed on the ability for lithium storage, which is closely related to the scale of metallic Mo and is reckoned as the reason of extra capacity over the theoretical values. The factors influencing real morphology of metallic Mo are so complex to identify that more researches are needed to analyze the formation condition of different scales and their Li+ storage ability in order to optimize the performance of anode materials.
Second, the lithium storage mechanisms can be influenced by many factors, in which the dominant ones are the number of layers, the primary crystalline phase of the material and synergy with other materials (e.g., graphene). The reversibility of MoS2 can be greatly improved by compositing with carbon materials. It is the most important to detect the rules of important phenomena, summarize the general methods and design electrode materials with different mechanisms according to different needs.
Third, the growth mechanism of the SEI film is quite different from their kinds of electrolyte and basal. The general SEI film will lead to a significant capacity decrease in the first cycle. Till now, the methods to solve the problem of growth of unstable SEI film can be divided into 3 branches: (1) Reduce surface area; (2) Use artificial induction to stabilize SEI formation; (3) Synthesize artificial SEI film. Further studies around SEI film can start from the above three points. Besides, in situ techniques have congenital advantages in characterizing the process of SEI film formation, which contributes to the understanding of mechanical properties and physicochemical properties of SEI film.
With the rapid development of high-performance computer technology, first principles calculation has gradually become an important tool for electrode material design. Under the guidance of theoretical calculation, the design and preparation of new energy materials and the construction of new energy storage system can be carried out to provide solutions for improving the energy density, power density and safety performance of energy storage devices.
Structure collapse of electrode materials is one of the most important issues that is needed to be solved because the cycle performance after hundreds of cycles is far from satisfaction for the collapse and pulverization of the electrode. Thus, designing electrode structure with resistance to strain and volume expansion is an effective method for enhancing the cycle stability of MoS2 based anode materials.
Some novel modification ideas can effectively improve the electrochemical performance of the materials, but there is still a certain gap between the investigation and commercial application because the structure collapse during cycles results in conspicuous capacity decay, which hinders it practical applications. Unless a modified anode material with ultra-high cycle capacity stability is developed, graphite will still be the main anode material of lithium-ion batteries for a period in the near future. Besides, with the development of flexible electronic technology, next generation lithium batteries will be flexible and light-weight, which puts forward higher requirements for the structural stability and energy density of MoS2-based electrode. Further studies can be carried out around above directions.
Declaration of competing interest
The authors declare that they have no known competing financial interests or personal relationships that could have appeared to influence the work reported in this paper.
Acknowledgments
This work was financially supported by the National Funds for Distinguished Young Scientists (No. 61825503), the National Natural Science Foundation of China (Nos. 51902101, 61775101, 61804082), the Youth Natural Science Foundation of Hunan Province (No. 2019JJ50044), Natural Science Foundation of Jiangsu Province (No. BK20201381), Science Foundation of Nanjing University of Posts and Telecommunications (No. NY219144), China Postdoctoral Science Foundation (Nos. 2020TQ0202, 2021M692161).
[1]
Y. Fang, Y.Y. Lv, F. Gong, et al., Adv. Mater. 28 (2016) 9385–9390 doi: 10.1002/adma.201602210
[2]
D.B. Kong, H.Y. He, Q. Song, et al., Energy Environ. Sci. 7 (2014) 3320–3325 doi: 10.1039/C4EE02211D
[3]
J.B. Goodenough, K. Park, J. Am. Chem. Soc. 135 (2013) 1167–1176 doi: 10.1021/ja3091438
M. Ge, C. Cao, J. Huang, et al., J. Mater. Chem. A 4 (2016) 6772 doi: 10.1039/C5TA09323F
Figure 1
(a) Structural unit and geometrical structure of H-MoS2, T-MoS2 and T'-MoS2 and (b) corresponding band structure respectively. Reprinted with permission [31]. Copyright 2014, American Chemical Society. (c) Evolution of the band structure of 2H-MoS2 calculated for samples of decreasing thickness. Reprinted with permission [32]. Copyright 2010, American Chemical Society.
Figure 2In situ techniques commonly applied in characterization of MoS2-based anode materials. Characterization of electrode materials includes diversified perspectives in the morphology, crystal phase, lattice, interface and composition of diverse anode materials. A picture of the characterization index can be obtained in real operando conditions by implementing these advanced facilities (In situ XAS. Reprinted with permission [24]. Copyright 2018, American Chemical Society. In situ XRD. Reprinted with permission [23]. Copyright 2012, Elsevier. In situ Raman. Reprinted with permission [25]. Copyright 2019, Wiley-VCH. In situ X-ray photoelectron spectroscopy (XPS). Reprinted with permission [49]. Copyright 2017, American Chemical Society. Cryo-electron microscopy (Cryo-EM). Reprinted with permission [50]. Copyright 2019, Wiley-VCH. In situ transmission electron microscopy (TEM). Reprinted with permission [22]. Copyright 2014, American Chemical Society. In situ atomic force microscopy (AFM). Reprinted with permission [51]. Copyright 2019, Springer. In situ optical microscopy (OM). Reprinted with permission [52]. Copyright 2018, Springer.)
Figure 5
(a) Galvan static discharge curve representing the litigation process. Reprinted with permission [14]. Copyright 2013, National Academy of Sciences. (b) Schematic representation of alkali–ion intercalation through a single MoS2 layer. (c) Li+, Na+ and K+ intercalation into MoS2 through top and edge channels. Reprinted with permission [52]. Copyright 2018, Springer. (d) Enlarged XRD patterns of the fully charged MoS2 electrodes after cycling in different voltages for one cycle. (e-h) Corresponding TEM images with contrast profiles along the arrow-direction indicating average interlayer distance. (i) Scheme for the structural changes and lithium storage performance of MoS2 cycled in different voltage windows. Reprinted with permission [62]. Copyright 2019, Wiley-VCH.
Figure 7
(a) Annular dark-field Cryo-STEM image of partially litigated bilayer-MoS2.
(b) FFT patterns of selected regions in (a). (c) Annular dark-field Cryo-STEM image of partially litigated monolayer-MoS2. (d) Schematic illustration of the conversion reaction in monolayer-MoS2. Reprinted with permission [50]. Copyright 2019, Wiley-VCH.
Figure 8
(a) Bulk MoS2 and (b) Mo63 cluster from DFT calculations. (c) Comparison of the absorption energy and Li–S distance of Li2S absorbed on bulk Mo and Mo63 cluster. Reprinted with permission [25]. Copyright 2019, Wiley-VCH. (d) The HRTEM images of the 1T-MoS2/graphene electrode after 100th, 300th, 500th discharge cycles. (e) CVs of the 2H-MoS2 nanosheets electrode during the initial three cycles for LIBs and CVs of the 1T-MoS2/graphene electrode during the initial three cycles and after 800th cycle for LIBs. (f) Cycle behaviors of 1T-MoS2/graphene electrode at 1000 mA/g for LIBs. Reprinted with permission [29]. Copyright 2018, Elsevier.
Figure 9
(a) The first five CVs of the CNFs@MoS2 anode. (b, c) Mass spectra of the sample before (b) and after (c) the initial charge process (CNFs@MoS2). Reprinted with permission [67]. Copyright 2014, Wiley-VCH. (d) Schematic illustration of the mechanisms during redox reaction for NC-S and (e) NC/MoS3-S NBs-based batteries. Reprinted with permission [68]. Copyright 2020, Wiley-VCH.
Figure 10
(a) Cyclic voltammograms of the MoS2 electrode with a discharge cutoff voltage of 0.05 V. (b) In situ and operando S K-edge XAS spectra at different discharge and charge stages. (c) The proposed electrochemical reaction mechanism of the MoS2 electrode. Reprinted with permission [24]. Copyright 2018, American Chemical Society. CV curves of (d) MoSx-rGO and (e) MoS2-rGO. Reprinted with permission [74]. Copyright 2020, Elsevier. (f) CV measurements of the metallic MoS2 nanotube. Reprinted with permission [76]. Copyright 2018, Wiley-VCH.
Figure 12
Structural fragmentation of MoS2 induced by electrochemical litigation. (a) Discharge curve and reaction paths during the electrochemical Li intercalation. (b) Potential range of three redox couples involved in the chemical and electrochemical Li intercalation of MoS2. (c) x values in electrochemically intercalated LixMoS2 compounds and discharge curves (in dashed blue) and the mean lateral size (in solid red) of exfoliated 2D MoS2 sheets under different discharge current densities. (d, e) Schematic of electrochemical exfoliation process under different current density. Reprinted with permission [86]. Copyright2018, American Chemical Society.
Figure 13
(a) Galvanostatic charge-discharge curves of the 1T-MoS2/CFC and 2H-MoS2/CFC at current density of 0.1 A/g. (b) Rate capabilities of 1T-MoS2/CFC and 2H-MoS2/CFC at the current densities ranging from 0.1 A/g to 2 A/g. (c) Nyquist plots of 1T-MoS2/CFC and 2H-MoS2/CFC. (d) Equivalent circuit model to fit the Nyquist plots and values of Re and Rct obtained by fitting data. Reprinted with permission [94]. Copyright 2017, The Royal Society of Chemistry. (e) Schematic diagram of the electrochemical process of the 1T-MoS2/C hybrid and 2H-MoS2 materials. Reprinted with permission [95]. Copyright 2019, Wiley-VCH.
Figure 14
(a) Geometries of 1H–MoS2, 1H–MoS1.8, 1H–MoS1.5 and 1T-MoS1.5. (b) HRTEM images of the fresh MoS1.5/rGO-I electrode showing 1H structure of the NCs. (c) HRTEM images of the MoS1.5/rGO-I electrode after 640 cyclic tests at 1 A/g. (d) Rate performance of MoS1.5/rGO-I, MoS1.8/rGO, MoS2.0/rGO and rGO. (e) CV curves of the MoS1.5/rGO-I at first 3 cycles (scan rate: 0.1 mV/s). (f) The cycle profiles of the MoS1.5/rGO-I at different cycles with current density of 0.1 A/g. Reprinted with permission [103]. Copyright 2020, Elsevier.
Figure 15
(a) TEM and (b) FESEM images of the CNT/MoS2 structure after cycling for 200 cycles. (c) Cycling performance at 0.5 A/g and rate capability test (inset) for CNT/MoS2. Reprinted with permission [41]. Copyright 2016, American Association for the Advancement of Science. (d) TEM images indicating multilayer nanostructures of 1T-MoS2/graphene. (e) Rate performance of 1T-MoS2/graphene under a current density from 100 mA/g to 10, 000 mA/g. Reprinted with permission [29]. Copyright 2019, Elsevier. (f, g) C@MoS2 nano-boxes after annealing in H2 at 700 ℃ for 2 h. (h) Rate performance at various current rates. Reprinted with permission [117]. Copyright 2015, Wiley-VCH.
Figure 16
(a) CV and (b) normalized differential capacity measurements for MoS2 under lithium insertion and extraction. (c) CV and (d) normalized differential capacity plots for vertically stacked C-MoS2 nano sheets, with an arrow indicating the electrochemical signature of direct chemical conversion. (e) Scheme showing the different chemical states between interface-strained MoS2 nano sheets and pristine MoS2 nano sheets after Li insertion. Ex situ Raman spectroscopy for both materials at (f) open-circuit voltage (OCV), (g) 1.75 V and (h) 0.01 V versus Li/Li+. Reprinted with permission [122]. Copyright 2016, Springer.
Figure 17
(a) Schematic illustration of the structural evolution and reaction mechanism of the monolayer MoS2 electrode. Reprinted with permission [51]. Copyright 2019, Springer. (b-e) SEI formation on the left side Ti electrode. Time series of TEM images showing the growth of SEI film on MoS2 nano sheets and at the edge of the Ti electrode. (f) The corresponding applied electric potential and measured electric current from panel (b-e). (g) Change in area of SEI layer. Reprinted with permission [85]. Copyright 2015, American Chemical Society.

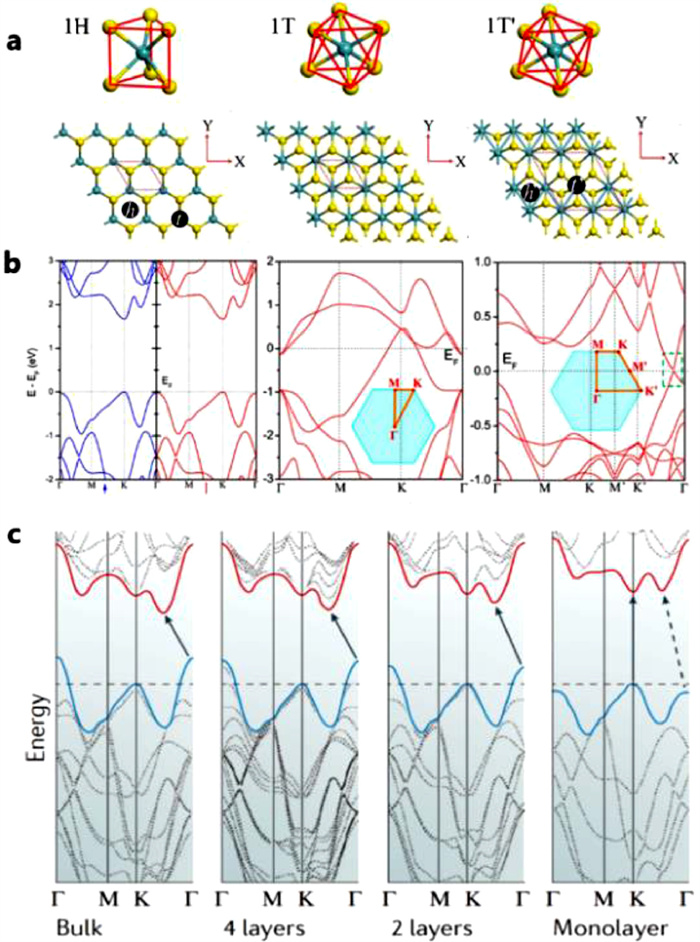
 DownLoad:


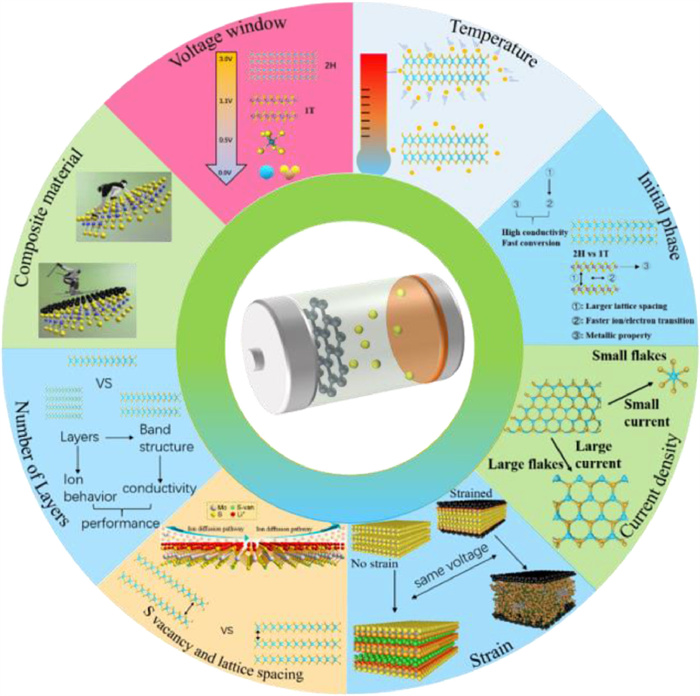
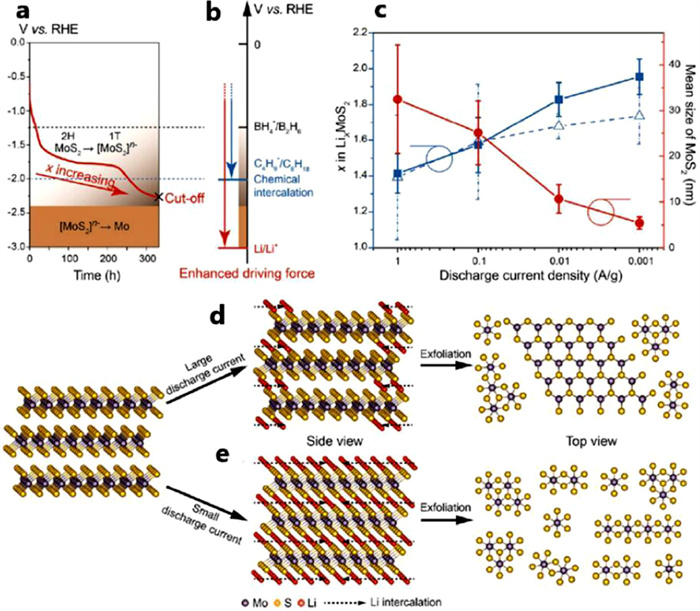


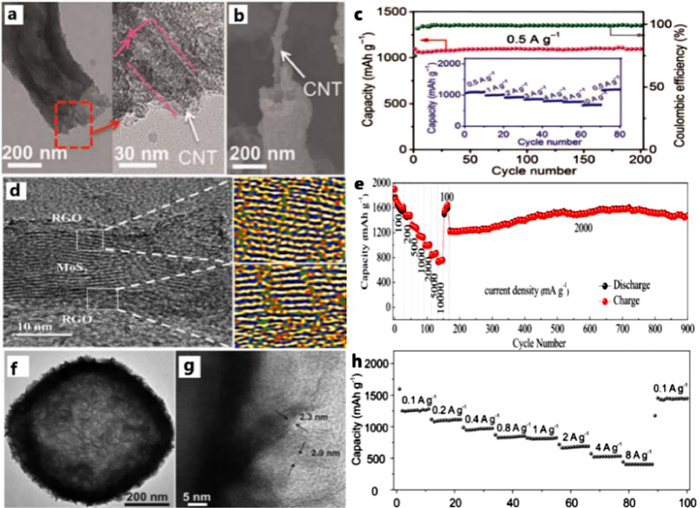
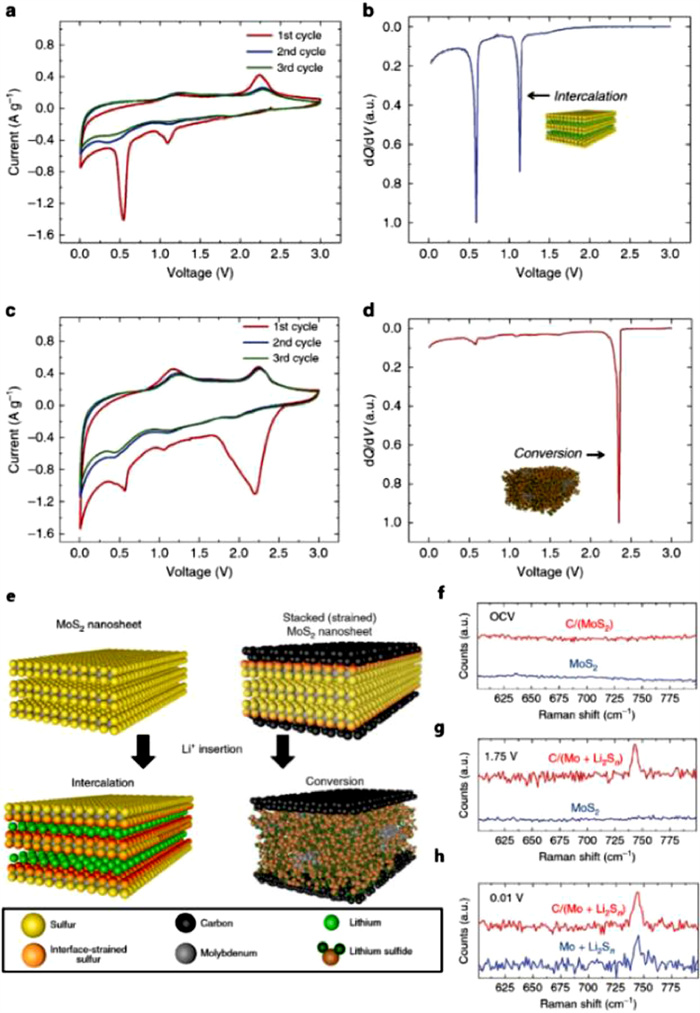

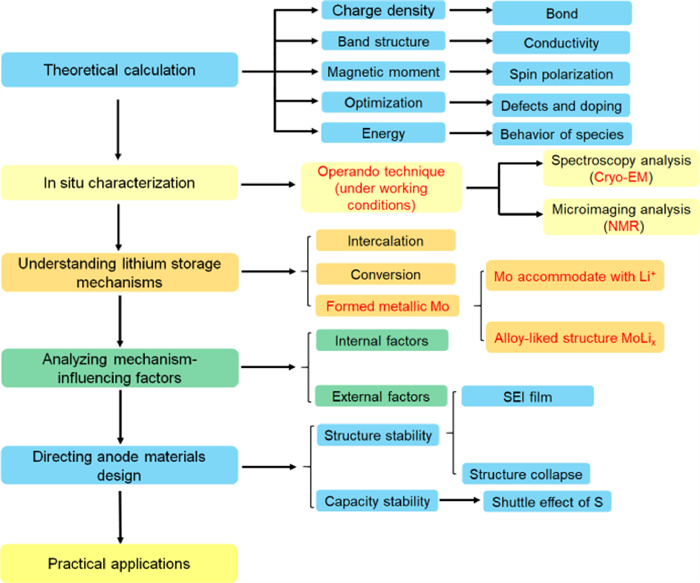

 下载:
下载:


 下载:
下载:
