Figure 1.
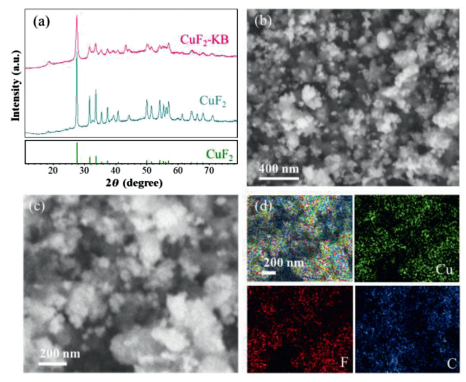
Phase, morphology and elemental distribution information of the CuF2-KB composite. (a) XRD patterns of the CuF2-KB and pristine CuF2. (b-d) SEM and corresponding EDS mapping images of the CuF2-KB composite.
Copper fluoride as a low-cost sodium-ion battery cathode with high capacity
Yiming Dai , Qiujie Chen , Chenchen Hu , Yangyang Huang , Wangyan Wu , Mingliang Yu , Dan Sun , Wei Luo

Lithium-ion batteries (LIBs) have prospered a rechargeable world with their long cycle life and high energy density [1,2]. However, with the mass adoption of electric vehicles (EVs) [3], the limited and unevenly distributed lithium resources are becoming even more scarce, which will inevitably lead to an increase in the price of lithium in the near future and restrict their application in large-scale energy storage systems [4,5]. Sodium-ion batteries (SIBs) are considered to be the most promising alternatives to LIBs due to the abundance of sodium resources (more than 400 times that of lithium), uniform distribution and low price [6]. However, the specific capacities of SIB cathode materials based on intercalation reaction are low, (e.g., the theoretical specific capacity of Na3V2(PO4)3 is only 117 mAh/g), resulting in a low energy density and hindering their applications [7–9]. Thus, developing SIB cathode materials with higher capacities is an urgent requirement.
Recently, copper-based cathodes get increasing attention because of their high specific capacities resulted from typical multi-electron reaction [10–12]. Wu et al. reported a battery with Cu2+ as the charge carrier which gives a 4-electron electrode reaction through the sequential conversion of S↔CuS↔Cu2S [10]. Among copper-based cathodes, Copper fluoride (CuF2) shows great potential as a conversion-type SIBs cathode owing to its high theoretical capacity (528 mAh/g), which is ~ 4 times that of Na3V2(PO4)3 [13–16]. To date, several groups have investigated CuF2 as a LIBs cathode, where many challenges remain [17–24]. As reported, CuF2 suffers from two typical problems of (1) poor electronic conductivity [17,24] and (2) dissolution of Cu in a wide range of organic solvents [19]. Over the years, significant efforts have been devoted to solving the first problem by compositing CuF2 particles with highly conducting materials, including carbon, MoO3 and VO2 [17,22]. On the other hand, some strategies such as coating CuF2 particles with NiO have been proposed to deal with the second problem [23], but the effect of those strategies is still limited. This poses a crucial challenge because the dissolved Cu ions can transport to the anode surface and then plate irreversibly, which results in a fast battery failure. In SIBs case, these challenges related to CuF2 cathode are also needed to be addressed.
Here, we prepared a CuF2-based cathode by mixing commercially available CuF2 with Ketjin black (KB). Such a CuF2-KB nanocomposite presents a Na-ion storage capacity of 502 mAh/g, which is close to the theoretical value of 528 mAh/g. Furthermore, the cell configuration was adjusted with a C-coated separator, which greatly improved the capacity retention. We further studied the sodiation and desodiation mechanism of CuF2 using in-situ XRD measurement and theoretical calculation, which demonstrates that CuF2 undergo a one-step conversion reaction upon discharging while the reversible conversion reaction needs to compete with the oxidization of Cu to dissolved Cu ions.
To prepare the CuF2-KB nanocomposite, CuF2 particles were mixed with KB (20 wt%) through a high-energy milling. The more detailed preparation can be found in the experimental part in Supporting information. Fig. 1a gives the X-ray diffraction (XRD) patterns of CuF2 and the CuF2-KB nanocomposite. The as-received CuF2 shows a monoclinic rutile structure (PDF #42–1244, space group P21/n(14)) as the main phase. After compositing with KB, the CuF2-KB nanocomposite shares a similar pattern with pristine CuF2, indicating that the high-energy milling process would not destroy the structure of CuF2. Additionally, broader peaks are shown on the pattern of the CuF2-KB nanocomposite, indicative of a smaller crystal size compared to the pristine CuF2 after the high-energy milling. More interestingly, KB cannot be detected from the XRD, showing its amorphous structure. The morphology of the CuF2-KB nanocomposite was characterized using scanning electron microscopy (SEM). As shown in Figs. 1b and c, the composite appears in granular form. The nanocomposite particle is of nano size, which is far smaller than the pristine CuF2 particles with diameters of tens of microns (Fig. S1 in Supporting information). Moreover, according to the energy dispersive X- ray spectroscopy (EDS) results in Fig. 1d, the distribution of elemental Cu, F and C are highly overlapped, implying the well mixture of KB and CuF2. The above observations confirm that the CuF2-KB nanocomposites with reduced particle size and well mixture of CuF2 and conductive carbon have been obtained through high-energy milling.
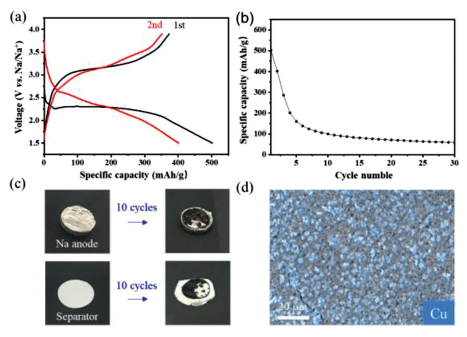
Electrochemical performance of the CuF2-KB composite was investigated using a half-cell configuration with a 1.0 mol/L NaClO4 electrolyte (in a mixture of EC: PC). The galvanostatic discharge–charge test was first performed within the voltage range from 1.5 V to 4.9 V at 0.05 C. As shown in Fig. 2a, a relatively flat plateau located around 2.27 V is observed upon the first discharge process, which corresponds to the sodiation process of CuF2. The CuF2-KB composite delivers a specific discharge capacity of 502 mAh/g, which is about 95% of the theoretical specific capacity (528 mAh/g). For comparison, the specific discharge capacity of the pristine CuF2 is only 130 mAh/g with a discharge plateau of < 2.2 V (Fig. S2 in Supporting information). The improved electrochemical performance of CuF2 results from the improved kinetics by reducing the particle size of CuF2 and compositing CuF2 with conductive KB through high-energy milling. Although the initial capacity of the CuF2-KB composite is promising, the capacity decreases rapidly in the following cycles. Specifically, the CuF2-KB composite exhibits capacities of 401 and 300 mAh/g at the 2nd and the 3rd cycle, respectively (Fig. 2b). After 30 cycles, the capacity is only 59 mAh/g. To reveal reasons for the fast capacity fading, the cycled cells were disassembled after 10 cycles for further measurements. As shown in Fig. 2c, the surface of Na metal anode shows metallic luster before cycling. However, black byproducts are observed on Na metal and separator after only 10 cycles. Then, the cycled Na metal anode was analyzed by EDS, where elemental Cu was detected (Fig. 2d). Clearly, Cu ions dissolve from the cathode side and transport in electrolyte and then plate on the anode side. Such a phenomenon is similar to the sulfur and other Cu-based electrodes, where the dissolution and transportation of active materials result in poor cycling performance [25].
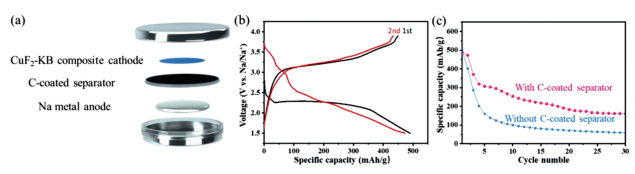
To keep the soluble species in the cathode side, cell configuration adjustments have been widely used [26]. For example, carbon interlayers are usually introduced in between sulfur cathodes and separators, which can greatly improve the cycle life of Li-S batteries [27]. Inspired by this, a carbon-coated separator was adopted in this study, as schematically shown in Fig. 3a. With such a C-coated separator, the CuF2-KB composite exhibited similar first-cycle charge-discharge curves and specific capacities (490 mAh/g, Fig. 3b). In the following cycles, clearly, the reversibility of CuF2 was enhanced with the C-coated separator. As shown in Fig. 3c, the capacity decay was 6.3% per cycle in the first 10 cycles, which is much smaller than that of a cell with a regular separator (14.8% per cycle). We also disassembled the cell after 10 cycles and characterized the Na metal anode by EDS (Fig. S3 in Supporting information). It is noticed that elemental Cu cannot be found on the surface of Na metal anode, suggesting that Cu ions could not penetrate the C-coated separator and reach the anode side.
Although the transportation of dissolved Cu ions can be maintained in cathode side, the capacity of CuF2 still decayed upon long-term cycling. It is critical to reveal the sodiation and desodiation mechanism of CuF2 as a SIB cathode. In-situ XRD measurement was first carried out. As shown in Fig. 4a, the peaks of CuF2 gradually weaken and widen when being discharging. Simultaneously, the peaks of NaF and Cu appear. To visualize the change in peak intensity of CuF2, NaF and Cu, we calculated the integrated peak intensity in the main peaks area of CuF2 (011), Cu (111), and NaF (200). It is observed that NaF and Cu gradually increased, and finally reach the maxima in the end of discharge, while the peak of CuF2 disappeared completely (Fig. 4b). Clearly, CuF2 underwent a one-step conversion reaction during discharge: CuF2 + 2Na → Cu + 2NaF. Upon charging, the phase of rutile CuF2 appears and gradually increases while the phase of rocksalt NaF and metallic Cu gradually decrease. In general, the reversible conversion reaction of CuF2 cathode for SIBs is observed. However, the intensity and width of discharged CuF2 peaks were weakened and broadened compared to their initial state, probably due to the fragmentation of the particles. This irreversible structure change may increase the contact area between active materials with electrolyte and then causing side reactions and the deterioration of cycling stability.
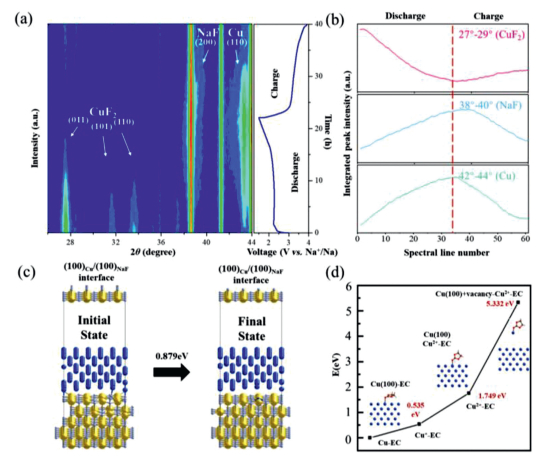
To further understand the desodiation mechanism, two competing oxidation processes of Cu were investigated using theoretical calculation based on first-principle method. The detailed calculation procedure is described in Supporting information. One pathway is that Cu atoms insert into the adjacent NaF lattice and undergo solid-solid reaction. As shown in Fig. 4c, a Cu atom separates from bulk and inserts into an adjacent sodium vacancy at the (100)Cu/(100)NaF interface. During this process, the energy difference between the final state and the initial state is 0.879 eV. The other pathway corresponds to the oxidation of Cu and forms solvated Cu2+. The corresponding energy values are illustrated in Fig. 4d. The reaction energy for Cu → Cu2+ - EC is 5.332 eV. This indicates that the solid-solid reaction of Cu and NaF is more favorable. However, it is difficult for Cu atom to insert into the deep of NaF bulk. As a result, there is a gradual tendency of Cu to the oxidation to Cu2+ ion and dissolution during charge. Moreover, with the help of solvent, the energy difference during oxidation of Cu is lower than the reaction energy of 6.601 eV for Cu → Cu2+ without solvent (Fig. S4 in Supporting information). Therefore, the electrolyte in the cathode side is beneficial to the dissolution of Cu. In this case, capacity fading would occur due to the transportation of Cu ions.
In summary, we have demonstrated CuF2 as a promising cathode for sodium batteries through a conversion reaction. The CuF2-KB nanocomposite exhibited a capacity of 502 mAh/g during the first discharge, close to its theoretical capacity. A cell configuration adjusting by the insertion of a C-coated separator hindered the irreversible plating of Cu ions on Na anode and improved the reversibility of the CuF2 cathode. The average capacity decay was 6.3% per cycle in the first 10 cycles, much smaller than a regular cell of 14.8% per cycle. During discharge, the sodiation process was a one-step conversion reaction, in which the reaction CuF2 + 2Na → Cu + 2NaF underwent directly. During charging, the desodiation process competed with the oxidization of Cu to dissolved Cu ions. We believe that the pain point of CuF2 is the irreversible plating of dissolved Cu ions on the anode surface. By hindering the plating and (or) transportation of Cu ions, CuF2 cathode with high specific capacity can be more reversible and fulfill its promise for advanced batteries of the next generation.
The authors declare that they have no known competing financial interests or personal relationships that could have appeared to influence the work reported in this paper.
The authors are grateful for the financial support by the National Natural Science Foundation of China (No. 21975186) and "Shanghai Rising-Star Program" (No. 19QA1409300).
Supplementary data associated with this article can be found, in the online version, at 10.1016/j.cclet.2021.08.050.
J.B. Goodenough, Y. Kim, Chem. Mater. 22(2010) 587-603. doi: 10.1021/cm901452z
T. Kim, W. Song, D.Y. Son, L.K. Ono, Y. Qi, J. Mater. Chem. A 7(2019) 2942-2964. doi: 10.1039/C8TA10513H
M.A. Hannan, M.S.H. Lipu, A. Hussain, A. Mohamed, Renew. Sust. Energ. Rev. 78(2017) 834-854. doi: 10.1016/j.rser.2017.05.001
A.T.D. Perera, S. Coccolo, J.L. Scartezzini, Sci. Rep. 9(2019) 17756. doi: 10.1038/s41598-019-53653-w
G. Martin, L. Rentsch, M. Höck, M. Bertau, Energy Stor. Mater. 6(2017) 171-179. doi: 10.1016/j.ensm.2016.11.004
H.S. Hirsh, Y. Li, D.H.S. Tan, et al., Adv. Energy Mater. 10(2020) 2001274. doi: 10.1002/aenm.202001274
K. Saravanan, C.W. Mason, A. Rudola, K.H. Wong, P. Balaya, Adv. Energy Mater. 3(2013) 444-450. doi: 10.1002/aenm.201200803
X. Xiang, K. Zhang, J. Chen, Adv. Mater. 27(2015) 5343-5364. doi: 10.1002/adma.201501527
T. Wang, D. Su, D. Shanmukaraj, et al., Electrochem. Energy Rev. 1(2018) 200-237. doi: 10.1007/s41918-018-0009-9
X.Y. Wu, A. Markir, L. Ma, et al., Angew. Chem. Int. Ed. 58(2019) 12640-12645. doi: 10.1002/anie.201905875
Y. Huang, W. Zhang, S. Li, et al., Nano Energy 54(2018) 59-65. doi: 10.1016/j.nanoen.2018.09.064
H.M. Wang, D.Y.W. Yu, ACS Appl. Energy Mater. 2(2019) 4936-4942. doi: 10.1021/acsaem.9b00627
J. Kim, H. Kim, K. Kang, Adv. Energy Mater. 8(2018) 1702646. doi: 10.1002/aenm.201702646
X. Hua, R. Robert, L.S. Du, et al., J. Phys. Chem. C 118(2014) 15169-15184. doi: 10.1021/jp503902z
L. Wang, Z. Wu, J. Zou, et al., Joule 3(2019) 2086-2102. doi: 10.1016/j.joule.2019.07.011
Y. Hu, Y. Lu, L. Chen, Na-Ion Batteries: Science and Technology, Science Press, Beijing, 2020.
F. Badway, A.N. Mansour, N. Pereira, et al., Chem. Mater. 19(2007) 4129-4141. doi: 10.1021/cm070421g
T. Krahl, F.M. Winkelmann, A. Martin, et al., Chem. Eur. J. 24(2018) 7177-7187. doi: 10.1002/chem.201800207
F. Omenya, N.J. Zagarella, J. Rana, et al., ACS Appl. Energy Mater. 2(2019) 5243-5253. doi: 10.1021/acsaem.9b00938
W. Tong, G.G. Amatucci, J. Power Sources 362(2017) 86-91. doi: 10.1016/j.jpowsour.2017.07.008
Y.H. Cui, M.Z. Xue, Y.N. Zhou, et al., Electrochim. Acta 56(2011) 2328-2335. doi: 10.1016/j.electacta.2010.12.014
A.N. Mansour, F. Badway, W.S. Yoon, et al., J. Solid State Chem. 183(2010) 3029-3038. doi: 10.1016/j.jssc.2010.09.029
J.K. Seo, H.M. Cho, K. Takahara, et al., Nano Res. 10(2017) 4232-4244. doi: 10.1007/s12274-016-1365-6
F. Wang, R. Robert, N.A. Chernova, et al., J. Am. Chem. Soc. 133(2011) 18828-18836. doi: 10.1021/ja206268a
Y. Zheng, P. Zhang, S.Q. Wu, et al., Solid State Commun. 152(2012) 1703-1706. doi: 10.1016/j.ssc.2012.06.018
Y.S. Su, A. Manthiram, Nat. Commun. 3(2012) 1166. doi: 10.1038/ncomms2163
S.H. Chung, L. Luo, A. Manthiram, ACS Energy Lett. 3(2018) 568-573. doi: 10.1021/acsenergylett.7b01321

Figure 1 Phase, morphology and elemental distribution information of the CuF2-KB composite. (a) XRD patterns of the CuF2-KB and pristine CuF2. (b-d) SEM and corresponding EDS mapping images of the CuF2-KB composite.

Figure 2 (a) Charge-discharge profiles of the CuF2-KB electrode at 0.05 C. (b) The cycling performance of the CuF2-KB electrode at 0.05 C. (c) Photos of the Na metal anode and separator before and after 10 cycles. (d) The EDS mapping image of the Na metal anode after 10 cycles.

Figure 3 (a) Configuration of the cell in the experiment. (b) Charge-discharge profiles of the CuF2-KB electrode in a cell with a C-coated separator at 0.05 C. (c) Cycling performance of the CuF2-KB electrode in a cell with/without a C-coated separator.

Figure 4 (a) In-situ XRD image of the CuF2-KB electrode in a cell with a C-coated separator corresponding to the first cycle. (b) The integrated peak intensity in the main peak area of CuF2 (011), Cu (111) and NaF (200) during the first cycle. (c) The initial state ((100)Cu/(100)NaF interface is short of a Na atom, forming a vacancy) and final state (the vacancy in the NaF interface is filled with a Cu atom) of a Cu atom inserting into the adjacent a sodium vacancy in the interface of Cu and NaF. (d) Energy states of Cu ions in the dissolution process.

 扫一扫看文章

扫一扫关注我们
 DownLoad:
 下载:
下载:
 下载:
下载: