Citation:
Zhuan Chen, Cheng Lian, Kai Huang, Jiahui Ji, Qingyun Yan, Jinlong Zhang, Mingyang Xing. "Small amount for multiple times" of H2O2 feeding way in MoS2-Fex heterogeneous fenton for enhancing sulfadiazine degradation[J]. Chinese Chemical Letters,
2022, 33(3): 1365-1372.
doi:
10.1016/j.cclet.2021.08.016
"Small amount for multiple times" of H2O2 feeding way in MoS2-Fex heterogeneous fenton for enhancing sulfadiazine degradation
English
"Small amount for multiple times" of H2O2 feeding way in MoS2-Fex heterogeneous fenton for enhancing sulfadiazine degradation
Key Laboratory for Advanced Materials and Joint International Research Laboratory of Precision Chemistry and Molecular Engineering, Feringa Nobel Prize Scientist Joint Research Center, Frontiers Science Center for Materiobiology and Dynamic Chemistry, Institute of Fine Chemicals, School of Chemistry and Molecular Engineering, East China University of Science and Technology, Shanghai 200237, China
b.
Shanghai Engineering Research Center for Multi-media Environmental Catalysis and Resource Utilization, East China University of Science and Technology, Shanghai 200237, China
Received Date:
28 April 2021 Accepted Date:
05 August 2021 Revised Date:
24 June 2021 Available Online:
15 March 2022
Abstract:
In recent years, MoS2 catalyzed/cocatalyzed Fenton/Fenton-like systems have attracted wide attention in the field of pollution control, but there are few studies on the effect of H2O2 feeding way on the whole Fenton process. Here, we report a new type of composite catalyst (MoS2-Fex) prepared in a simple way with highly dispersed iron to provide more active sites. MoS2-Fex was proved to possess selectivity for singlet oxygen (1O2) in effectively degrading sulfadiazine with a wide pH adaptability (4.0~10.0). Importantly, the mechanism of the interaction between H2O2 and MoS2 on the Fenton reaction activity was revealed through the combination of experiment and density functional theory (DFT) calculations. Compared to the traditional "a large amount for one time" feeding way of H2O2, the "small amount for multiple times" of H2O2 feeding way can increase the degradation rate of sulfadiazine from 36.9% to 91.1% in the MoS2-Fex heterogeneous Fenton system. It is demonstrated that the "small amount for multiple times" of H2O2 feeding way can reduce the side reaction of decomposition of H2O2 by MoS2 and effectively improve the utilization rate of H2O2 and the stability of MoS2-Fex. Compared with Fe2O3-based Fenton system, MoS2-Fex can significantly save the amount of H2O2. Compared with nano-iron powder, the formation of iron sludge in MoS2-Fex system was significantly reduced. Furthermore, long-term degradation test showed that the MoS2-Fe75/H2O2 system could maintain the effectiveness of degrading organic pollutants for 10 days (or even longer). This study has a guiding significance for the large-scale treatment of industrial wastewater by improved Fenton technology in the future.
Due to the use of aromatic pollutants such as organic dyes, antibiotics and pesticides in various fields, these pollutants inevitably flow into natural groundwater, reservoir, and watercourse [1, 2]. Water pollution caused by the disposal of sewage with pollutants above has become an environmental issue of great concern. So as to treat wastewater, physics, chemistry, biological treatment technologies are generally adopted, while advanced oxidation processes (AOPs) have attracted increasing interest as promising powerful methods to efficiently removing persistent organic pollutants from water [3-6]. Fenton or Fenton-like technology is one of the most important AOPs [7-9] and has been widely used in biology, environment and other fields. This type of technology relies on the generation of various reactive oxygen species (ROSs), such as hydroxyl radicals (·OH), singlet oxygen (1O2) and superoxide radicals (·O2–) to degrade organic pollutants. However, practical Fenton technology used to degrade stable organic pollutants has certain drawbacks up to now. In the traditional Fenton reaction, Fe3+ generated after Fe2+ reacts with hydrogen peroxide (H2O2) cannot be recycled, which leads to the loss of iron source in the reaction and the reduction of Fenton reaction efficiency [10-12]. In addition, the opportune pH range in the conventional Fenton reaction is narrow [13]. High pH will make the generation of ROSs difficult and produce Fe(OH)3 precipitation [14]. These objections severely hinder the further application of Fenton reaction.
To overcome the above shortages, in recent years, MoS2 as a cocatalyst in Fenton reaction has attracted extensive concern since it can overcome most of the shortcomings of Fenton reactions. This is derived from the discovery by Xing et al. in 2018 [10]. They found that commercial 2H-type MoS2 (< 2.00 µm) without any additional treatment could serve as a cocatalyst to significantly accelerate the cycle of Fe2+/Fe3+ in Fenton reaction. Unsaturated S atoms on the surface of metal sulfides can capture protons from the solution to form H2S, and expose reductive metallic active sites to greatly accelerate the rate-limiting step of Fe3+/Fe2+ conversion at the same time. In addition, the fast conversion of Fe3+/Fe2+ caused an increased amount of ·OH generated from the decomposition of H2O2, which was proved to rapid and efficient inactivate Escherichia coli K-12 (E. coli) and Staphylococcus aureus (S. aureus) [15]. In 2018, Xu et al. reported that flower-like MoS2 powders were synthesized via a one-pot hydrothermal reaction and exhibited high-efficient adsorption performance to cationic dyes [16]. Due to strong electrostatic interaction between the positively charged pollutants molecules and electronegative MoS2 nanoflowers, high-efficient adsorption capacity was very effective for improving the reaction efficiency of heterogeneous Fenton reaction. Next, Zhang et al. found that the performance of MoS2 for activating Fe3+/persulfate system can be effectively enhanced by introducing S defects into MoS2 through thermal annealing. And the mechanism of S defects in accelerating the catalytic degradation of contaminants was revealed to be the modified surface charge distribution and enhanced adsorption of Fe3+ [17]. Shen et al. developed a new and convenient biomimetic method to construct magnetic composites of MoS2 and Fe3O4 magnetic nanoparticles (MoS2-Fe3O4 MNPs) that effectively degraded methylene blue with H2O2 [18]. Indeed, it can be proved by current research that MoS2 has a satisfactory effect in promoting the heterogeneous Fenton reaction, especially in solving the iron sludge problem and promoting the cycle of Fe2+/Fe3+. However, these researches tend to focus on designing more new catalysts based on MoS2 to efficiently degrade pollutants in the different environment, while there are few studies on the effect of oxidant (H2O2etc.)-MoS2 interaction on the whole Fenton process. And the mechanics of the catalyst may have unexpected consequences for the whole Fenton reaction.
Herein, we reported a new type of easily prepared composite catalyst (MoS2-Fex, x/mg represents the mass of FeSO4·7H2O in the precursor) by using MoS2 as a co-catalyst while bringing its own highly dispersed iron source (Fig. 1a). The structure and composition of the catalysts were thoroughly analyzed with multiple characterization methods. Through the tests of transmission electron microscopy (TEM), high resolution TEM (HRTEM) and scanning TEM (STEM), it could be clearly seen that the MoS2 still maintained the original nanoflower shape, and iron was evenly dispersed in the center and edge petals of the MoS2 nanoflowers. Through the combination of experiments and DFT calculations, the mechanism of the interaction between H2O2 and MoS2 on the activity of the whole Fenton system was explained, especially the feeding way of H2O2 played an important role. The sulfadiazine (SD) was used as a model pollutant to study the effect of the catalyst in the degradation of organic pollutants, and ROSs in the system were verified through electron paramagnetic resonance (EPR) and sacrificial agent experiments. It was found that the MoS2-Fex based Fenton system with a "small amount for multiple times" of H2O2 feeding way was suitable for treating organic pollutants in near neutral or even weakly alkaline environments. Finally, degradation experiments for other pollutants were used to prove the universality of the catalyst, and the stability of the catalyst was proved through cycle experiments and long-term experiments.
Figure 1
Figure 1.
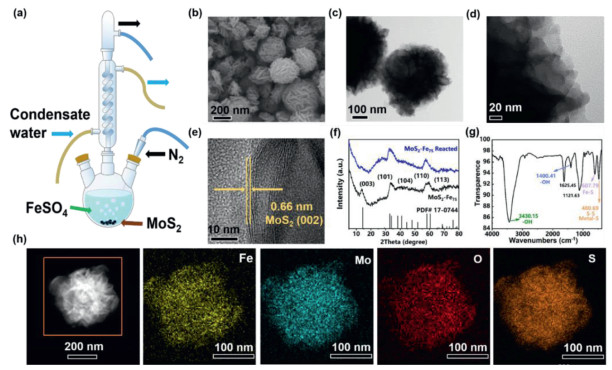
Characterization of MoS2-Fe75. (a) The experimental device for preparing MoS2-Fe75. (b) SEM image of MoS2-Fe75. (c, d) TEM images of MoS2-Fe75. (e) HRTEM image of MoS2-Fe75. (f) XRD patterns of MoS2-Fe75 before and after reaction. (g) Infrared spectrum of MoS2-Fe75. (h) EDX mapping images of MoS2-Fe75.
In order to investigate the specific morphology of the catalyst, scanning electron microscope (SEM) and TEM were used first to characterize the morphology and structure of MoS2-Fex. It can be clearly seen from Figs. 1b and c that MoS2-Fe75 still maintained the nanoflower shape of MoS2 with an average diameter of 0.10-0.60 µm and massive petals. According to the results of inductively coupled plasma atomic emission spectrometry (ICP-AES) in Table S1 (Supporting information), the iron content in the catalyst was about 13.0%. As shown in Fig. 1d, Figs. S1a and b (Supporting information), no particles were observed at the edge thin layer of MoS2-Fe75 nanoflowers in the TEM image, differing from three-dimensional (3D) α-Fe2O3/MoS2 hierarchical nano-heterostructure [19]. In the HRTEM images (Fig. 1e, Figs. S1c and d in Supporting information), only the lattice fringes of MoS2 with low crystallinity were observed, which means that there was no crystalline iron or iron oxide embedded in MoS2. In addition, the X-ray diffraction (XRD) pattern in Fig. 1f evidently showed the characteristic peaks of MoS2 at 2θ of 14.53°, 33.02°, 34.06°, 38.37°, 41.10°, 58.31° and 60.50°correspond well to MoS2 Bragg planes of (003), (101), (012), (104), (015), (110) and (113), respectively. No characteristic peak of iron or iron oxides was observed, which was consistent with the result in the above HRTEM images. Although the content of Fe is as high as 13%, it does not generate any iron oxide, indicating that our synthesis strategy can achieve a highly dispersion of Fe atoms on the MoS2 surface. The XRD pattern of MoS2-Fe75 after reaction in Fig. 1f retained the characteristic peaks of MoS2, which meant good stability of MoS2-Fe75.
On the basis of infrared spectrum of MoS2-Fe75 in Fig. 1g, the peaks at 3430.15 cm−1 and 1400.41 cm−1 indicated the presence of –OH on the surface of MoS2-Fe75. Compared with the infrared spectrum of MoS2 in Fig. S2a (Supporting information), the peak at 3434.33 cm−1 was significantly enhanced, which indicated that the introduction of iron brought more surface hydroxyl groups (–OH). Therefore, it could be speculated that some of the iron atoms in the catalyst were connected to the –OH during the preparation process. The peak at 607.79 cm−1 indicated the stretching vibration of Fe–S bond [20], which illustrated that Fe2+ was firstly coordinated with unsaturated S and then reduced and fixed on the surface of MoS2, and it also explained why there was only a small peak belonging to Fe0 in the followed high resolution X-ray photoelectron spectroscopy (XPS) results. Besides, the peak at 480.69 cm−1 indicated the presence of Metal–S or S–S bond [21]. According to the infrared spectrum of MoS2-Fe75 after degradation reaction (Fig. S2b in Supporting information), the –OH of MoS2-Fe75 was reduced, proving that the –OH on its surface would be consumed with the dissolution of iron. In addition, the infrared spectrum of TiO2-Fe75 (Fig. S2c in Supporting information) confirmed that the introduction of Fe in the same way also resulted in a large number of surface –OH and further improved the hydrophilicity of the catalyst. According to Fig. S3 (Supporting information), nitrogen adsorption and desorption isotherms of MoS2 and MoS2-Fe75 show that their specific surface areas were 29.9572 m2/g and 19.4070 m2/g respectively, accompanied by the hysteresis loop caused by nano petals. With the introduction of iron, the specific surface area of the catalyst was slightly reduced.
During the preparation process, Fe2+ was more easily coordinated with unsaturated S on the surface of MoS2 [17], leading to good dispersion and adhesion on the surface of MoS2. With the addition of NaBH4, Fe2+ was reduced gradually. MoS2-Fex were also analyzed using STEM coupled with energy dispersive X-ray spectroscopy (EDX) to confirm the composition of catalyst. The corresponding EDX mapping images of MoS2-Fe75 in Fig. 1h showed that the homogeneous distribution of Fe (indicated by yellow color), Mo (indicated by blue color), O (indicated by red color) and S (indicated by orange color) elements, demonstrating the uniform distribution of Fe atoms among the whole MoS2 nanoflower.
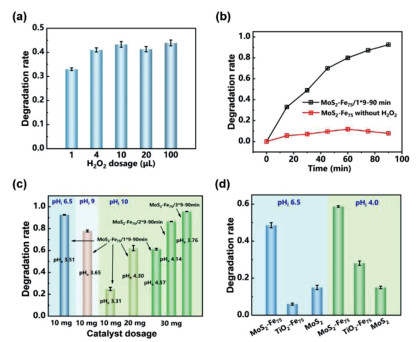
In order to investigate the effect of MoS2-Fex in the degradation of organic pollutants, we firstly tested the catalytic effect of MoS2-Fex prepared with different FeSO4·7H2O content in the precursor. When the mass of FeSO4·7H2O in the precursor was 75.0 mg, the catalytic effect of MoS2-Fex was the best (Fig. S4a in Supporting information). During the exploration, it was found that the addition of a large amount of H2O2 at one time did not achieve a good effect on the degradation of SD. According to the results in Fig. 2a, when the amount of H2O2 was 1.0, 4.0, 10.0, 20.0 and 100.0 µL, the degradation rate reached 33.0%, 41.0%, 43.0%, 41.3% and 43.9%, respectively, which may be due to the presence of excessive H2O2 triggered a large number of competing reactions [22]. Therefore, a "small amount for multiple times" feeding way of H2O2 may achieve better degradation effect. When 1.0, 1.5, 2.0 and 3.0 µL of H2O2 was added for 3 times, the degradation efficiency of SD reached 48.6%, 53.5%, 60.0% and 50.6%, respectively (Fig. S4b in Supporting information). The time interval of adding H2O2 was also proved to affect the degradation efficiency. With the increase of the total amount of H2O2, the activity of MoS2-Fe75 for the degradation of SD increased first and then decreased, indicating that excessive H2O2 with MoS2-Fe75 as the catalyst inhibited the degradation process due to reaction between MoS2 and H2O2. When the total amount of H2O2 is constant, the activity of the catalyst increases slightly with the increase of reaction time. For instance, the degradation rate of the MoS2-Fe75/1*6-60min (The Z/a*b-cmin means a µL of H2O2 was added to the solution every c/b min, a total of b times, and the total experiment time was c min with Z as catalyst) system was only 13.0% higher than that of the MoS2-Fe75/1*6-30min system (Fig. S4c in Supporting information). Interestingly, the feeding way of H2O2 has a significant effect on the Fenton activity of MoS2-Fex. For example, when the total amount of H2O2 is fixed at 9.0 µL in MoS2-Fe75 based Fenton system, the degradation rate of the system adding H2O2 in 9 times is much higher than that of the system adding H2O2 in three or one time (Fig. S4c). In order to maximize the utilization rate of H2O2, a total of 9.0 µL H2O2 is added into the solution in 9 times (adding 1.0 µL H2O2 every 10 min), which is defined as MoS2-Fe75/1*9-90min under the optimal degradation condition for 10 mg/L of SD without adjusting pH here.
Figure 2
Figure 2.
Degradation rate of SD under different conditions with MoS2-Fe75. (a) Degradation rate at different dosages of H2O2 without adjusting pH (H2O2 is added at one time; SD: 10.0 mg/L, MoS2-Fe75: 100.0 mg/L, Reaction time: 30 min). (b) Changes in degradation rate over time under optimal conditions (SD: 10.0 mg/L, MoS2-Fe75: 100.0 mg/L, MoS2-Fe75/1*9-90min, pHi 6.50). (c) The degradation of different dosages of catalyst and H2O2 under different pH (pHe means the pH value at the end of reaction). (d) The degradation efficiency of other catalysts prepared by the same method (SD: 10.0 mg/L, catalyst: 100.0 mg/L, MoS2-Fe75/1*3-30min).
In addition, MoS2-Fe75 exhibited interesting wide pH adaptability. When 10 mg of MoS2-Fe75 was added to 10 mg/L of SD solution, the initial pH (pHi) of the solution was 6.5. As shown in Fig. 2b, MoS2-Fe75 based Fenton system showed much higher efficiency in degrading SD than the blank catalyst without H2O2. When the pHi of the MoS2-Fe75/1*9-90min system was close to neutral, the degradation rate was fast at first and then slowed down gradually. The degradation rate of the MoS2-Fe75/1*9-90min system can reach 93.2%, when the pHi is 6.50 (Fig. 2c). Even when the pHi was increased to 9.00, the degradation rate of the MoS2-Fe75/1*9-90min system remained at 77.9%. However, when the pHi was 10.0, its degradation rate could only reach 24.9%. To solve this problem, the addition amounts of MoS2-Fe75 and H2O2 were increased, as shown in Fig. 2c. Obviously, the degradation rate of the MoS2-Fe75/3*9-90min system could reach 95.6% with 300.0 mg/L MoS2-Fe75 added, indicating that the increase of the amount of MoS2-Fe75 and H2O2 had varying degrees of impact on the degradation rate. As shown in Fig. S4d (Supporting information), when pHi was 10.00, we also monitored the concentration of SD in the system in real time. Similar to the experiment of pHi 6.50, the concentration of SD in the system also decreased with each addition of H2O2 instead of waiting until the pH dropped to a certain level before it started to decrease. Although the pH of the system continued to decrease with the addition of H2O2 and became less than 4.0 at the end of reaction (pHe < 4.0, Fig. S5 in Supporting information), the degradation of SD was carried out with each addition of H2O2 (Fig. 2b), rather than when the pH reached the appropriate range for the Fenton reaction. Besides, the degradation rate reached the fastest at the beginning of the experiment and gradually slowed down as the pH decreased. Therefore, the degradation rate had no obvious correlation with the pH of the system but connected with the concentration of SD in the system. As for MoS2-Fe75, adsorption was not the main factor leading to the reduction of SD content. According to Fig. 2b, MoS2-Fe75 reached the adsorption equilibrium for SD in about 1 h, and the adsorption amount was about 10.0% of the total.
The chemical interaction between MoS2 and Fe was indispensable because independent MoS2 or Fe was difficult to degrade SD effectively. As shown in Fig. 2d, the effect of TiO2-Fe75 synthesized by the same method as MoS2-Fe75 was only about half of MoS2-Fe75 when the pHi was 4.00, while TiO2-Fe75 had almost no effect when the pHi was 6.50. As for MoS2, it was difficult to degrade SD with the addition of H2O2. The degradation rate of SD only reached 11.5%, no matter the pHi of the system was 4.00 or 6.50, and the degradation rate here was probably due to the adsorption of MoS2 itself, according to the previous adsorption test of MoS2-Fe75 in Fig. 2b.
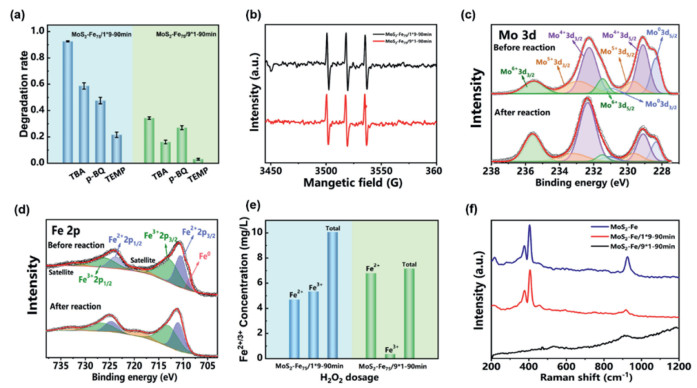
To further explore the oxidation mechanism of the MoS2-Fe75 catalytic Fenton reaction, radical quenching tests were conducted by using tert-butanol (TBA), p-benzoquinone (p-BQ) and 2,2,6,6-tetramethylplperldine (TEMP) as the corresponding sacrificial agents. According to Fig. 3a, the degradation rate of SD in the MoS2-Fe75/1*9-90min system decreased inordinately with the addition of sacrificial agents under optimal conditions. Therein, the addition of TEMP that could sacrifice 1O2 reduced the degradation rate of SD to 21.6%, which meant that 1O2 played the most crucial role in the reaction, and TBA and p-BQ also hindered the degradation in a minor way at the same time. There were the same results occurring in the MoS2-Fe75/9*1-90min system, demonstrating the similar oxidation mechanism. This indicates that the different adding ways of H2O2 may not change the decomposition process of H2O2, but only improve the decomposition efficiency of H2O2. Additionally, EPR test was employed to further detect the radicals present in the system with 5,5-dimethyl-1-pyrrolidine-N-oxide (DMPO) and TEMP as capture agents. Interestingly, the MoS2-Fe75 catalytic Fenton system exhibited obvious signal of 1O2 (Fig. 3b), while the signals of ·OH and ·O2– was not detected immensely shown in Fig. S6 (Supporting information) violating the traditional Fenton process. The electrostatic layer formed by the negative charge on MoS2-Fe75 surface greatly attracted iron ions and positively charged pollutants while non-electropositive substance like TEMP and DMPO cannot be adsorbed to the surface of MoS2-Fe75 very soon, which may greatly affect the capture of ·OH and ·O2– that formed near the surface of MoS2-Fe75.
Figure 3
Figure 3.
Detection of ROSs in the system and changes in catalysts before and after the reaction. (a) Degradation rate of SD in the presence of different radical scavengers including TBA (0.02 mol/L), p-BQ (0.70 mmol/L), and TEMP (0.14 mmol/L) for the quenching of ·OH, ·O2–, and 1O2, respectively, under the optimal conditions (SD: 10.0 mg/L, MoS2-Fe75: 100.0 mg/L, MoS2-Fe75/1*9-90min). (b) EPR spectra for the detection of 1O2 in the presence of TEMP (98.0%, GC), using water as the solvent. The details of the EPR tests are as follows: capture agent was added into the reaction solution after the reaction started for 1 min, and the EPR test was performed after mixing the two solutions for 30 s. (c) The XPS pattern of Mo 3d before and after co-catalytic Fenton reaction (left to right: 235.5, 232.9, 232.2, 231.4, 231.0, 229.7, 229.1, 228.3 eV). (d) The XPS pattern of Fe 2p before and after co-catalytic Fenton reaction (left to right: 732.5, 726.7, 723.8, 718.8, 713.3, 710.6, 708.7 eV). (e) The concentration of the dissolved iron ions in the system of MoS2-Fe75/1*9-90min and MoS2-Fe75/1*9-90min (pHi 6.5). (f) Raman spectra of MoS2-Fe75 and MoS2-Fe75 after different H2O2 added in the way of MoS2-Fe75/1*9-90min and MoS2-Fe75/1*9-90min.
Additionally, methyl phenyl sulfoxide (PMSO) as a probe was employed to detected Fe(Ⅳ) in the reaction [23]. Fe(Ⅳ) is able to convert PMSO into its oxidation product (PMSO2), markedly differing from the ·OH-induced products. Depending on the η which is the molar ratio of PMSO2 produced to PMSO lost (Eq. 1 and Fig. S7 in Supporting information), its value increased to 0.16 in the first 15 min, which meant that Fe(Ⅳ) was not the primary oxidative species generated in the MoS2-Fe75/H2O2 system at the beginning of experiment and it got higher as the reaction went on. Compared with the degradation process of SD catalyzed by MoS2-Fe75 (Fig. 2b), SD was degraded fast at the beginning of the reaction and the reaction rate was getting slower, which was just opposite of the changing trend of η. Therefore, Fe(Ⅳ) was not the primary oxidative species generated in the MoS2-Fe75/H2O2 system during the whole process.
(1)
The XPS spectra of Mo 3d and Fe 2p were employed to study the surface chemical state of MoS2-Fe75, as is shown in Figs. 3c and d. As for the MoS2-Fe75 before reaction, there were four kinds of molybdenum ions and three kinds of iron ions on the surface. Compared with the original MoS2 in Fig. S8 (Supporting information), the Mo5+ on the surface of the MoS2 was significantly reduced, and replaced by Mo4+. Mo0 existed on the surface of MoS2-Fe75 after reduction while Mo6+ was still found on MoS2-Fe75. Additionally, there was Fe0, Fe2+ and Fe3+ on the surface of MoS2-Fe75, and Fe2+/Fe3+ occupied the majority among them (Fig. 3d). For the catalyst after the reaction, Mo0 and Mo4+ was greatly consumed while Mo6+ increased evidently. For the Fe in the catalyst, Fe0 was consumed while the other iron ions did not change significantly, suggesting that Fe0 was involved in the decomposition of H2O2 by the Fenton reaction.
The concentration of Fe2+ was measured by 1,10-orthophenanthroline as a probe, while Fe3+ was reduced to Fe2+ first and then tested to calculate the total iron ions in the solution. According to Fig. 3e, the concentration of iron ions (10.07 mg/L) in the MoS2-Fe75/1*9-90min system was higher than that in the MoS2-Fe75/9*1-90min system (7.17 mg/L). However, the ratio of Fe3+ to Fe2+ in the former was 1.13, much higher than that in the latter (0.053). It meant that more Fe2+ participated in the Fenton reaction and then were oxidized to Fe3+, which made the degradation efficient. In other words, since H2O2 is added to the reaction system in a "small amount for multiple times" feeding way, the Fe2+ dissolved on the catalyst surface can decompose H2O2 more effectively, thus maintaining a stable iron cycle and keeping the ratio of Fe3+/Fe2+ at about 1.0. It was proved that excessive H2O2 added at one time did not speed up the process of Fenton reaction, which may be due to the direct reaction between H2O2 and MoS2. The side reaction of excess H2O2 and MoS2 made less amount of H2O2 involved in the Fenton reaction, resulting in a lower content of Fe3+ in the system of MoS2-Fe75/9*1-90min. Therefore, it is particularly important to understand the interaction between H2O2 and MoS2.
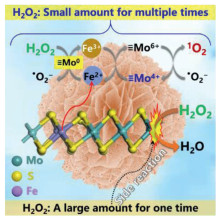
According to the above phenomena and analysis, the following mechanism can be inferred: Fe0 had strong reducibility that can reduce O2 to form H2O2 in acidic environment (Eq. 2) [24]. MoS2-Fe75 only contained a small section of Fe0 so that it was difficult to generate a large amount of H2O2, and the consumption of Fe0 cannot be avoided. Part of iron ions on the surface of MoS2-Fe75 was dissolved with the addition of H2O2 (Eq. 3). As shown in Fig. 3d, the peak of Fe0 completely disappeared, and the peaks of other iron ions in MoS2-Fe75 did not changed greatly. For some iron ions dissolved in the system, classic Fenton reaction was bound to happen in the system (Eq. 4), and Fe2+ could also reduce the O2 in the solution to ·O2– (Eq. 5). And the main ROS was still derived from H2O2 because the degradation rate did not have a great effect when the experiment was carried out in nitrogen atmosphere according to Fig. S9 (Supporting information). For the molybdenum ions of MoS2-Fe75, Mo4+ vastly facilitated the cycle of Fe2+ and Fe3+ (Eq. 6) during the reaction, preventing the formation of iron sludge and part of Mo4+ was oxidized to Mo6+ (Eq. 6) at the same time, which could be proved by the change of peaks in Mo 3d spectra. Mo6+ could be reduced to Mo4+ by H2O2, and O2 was produced meanwhile (Eq. 7). Moreover, Mo0 on the surface of MoS2-Fe75 effectively quenched ·OH in the system and then generated Mo4+ and OH– (Eq. 8 and Scheme 1), while part of the ·OH may further reacted with H2O2 to form ·O2H (Eq. 9) [25] and H2O. ·O2H was likely to be converted into ·O2– (Eq. 10) [26] with the departure of H+. Finally, Mo6+ was reacted with ·O2– to form 1O2 for further oxidation reactions (Eq. 11). Significantly, Mo° can effectively quench ·OH in the system after the reaction between H2O2 and Fe2+ [27], and Mo6+ on the surface fleetly oxidized the ·O2– to 1O2, which made it difficult to capture ·OH and ·O2– in the EPR tests. Relatively, 1O2 has a longer lifetime and it was easier to be captured in the MoS2-Fe75/H2O2 system.
(2)
(3)
(4)
(5)
(6)
(7)
(8)
(9)
(10)
(11)
Scheme 1
Scheme 1.
Possible mechanism of MoS2-Fex for the decomposition of H2O2 in different feeding way.
As is known to all, traditional Fenton reaction is greatly limited by the narrow pH range. However, the degradation of SD in nearly neutral and alkaline was achieved effectively by using MoS2-Fe75 instead of Fe2+ (Figs. 2b and c). High degradation rate was realized by increasing the amount of MoS2-Fe75 and H2O2, even though the catalytic performance of MoS2-Fe75 decreased at higher pH. Depending on the test in Fig. 2b, SD started to degrade immediately with the addition of H2O2, rather than when the pH of the solution became acidic. Therefore, high pH did not hinder the degradation in the MoS2-Fe75/H2O2 system, which may be attributed to the existence of acidic environment on the surface of MoS2-Fe75. As mentioned above, iron ions of MoS2-Fe75 was gradually dissolved with the addition of H2O2. Due to the existence of the unsaturated S with negative charges on the surface of MoS2-Fe75, H+ and Fe2+ tended to accumulate in the electrostatic layer near the surface of MoS2-Fe75, which constructed an acidic environment near the surface of MoS2-Fe75, and the pollutant was able to be degraded in this environment, so that the MoS2-Fe75/H2O2 system was no longer sensitive to pH.
Another interesting experimental phenomenon mentioned above was that compared with the addition of excessive H2O2 at once, the addition of H2O2 in batches with small amounts realized a better degradation effect. Fig. 3f exhibited the Raman spectra of MoS2-Fe75 before and after reaction. The E2g1 (384 cm−1) and A1g (408 cm−1) modes appeared at the same position as the commercial MoS2. The peak at 930 cm−1 was attributed to polymolybdates and its red shift [28] might be ascribed to the structure of –OH groups reported by Stencel et al. [29]. It was inferred that MoS2 can instantly react with high concentration of H2O2 because the addition of H2O2 to the system in different ways had substantially different effects on MoS2-Fe75 (Scheme 1). As shown in Fig. 3f, the peak of MoS2 was still prominent with H2O2 added in stages while barely seen with H2O2 added at one time. That means that MoS2 of MoS2-Fe75 was greatly consumed in the MoS2-Fe75/9*1-90min system but maintained the original peaks in the MoS2-Fe75/1*9-90min system. Combined with the dissolution of iron ions in Fig. 3e, it can be concluded that most of the H2O2 may directly react with MoS2 if the feeding rate of H2O2 was too fast, and the quick consumption of H2O2 made the Fenton reaction greatly restricted.
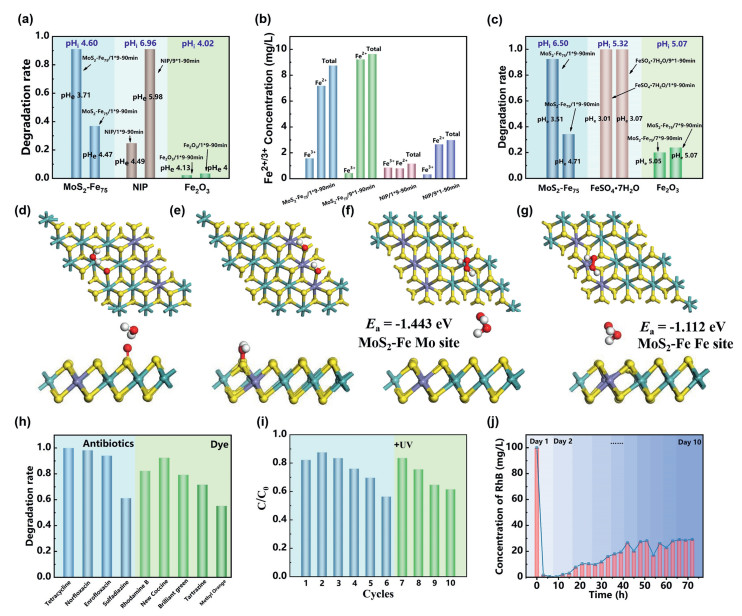
In addition, the prepared catalyst of MoS2-Fe75 was compared with the traditional heterogeneous Fenton catalysts, such as nano-iron powder (NIP) and Fe2O3. Interestingly, the experiment of NIP/9*1-90min got a degradability almost equivalent to MoS2-Fe75/1*9-90min while Fe2O3 could not be used to effectively degrade SD, as shown in Fig. 4a. In the system of MoS2-Fe75/1*9-90min, yellow iron mud was not found as is shown in Fig. S10 (Supporting information). However, it was easy for NIP/9*1-90min system to form a large amount of iron sludge after the reaction, causing considerable iron source loss (Fig. S11 in Supporting information). According to Fig. 4b, only a small amount of iron ions was left in the solution of NIP/9*1-90min system, and iron content in the yellow precipitate was very low, and more of precipitate was iron mud. In order to investigate the influence of H2O2 feeding way on Fe2O3 based heterogeneous Fenton system, we increased the amount of H2O2 to 63 µL to improve the degradation activity of the whole system, as shown in Fig. 4c. Unlike MoS2-Fe75 and NIP systems, Fe2O3 system is not sensitive to the feeding way of H2O2.The two feeding ways had no significant effect on the degradation activity of SD by Fe2O3 based Fenton system. The same phenomenon occurs in traditional homogeneous Fenton systems. When ferrous sulfate was used as the iron source, the activity of homogeneous Fenton reaction to degrade SD was also not affected by the feeding way of H2O2 (Fig. 4c). The above comparative experiments indicate that when researchers are developing new heterogeneous Fenton catalysts, they must consider the influence of H2O2 feeding way on the activity of the whole system. It is noted that MoS2-Fe75 can significantly reduce the amount of H2O2 compared with Fe2O3 based Fenton system; Compared with NIP, the formation of iron sludge was significantly reduced in MoS2-Fe75 system. Furthermore, the MoS2-Fe75 is fed with "small amount for multiple times" feeding way of H2O2, and its degradation activity is comparable to that of traditional homogeneous Fenton system.
Figure 4
Figure 4.
Comparative experiments of different Fenton systems (SD: 10.0 mg/L, catalyst: 100.0 mg/L, reaction time: 90 min) and the adsorption energy of H2O2 to the surface of catalyst at different distances and degradation universality and stability test: (a) pH after adding the catalyst and its degradation effect with different H2O2 adding ways. (b) Concentration of iron ions in the solution after the reaction (pHi 4.0). (c) Comparison of homogeneous and heterogeneous Fenton systems. (d, e) The reaction of H2O2 on Mo and Fe sites of MoS2-Fe75 when H2O2 is close to the surface. (f, g) The adsorption energy of H2O2 on Mo and Fe sites of MoS2-Fe75 when H2O2 is far from the surface. (h) Degradation test for different pollutants with 100.0 mg/L MoS2-Fe75 under optimal degradation condition (Pollutant: 20.0 mg/L, MoS2-Fe75/1*9-90min for antibiotics and MoS2-Fe75/1*3-30min for dyes). (i) Cycle tests of the degradation of RhB (20.0 mg/L) in the MoS2-Fe75 + H2O2 system under the optimal conditions (MoS2-Fe75: 100.0 mg/L, MoS2-Fe75/1*3-30min). (j) 10-day continuous degradation of RhB (total concentration: 2500.0 mg/L).
To further understand the interaction between H2O2 and MoS2, here, we have studied the adsorption of H2O2 on the surface of the catalyst by density functional theory (DFT) calculations. When the concentration of H2O2 is high, a large amount of H2O2 is close to the surface of MoS2-Fe75. At this time, the adsorption energy between the surface of MoS2-Fe75 and H2O2 cannot be calculated. In this case, a large amount of H2O2 will be decomposed into –OH and adsorbed on S atoms to form –S–O–H or –S–O, as shown in Figs. 4d and e. Therefore, only a small amount of H2O2 is decomposed to produce ROS, which also explains that in previous experiments, the MoS2-Fe75/9*1-90min system could not achieve a good degradation effect. However, when the concentration of H2O2 is low and its distance from the surface of MoS2-Fe75 is relatively far, different sites have different adsorption energies for H2O2. As shown in Figs. S12a and b (Supporting information) the adsorption energy of H2O2 on Mo site of MoS2 is −1.643 eV, but it becomes smaller on Fe site (−1.112 eV) and on Mo site (−1.443 eV) of MoS2-Fe75, according to Figs. 4f and g. It means that the introduction of highly dispersed Fe weakens the adsorption of MoS2 to H2O2 and reduces the amount of H2O2 that reacts directly with MoS2 (Scheme 1), which also shows that the introduction of iron atoms improves the stability of MoS2. Smaller absorption energy makes H2O2 dominant in the Fenton reaction when the amount of H2O2 is low. This point can also be confirmed in the iron dissolution experiment above (Fig. 3e). Compared with the one-time addition, more Fe2+ are oxidize to Fe3+ in the MoS2-Fe75/1*9-90min system, demonstrating that more H2O2 actually participate in the Fenton reaction when added in batches and lower concentration of H2O2 can better ensure the stability of MoS2-Fe75. There is still a big controversy as to whether the iron dissolved in the heterogeneous Fenton reaction or the iron in the solid phase plays a leading role [30]. According to the results of DFT calculations, the adsorption energy of H2O2 on Fe site of MoS2-Fex is smaller than that on Mo site, so H2O2 cannot directly react well with the iron in the solid phase of MoS2-Fe75. Therefore, it can be inferred that the iron dissolved on the catalyst surface is in the leading position in the Fenton reaction (Scheme 1).
In order to study the degradation pathway of SD in the MoS2-Fe75/H2O2 system, LC-MS/MS were used to determine the degradation intermediates. Sample was obtained through adding methanol when the MoS2-Fe75/1*9-90min system reacted for 10 min. The possible degradation intermediates are listed in Fig. S13 (Supporting information). Sixteen intermediates were identified, and a reasonable degradation pathway for SD by the MoS2-Fe75/H2O2 system was proposed. Due to the existence of sulfanyl and the pyrimidine ring in the SD, its degradation pathway was complicated. In the case of dominated by 1O2, C3H4O4 (m/z 103) and C2H2O4 (m/z 90) occupied a large proportion of the product, which was mainly obtained by the ring-opening reaction of C10H10N4 (m/z 187), C4H5N3 (m/z 111) and C4H4N2 (m/z 81) [31, 32]. In addition, due to the good stability of the benzene ring, there were a large number of aromatic compound intermediates in the solution, such as C6H5NO3 (m/z 139), C6H7N (m/z 93), C6H5NO2 (m/z 124). These intermediates were further mineralized in the following reaction. It's worth mentioning that ·OH in the traditional Fenton system will attack the amino group of SD to produce phenylhydroxylamine derivatives and other intermediates [33]. Phenylhydroxylamine derivatives are typical toxic byproducts, which can cause methemoglobinemia, and their toxicity is even higher than that of the SD molecule itself. However, in this case, the degradation pathways of SD based on 1O2 produced by MoS2-Fe75/H2O2 system were significantly different. 1O2 will directly attack the pyrimidine ring and the S–N bond, thus reducing the risk of forming phenylhydroxylamine toxic byproducts.
MoS2-Fe75 also exhibited excellent degradation performance on other model pollutants towards the removal of dyes and other antibiotics. Fig. 4h shows that the degradation rate of tetracycline hydrochloride, norfloxacin and enrofloxacin could reach 100.0%, 98.3% and 94.1% under the optimal degradation condition of SD. On the other hand, dyes such as new coccine, brilliant green, tartrazine and methyl orange were degraded in the system of MoS2-Fe75/1*3-30min and the degradation rates could reach 92.5%, 79.3%, 71.7% and 55.2%. This reflected that the MoS2-Fe75/H2O2 system had good degradability for different pollutants, which meant that this system had a certain degree of universality. As for the stability of MoS2-Fe75 during the degradation process, ten cycles of catalytic reaction tests were performed on the MoS2-Fe75/H2O2/RhB system under optimal conditions. As shown in Fig. 4i, the degradation rate of RhB maintained over 80.0% in the first 3 times with the system of MoS2-Fe75/1*3-30min and then decreased gradually. The decrease in degradation effect may be due to the degradation intermediates adsorbed on the surface of MoS2-Fe75 and this problem could be solved by UV lamp irradiation [34]. As a result, the organic intermediates on the surface of MoS2-Fe75 was further mineralized by ultraviolet light irradiation [35].
Overall, MoS2-Fex with highly dispersed iron as a novel catalyst has been successfully prepared through a simple reduction method. Specially, the MoS2-Fe75 based Fenton technology exhibits the ability to effectively degrade various organic pollutants by a "small amount for multiple times" feeding way of H2O2. In order to further verify the application prospect of the modified Fenton technology in the field of environment, we conducted a long-term degradation experiment of MoS2-Fe75/H2O2 system, as shown in Fig. 4j. When the concentration of RhB in the system was reduced from 100.0 mg/L to 30.0 mg/L or less, 100.0 mg/L of RhB was added to the reaction system to continue the reaction and the dosage of MoS2-Fe75 was 50.0 mg. In 10 days, a total of 25 times of 100.0 mg/L of RhB was added (total concentration: 2500 mg/L). The concentration of RhB in the system was reduced to 30 mg/L every time after the system of MoS2-Fe75/5*3-180min during the 10-day test. Combining with the results of the DFT calculations, when the concentration of H2O2 is low, the iron in the catalyst is not easy to directly react with H2O2, so MoS2-Fe75 has satisfactory stability when it interacts with H2O2. After drying and weighing, the weight of the remaining solid matter after the experiment is 40.5 mg and it could be calculated that 1.0 mg of RhB would be degraded for every 3.0 µL H2O2 and 0.076 mg MoS2-Fe75. This research provided a new option for overcoming the current drawbacks of Fenton reaction, including the problems of iron mud and the narrow pH range of Fenton reaction. Indeed, it provides more theoretical basis for the future application of MoS2 in the various fields. By revealing the mechanism of action between H2O2 and MoS2, the effect of "small amount for multiple times" H2O2 addition on Fenton activity is well explained, which has guiding significance for the future large-scale treatment of industrial wastewater by using improved Fenton technology.
Declaration of competing interest
The authors declare that they have no known competing financial interests or personal relationships that could have appeared to influence the work reported in this paper.
Acknowledgments
This work was supported by the State Key Research Development Program of China (No. 2016YFA0204200). Project supported by Shanghai Municipal Science and Technology Major Project (No. 2018SHZDZX03) and the Program of Introducing Talents of Discipline to Universities (No. B16017). National Natural Science Foundation of China (No. 21822603), and the Science and Technology Commission of Shanghai Municipality (No. 20DZ2250400). Authors thank Research Center of Analysis and Test of East China University of Science and Technology for the help on the characterization.
Supplementary materials
Supplementary material associated with this article can be found, in the online version, at doi:10.1016/j.cclet.2021.08.016.
Figure 1
Characterization of MoS2-Fe75. (a) The experimental device for preparing MoS2-Fe75. (b) SEM image of MoS2-Fe75. (c, d) TEM images of MoS2-Fe75. (e) HRTEM image of MoS2-Fe75. (f) XRD patterns of MoS2-Fe75 before and after reaction. (g) Infrared spectrum of MoS2-Fe75. (h) EDX mapping images of MoS2-Fe75.
Figure 2
Degradation rate of SD under different conditions with MoS2-Fe75. (a) Degradation rate at different dosages of H2O2 without adjusting pH (H2O2 is added at one time; SD: 10.0 mg/L, MoS2-Fe75: 100.0 mg/L, Reaction time: 30 min). (b) Changes in degradation rate over time under optimal conditions (SD: 10.0 mg/L, MoS2-Fe75: 100.0 mg/L, MoS2-Fe75/1*9-90min, pHi 6.50). (c) The degradation of different dosages of catalyst and H2O2 under different pH (pHe means the pH value at the end of reaction). (d) The degradation efficiency of other catalysts prepared by the same method (SD: 10.0 mg/L, catalyst: 100.0 mg/L, MoS2-Fe75/1*3-30min).
Figure 3
Detection of ROSs in the system and changes in catalysts before and after the reaction. (a) Degradation rate of SD in the presence of different radical scavengers including TBA (0.02 mol/L), p-BQ (0.70 mmol/L), and TEMP (0.14 mmol/L) for the quenching of ·OH, ·O2–, and 1O2, respectively, under the optimal conditions (SD: 10.0 mg/L, MoS2-Fe75: 100.0 mg/L, MoS2-Fe75/1*9-90min). (b) EPR spectra for the detection of 1O2 in the presence of TEMP (98.0%, GC), using water as the solvent. The details of the EPR tests are as follows: capture agent was added into the reaction solution after the reaction started for 1 min, and the EPR test was performed after mixing the two solutions for 30 s. (c) The XPS pattern of Mo 3d before and after co-catalytic Fenton reaction (left to right: 235.5, 232.9, 232.2, 231.4, 231.0, 229.7, 229.1, 228.3 eV). (d) The XPS pattern of Fe 2p before and after co-catalytic Fenton reaction (left to right: 732.5, 726.7, 723.8, 718.8, 713.3, 710.6, 708.7 eV). (e) The concentration of the dissolved iron ions in the system of MoS2-Fe75/1*9-90min and MoS2-Fe75/1*9-90min (pHi 6.5). (f) Raman spectra of MoS2-Fe75 and MoS2-Fe75 after different H2O2 added in the way of MoS2-Fe75/1*9-90min and MoS2-Fe75/1*9-90min.
Figure 4
Comparative experiments of different Fenton systems (SD: 10.0 mg/L, catalyst: 100.0 mg/L, reaction time: 90 min) and the adsorption energy of H2O2 to the surface of catalyst at different distances and degradation universality and stability test: (a) pH after adding the catalyst and its degradation effect with different H2O2 adding ways. (b) Concentration of iron ions in the solution after the reaction (pHi 4.0). (c) Comparison of homogeneous and heterogeneous Fenton systems. (d, e) The reaction of H2O2 on Mo and Fe sites of MoS2-Fe75 when H2O2 is close to the surface. (f, g) The adsorption energy of H2O2 on Mo and Fe sites of MoS2-Fe75 when H2O2 is far from the surface. (h) Degradation test for different pollutants with 100.0 mg/L MoS2-Fe75 under optimal degradation condition (Pollutant: 20.0 mg/L, MoS2-Fe75/1*9-90min for antibiotics and MoS2-Fe75/1*3-30min for dyes). (i) Cycle tests of the degradation of RhB (20.0 mg/L) in the MoS2-Fe75 + H2O2 system under the optimal conditions (MoS2-Fe75: 100.0 mg/L, MoS2-Fe75/1*3-30min). (j) 10-day continuous degradation of RhB (total concentration: 2500.0 mg/L).

 DownLoad:

 下载:
下载:


 下载:
下载:
