Received Date:
20 May 2019 Accepted Date:
16 July 2019 Revised Date:
09 July 2019 Available Online:
22 March 2020
Abstract:
It has been demonstrated that the conductivity and electrochemical properties of TiO2 nanomaterials can be significantly improved by an incorporation of carbon additives. In the study, we develop a novel Ndoped TiO2 mesoporous nanostructure via the addition of carbon quantum dots (CQDs) solution following a scalable hydrothermal process. The as-made TiO2 product shows well-defined morphology, high conductivity, large surface area, and abundant mesopores. When evaluated as anodes for sodiumion batteries, the CQDs@TiO2 product annealed at 500℃ exhibits a superior sodium storage capability. It delivers a high reversible capacity of 168.8 mAh/g at 100 mA/g over 500 cycles and long cycling stability. The remarkable performance of CQDs@TiO2 mainly arises from the large surface area and mesoporous architecture constructed by ultrathin TiO2 nanosheets, as well as the full cooperation between CQDs and TiO2.
To date, energy issues have become more and more prominent due to the continuous consumption of fossil fuels and the destruction of the environment [1]. Rechargeable lithium-ion batteries (LIBs) have been used as the effective energy devices in a wide range of fields owing to high energy density, long cycle life, and eco-friendly [2]. However, the rarity and high cost of Li resources limit their related development [3]. Therefore, exploring low-cost and reliable rechargeable battery systems is highly urgent. Fortunately, sodium-ion batteries (SIBs) have been recognized as an ideal substitute for LIBs by virtue of cost-effective and rich natural reserves [4-7]. Nonetheless, some host materials used for SIBs exhibit the limited capacity and slow diffusion kinetics, arising from the large ionic diameter of Na+ (1.02 Å) [8]. Thus, the main issue of SIBs is still to design the advanced electrode materials with good reversible Na+ insertion/extraction properties and satisfactory reversible capacity.
TiO2 has become an excellent representative of transition metal oxides (TMOs), which has been widely studied as one of the most potential anode material for SIBs due to small volume expansion of about 4%, good cycling stability, and stable chemical structure [9-11]. Nonetheless, similar to other TMOs, the bare TiO2 electrode suffers from the low capacity and poor rate performance, caused by internal low conductivity of TiO2 and sluggish reaction dynamics during charge/discharge processes. Many studies have shown that when some carbon additives are incorporated into the synthetic system of metal oxides, which can not only tune their morphology and structure, but also improve the conductivity of electrodes, thereby optimizing the electrochemical properties. Especially noted, a rising star of carbon family, namely carbon quantum dots (CQDs), have received significant attention because of unique photoelectric properties, since they were firstly discovered in 2004 [12]. For example, Tong and co-authors reported a carbon quantum dot decorated VO2, showing an improved cycling stability as cathodes for LIBs and SIBs [13]. Xia et al. synthesized MnO2 nanowires via a CQDs-mediated method, which exhibited the good electrochemical properties [14]. Therefore, following a similar way, it is expected to boost the electrochemical performance of TiO2 by incorporating CQDs into its framework.
Herein, we present a facile CQDs-induced protocol for preparing the N-doped TiO2 mesoporous nanostructure with superior sodium storage properties [15]. The resulting CQDs@TiO2 product shows fascinating features regarding uniformly spherical morphology, good crystallinity, large surface area, and high conductivity. The CQDs can not only support the growth of TiO2 nanosheets, but also promote the formation of hierarchical architecture. By means of the CQDs-TiO2 synergism, the resulting CT-500 electrode demonstrates an excellent sodium storage performance.
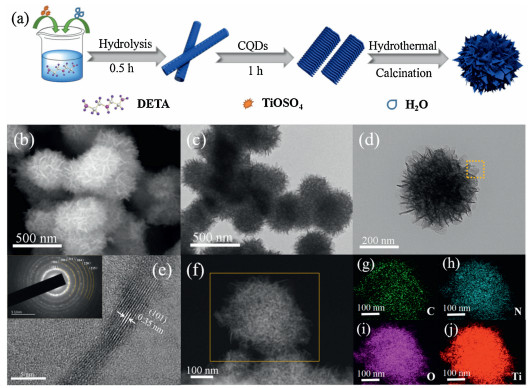
Fig. 1a simply depicts the overall synthetic process of CQDs@TiO2 sample. Initially, all the starting reagents were homogeneously mixed at room temperature. After 0.5 h of hydrolysis reaction, a certain amount of CQDs solution was added to the above solution and stirred continuously for 1 h. Then, the reactant was put into a Teflon-lined stainless steel autoclave at 180 ℃ for 12 h. After that, the typical CT-500 product was collected by annealing at 500 ℃ for 2 h in an inert atmosphere. The morphology and internal microstructure of the products were observed by SEM and TEM images. Fig. 1b shows a typical SEM image of CT-500. Apparently, the product has the uniformly spherical morphology with an average diameter of 380 nm. Seen from TEM image (Fig. 1c), the product demonstrates a hierarchical nanostructure, which is organized by a lot of thin nanosheets, in accordance with SEM analysis. Through closer observation, the hierarchical structure is constructed from an inside-out perspective (Fig. 1d). Significantly, the run-through porous structure is totally different from that of the control sample (Figs. S1 and S2a in Supporting information). In contrast, T-500 shows a distinct coreshell nanostructure with a diameter of about 370 nm, which is composed of a relatively solid core and a coarse shell containing small nanosheets. Fig. S2 (Supporting information) further verifies that the optimal concentration of CQDs solution is 5 mg/mL. The above results confirm that proper CQDs solution used in the present system can effectively regulate the morphology and structure of the products.
Figure 1
Figure 1.
(a) Schematic illustration for the growth process of mesoporous CT-500 product, (b) SEM image, (c, d) TEM images, (e) HRTEM image (inset is the SAED pattern), (f) STEM image, and (g–j) corresponding elemental mapping of CT-500.
HRTEM image was further used to determine the internal structure of CT-500 (Fig. 1e). The distinct interplanar spacing is about 0.35 nm, which is indexed to the (101) crystal plane of anatase phase, indicating the formation of TiO2. STEM image and the elemental mapping (Figs. 1f-j) illustrate that CT-500 is composed of Ti, O, C and N elements, showing a homogeneous distribution across the sample. It should be noted that C and N elements mainly derive from isopropanol, ethylene glycol and DETA, respectively. Their existence will make for the enhancement of the conductivity and increase of surface defects.
Fig. 2a shows the XRD patterns of CT-500 and T-500 samples. The diffraction peaks of two products are both well assigned to crystal planes of standard anatase TiO2 (JCPDS No. 21-1272) [16]. Remarkably, CT-500 has stronger diffraction intensities than those of T-500, meaning that the addition of CQDs can enhance the crystallinity. The thermal decomposition behavior of the sample is detected by TGA analysis. As displayed in Fig. 2b, the weight loss of ~6.46 wt% below 100 ℃ is generally attributed to the elimination of the physically adsorbed water, while the weight loss of 13.79 wt% between 100 C is mainly from the decomposition of carbon and residual organic species in CT-500 [17], which is higher than that of T-500 (Fig. S3 in Supporting information), suggesting the successful incorporation of CQDs in CT-500.
Figure 2
Figure 2.
(a) XRD patterns of CT-500 and T-500 products, (b) TGA curve, (c) N2 adsorption-desorption isotherm, and (d) corresponding pore size distribution plot of CT-500.
Figs. 2c and d present the N2 sorption isotherm and the corresponding pore size distribution of CT-500. As can be seen, the product has a type IV hysteresis loop, which is characteristic of mesoporous materials. The pore size distribution has two apparent peaks at around 3.77 and 7.43 nm, respectively, further proving the presence of mesopores [18]. Significantly, CT-500 possesses a large specific surface area of 197.7 m2/g, higher than 147.3 m2/g of T-500 (Fig. S4 in Supporting information). This suggests that these interconnected nanosheets contribute to the high surface area of CT-500. Meanwhile, such a mesoporous structure can also offer more accessible sites for the transmission and diffusion of sodium ions upon charge/discharge processes [10, 19].
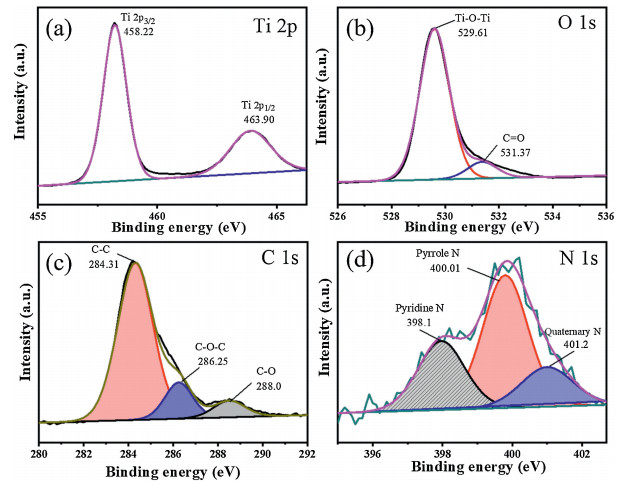
Fig. 3 provides the high-resolution XPS spectra of Ti, O, C and N elements. Observed from Fig. 3a, there are two peaks at the binding energies of about 463.90 eV and 458.22 eV, which are assigned toTi 2p1/2 and Ti 2p3/2, respectively [20, 21]. The O 1s high-resolution spectrum (Fig. 3b) shows two peaks at 529.61, 531.37 eV, corresponding to Ti-O-Ti and C¼O bonds, respectively [22]. Three peaks in the C 1s fitted XPS spectrum (Fig. 3c) are ascribed to C—C (284.31 eV), C—O—C (286.25 eV), C¼O (288.0 eV), respectively [23]. Fig. 3d displays three identified peaks at 398.1, 400.01, 401.2 eV of N 1s high-resolution spectrum, origining from pyridine N, pyrrole N and quaternary N, respectively [11]. The full XPS spectrum of CT-500 (Fig. S5 in Supporting information) exhibits the characteristic signals of Ti 2p, O 1s, C 1s and N 1s [24, 25], in agreement with the EDX analysis (Fig. S6 in Supporting information). The above results further affirm that the existence of C and N into the framework of TiO2, which is in favor of the improvement of conductivity and more active sites for sodium storage.
Figure 3
Figure 3.
High-resolution XPS spectra of CT-500: (a) Ti 2p, (b) O 1s, (c) C 1s and (d) N 1s.
To understand the growth process of CT-500, the structural evolution of samples were shown in Fig. S7 (Supporting information). At the initial hydrolysis stage, only some nanorods with rough surface were produced (Fig. S7a). Interestingly, once CQDs solution was introduced into the reaction system for another reaction of 1 h, TiO2 nanorods show a loose structure and uneven surface (Fig. S7b). That may come from the alcoholysis reaction between TiOSO4 and isopropyl alcohol/ethylene glycol. More importantly, these nanorods quickly became the oval shape with a burr-like surface after hydrothermal reaction of 1 h at 180 ℃
(Fig. S7c). The results suggest that the incorporation of CQDs can decrease the surface energy of the system, then promoting the formation of mesoporous TiO2 nanostructure [26]. With further increasing the hydrothermal reaction time, the product showed a spherical morphology, where more nanosheets grew onto the surface of nanospheres (Figs. S7d and e). After 12 h of hydrothermal treatment (Fig. S7f), it evolved a kind of hierarchical structure with homogeneous morphology and abundant pore structure. Additionally, a similar trend was also observed from the morphology evolution of T-500 product (Fig. S8 in Supporting information). That indicates that two products both undergo a rodto-sphere transformation during the synthetic process. However, a big difference is that the addition of CQDs can promote the formation of mesoporous nanostructure.
The sodium storage properties of CT-500 and T-500 anodes were evaluated by assembling CR2032 half-coin cells. Fig. 4a exhibits the initial three cyclic voltammogram of CT-500 with a scan rate of 0.1 mV/s between 0.01 V and 3.0 V (vs. Na/Na+). In the first cycle, the first cathodic peak in the range of 0.25–1.0 V is generally ascribed to an irreversible reduction peak, resulting from the generating of solid electrolyte interface (SEI) layer and some irreversible electrode reactions [27]. The cathodic/anodic peaks centered at 0.64/0.84 V (vs. Na/Na+) are related to the insertion/ extraction of Na+, corresponding to the redox reactions of Ti4+/Ti3+ from anatase TiO2 [28, 29].
Figure 4
Figure 4.
(a) The first-three CV curves of CT-500. (b) Charge-discharge profiles of CT-500 at a current density of 100 mA/g. (c) Rate capabilities of CT-500 and T-500 at the current densities from 100 mA/g to 1000 mA/g. (d) Electrochemical impedance spectra of CT-500 and T-500. (e) Relationship between logarithm peak current (cathodic peak at 0.64 V and anodic peak at 1.0 V) and logarithm scan rates, (f) Capacitive contribution (purple region) and diffusion contribution (blue region) of CT-500 electrode at 0.8 mV/s. (g) Cycling performances of CT-500 and T-500 at the current density of 100 mA/g (inset is the schematic illustration for the transport process of electrons and Na-ions in the CT- 500 electrode).
Fig. 4b shows the galvanostatic discharge-charge profiles for the 1st, 2nd and 3rd cycles of CT-500 at a current density of 100 mA/g. In the charge profiles, a distinct plateau at around 0.84 comes from the extraction of sodium ions. During the second and third discharge/charge periods, two potential plateaus are centered at 0.64 V/0.84 V, which are consistent in the CV analysis. The initial coulombic efficiency (CE) value is relatively low (42%), which is mainly attributed to the formation of SEI film, resulting in the large loss of irreversible capacity [30]. Afterwards, a higher CE value of 84% is achieved during the following cycles, and the CE improvement means that the irreversible loss in capacity derived from the Na+ trapped in the framework of TiO2 can be relieved upon cycling [31].Fig.S9(Supporting information)depictsthe initialthree cyclic galvanostatic discharge/charge profiles of T-500 under identical condition, and it shows the lower initial CE value of 30%, indicating that CT-500 has a better sodium storage performance.
Fig. 4c presents the rate capabilities of CT-500 and T-500. As the current density increases from 100 mA/g to 200, 500, 1000 mA/g, the CT-500 electrode delivers a discharge capacity of 168.7, 140.1, 121.5 and 109.4 mAh/g, respectively. Impressively, the discharge capacity still maintains 158.9 mAh/g when the current density goes back to 100 mA/g after the rate test. While the reversible capacities of T-500 electrode dramatically fall at the different current density in comparison to those of CT-500, and only 95.3 mAh/g after 60 cycles. Therefore, CT-500 is superior to T-500 in electrochemical performance, proving that the electrochemical properties can be significantly enhanced benefiting from the incorporation of CQDs into the present system.
Electrochemical impedance spectra (EIS) were also provided to better demonstrate the effect of CQDs on the conductivity of the CT-500 electrode. Observed from Fig. S10 (Supporting information), the Nyquist plots of two electrodes describe a semicircle in the high-to-medium frequency region and an angled line in the low frequency range. Clearly, CT-500 exhibits much smaller semicircle diameter than T-500, indicating the improved transport abilities of electrons and Na ions [32]. Meanwhile, the conductivity s of two electrodes was calculated following the Eq. (1) [33]:
(1)
where R, S, l are the semicircle diameter, tablet surface area, and tablet thickness, respectively. The calculation results show that the conductivity of CT-500 is as large as 1.92 × 10⁻⁸ S cm-1 (Fig. 4d), while T-500 has only 6.09 × 10⁻⁹ S/cm. The corresponding equivalent circuit diagram is further simulated (inset of Fig. S10). The analysis shows that the value of charge transfer resistance of CT-500 is 158.6 Ω, which is lower than T-500 (475.8 Ω). The results confirm that CT-500 has a higher conductivity, lower resistance, and better ability for the transmission of Na-ions and electrons during deep cycles.
The reaction kinetics of CT-500 was further analyzed by gathering the CV curves at different scan rates of 0.2–2.0 mV/s. As can be seen (Fig. S11a in Supporting information), all the CV curves have a uniform shape with broad peaks during the Na+ insertion/extraction processes. Subsequently, the power law formula is used to verify the capacitive effect by Eq. (2) [34], based on the relationship between the peak current (i) and scanning rate (v) in the CV curves.
(2)
The b value can be gotten from the slope of log(i)-log(v) plots. In general, when b approaches 0.5, the electrochemical reaction is dominantly controlled by ionic diffusion. While b is close to 1, the capacitance behavior is major in the electrochemical process [35].
Fig. 4e describes the log(i)-log(v) plots of CT-500. The b values of cathodic peak at 0.6 V and anodic peak at 1.0 V are 0.88 and 1.0, respectively, meaning that the intercalation process is mainly determined by capacitance. The capacitive contribution at a certain scanning rate can be quantified by differentiating them from total charge storage, including capacitance and diffusioncontrolled charge. Under a certain scanning voltage, the contribution from the combination of two mentioned contributions can be determined following the Eq. (3) [34]:
(3)
where k1v and k2v1/2 are the capacitive contribution and diffusion contribution at a fixed potential V, respectively. Fig. 4f shows that 75.4% of the total charge is from the capacitive contribution (purple region) at 0.8 mV/s. Further increasing the scan rates (Fig. S11b in Supporting information), the capacitance distributions gradually increase. The capacitance distribution rate is about 84.62% at the scan rate of 2 mV/s, showing that the capacitance behavior is the crucial to superior rate capacity.
The cycle performances of CT-500 and T-500 were further evaluated at 100 mA/g (Fig. 4g). Obviously, CT-500 has a better cycling stability than T-500. The reversible specific capacities of 212.3 and 168.8 mAh/g are delivered at the second cycle and after 500 cycles, respectively, with a capacity retention of 80%, indicating the efficient transfer of electrons and insertion and extraction of Na+ in the CT-500 electrode [31]. On the other hand, the reversible specific capacity of T-500 drastically decreases from 174.1 mAh/g in the second cycle to 94.2 mAh/g in the 500th cycle, with a low capacity retention rate of 54%. Fig. S12 (Supporting information) shows the reversible capacities of 104.5 mAh/g and 81.4 mAh/g after 450 cycles for CT-500 and T-500 at a higher current density of 1000 mA/g, respectively, further demonstrating that CQDs can enhance the electrochemical performance of TiO2.
Following these results, a possible sodium process of CT-500 electrode was describedin Fig. 4g. In brief, such aporous nanostructure induced by CQDs contributes to the superior sodium storage capabilities of CQDs@TiO2. First, the large surface area can increase the contact areas between electrode and electrolyte. Second, the abundant mesoporous structure assembled by nanosheets can shorten the diffusion pathway and promote the transmission of sodium ions and electrons during cycling. Third, thecarbon/nitrogen doping can also enhance the conductivity of the electrode and provide more surface defects for sodium storage. Last but not least, CQDs themselves have special features, such as excellent electron transfer, good conductivity, and reservoir properties, which can accelerate the transfer of electrons during the Na+ insertion/ desertionprocess, leading to the enhanced sodium storage. As listed in Table S1 (Supporting information), the CT-500 electrode developed in our work shows prominent advantages in the material synthesis and sodium storage performances.
In summary, an innovative synthetic route has been proposed for synthesis of N-doped TiO2 mesoporous architecture through a facile CQDs-regulated hydrothermal strategy. The obtained CT-500 product shows several merits regarding a large surface area of 197.7 m2/g, high conductivity, and interconnected pore structure. Thanks to these outstanding features, CT-500 demonstrates a high reversible capacity of 168.8 mAh/g at 100 mA/g after 500 cycles and superior durability. Such an excellent electrochemical performance highlights that the study developed for synthesis of TiO2 hierarchical nanostructure also paves a feasible way towards advanced electrode materials for energy storage and conversion.
Acknowledgments
The authors acknowledge the financial support from the Shuguang Program supported by Shanghai Education Development Foundation and Shanghai Municipal Education Commission (No. 18SG035) and Shanghai Pujiang Program (No. 17PJD015).
H.S. Hou, C.E. Banks, M.J. Jing, Y. Zhang, X.B. Ji, Adv. Mater. 27(2015) 7861-7866. doi: 10.1002/adma.201503816
[31]
L.M. Wu, D. Buchholz, D. Bresser, L.G. Chagas, S. Passerini, J. Power Sources 251(2014) 379-385. doi: 10.1016/j.jpowsour.2013.11.083
[32]
C.M. Chen, Y.C. Yang, S.S. Ding, et al., Energy Storage Mater.13(2018) 215-222. doi: 10.1016/j.ensm.2018.01.015
[33]
S.V. Gnedenkov, D.P. Opra, V.V. Zheleznov, et al., Russ. J. Inorg. Chem. 60(2015) 658-664. doi: 10.1134/S0036023615060054
[34]
J. Wang, J. Polleux, J. Lim, B. Dunn, J. Phys. Chem. C 111(2007) 14925-14931. doi: 10.1021/jp074464w
[35]
J.F. Ni, S.D. Fu, C. Wu, et al., Adv. Mater. 28(2016) 2259-2265. doi: 10.1002/adma.201504412
Figure 1
(a) Schematic illustration for the growth process of mesoporous CT-500 product, (b) SEM image, (c, d) TEM images, (e) HRTEM image (inset is the SAED pattern), (f) STEM image, and (g–j) corresponding elemental mapping of CT-500.
Figure 4
(a) The first-three CV curves of CT-500. (b) Charge-discharge profiles of CT-500 at a current density of 100 mA/g. (c) Rate capabilities of CT-500 and T-500 at the current densities from 100 mA/g to 1000 mA/g. (d) Electrochemical impedance spectra of CT-500 and T-500. (e) Relationship between logarithm peak current (cathodic peak at 0.64 V and anodic peak at 1.0 V) and logarithm scan rates, (f) Capacitive contribution (purple region) and diffusion contribution (blue region) of CT-500 electrode at 0.8 mV/s. (g) Cycling performances of CT-500 and T-500 at the current density of 100 mA/g (inset is the schematic illustration for the transport process of electrons and Na-ions in the CT- 500 electrode).

 DownLoad:


 下载:
下载:


 下载:
下载:
