
图 Scheme1
Synthesis of probe 8 and 9.
Scheme1.
Synthesis of probe 8 and 9.
Two near-infrared highly sensitive cyanine fluorescent probes for pH monitoring
Jing-Ru Hou , Di Jin , Bo Chen , Lei-Lei Si , Yue-Hua Jin , Li-Gong Chen , Xi-Long Yan , Bo-Wei Wang , Yang Li

As well known, pH value is a significant parameter in analytical chemistry, biology, clinical biochemistry and environment [1-12]. Particularly, intracelluar pH plays an essential role both in cellular behaviors and pathological conditions, such as proliferation and apoptosis, multidrug resistance (MDR), ion transport and homeostasis, enzyme activity and endocytosis [13-16]. Under normal physiological condition, extracellular H+ concentration is maintained within a very narrow limit. Deviation by 0.10-0.20 pH unit in either direction can cause severe problems, such as cardiopulmonary and neurologic problems (e.g., Alzheimer's disease), a larger variation can be fatal [17]. Therefore, it is essential to monitor the intracellular pH precisely and conveniently. In recent years, bioprobe has emerged and been intensively studied as a potential tool for pH monitoring in vivo by virtue of its non invasiveness, non-radioactivation, real-time imaging, sensitivity, convenience and visualization [18-24]. Several pH probes have been reported, such as N, N-dimethylaminophenyl-2, 6-dicarbox yethyl-1, 3, 5, 7-tetramethylboron-dipyrromethene (DiMeN-BDP) and its analogue [25], Dansyl acid (DA) [26], 3', 6'-bis (diethyla mino)-2-(2-((5-phenyl-1, 3, 4-oxadiazol-2-yl) amino) ethyl) spiro [isoindoline-1, 9'-xanthen]-3-one [27] etc. However, absorption maxima of these fluorescent probes were in the visible region where tissue penetration of light was shallow, thus these probes were less optimal for noninvasive in vivo imaging. Moreover, most reported fluorescence pH probes are practical for near-neutral pH range (i.e. pH 6.8-7.4) [17, 28-30], while there are limited probes for monitoring pH changes in acidic organelles (i.e. pH 4.5-6.0). These results encourage us to develop new NIR fluorescent probes for sensitively monitoring acid physiological pH fluctuations.
Heptamethine indocyanine dye is very famous for its NIR region absorption and emission (650 nm-900 nm) [31]. In this region, not only background absorption and tissue auto-fluorescence are weak, but also the photodamage to living cells is quite limited. Moreover, NIR emission can penetrate deeply with low light scattering to achieve distinct image in vivo assay. In addition, the pH-sensitive heptamethine indocyanine dyes can be divided into two types based on two different pH response mechanisms (i.e. intramolecular charge transfer (ICT) and photoinduced electron transfer (PET)), achieving fluorescent signal off and on [14]. Compared to the "always on" probes, "off-on" probes display high signal-to-noise ratio. Subtle changes to the structure of these cyanine-based probes can regulate their pKa values. However, heptamethine indocyanine probe always suffers from poor aqueous solubility and photostability, which hamper it from wide application.
To the best of our knowledge, introducing cationic units into probes' structure may not only improve the aqueous solubility of probes but also enhance their targeting ability to mitochondria [32-34]. Lee et al. reported a pH-sensitive fluorescent probe with cationic triphenylphosphonium unit as target group for diseased mitochondria. And Mo et al. also proved the cationic group had the ability to accumulate at the mitochondria. Based on these, we designed two novel NIR pH-activated probes to monitor pH fluctuation in biological system. These two probes are constructed of non-N-alkylated indolium cyanine and quaternary ammonium cations. The titration experiments demonstrate that these two novel probes exhibit good aqueous solubility and sensitive response to pH variation in the range of 5.50 to 4.00. Furthermore, these two probes have been successfully used for fluorescence imaging of the pH change in HeLa cells.
As shown in Scheme 1, compounds 1, 2, 3 and 4 were prepared according to our previously reported method [35, 36]. A condensation reaction of 2, 3 and 4 in ethanolyielded 5. Compound 5 further reacted with tin (Ⅱ) chloride to synthesize compound 6 via a reduction reaction. Then compound 7 was produced by acylating 6 with chloroacetyl chloride. Lastly, compound 7 was nucleophilic substituted by TEA and pyridine to afford 8 and 9, respectively. The structures of target compounds and intermediates were confirmed by 1H NMR, 13C NMR and ESI-MS analysis (Figs. S6-S18 in Supporting information).
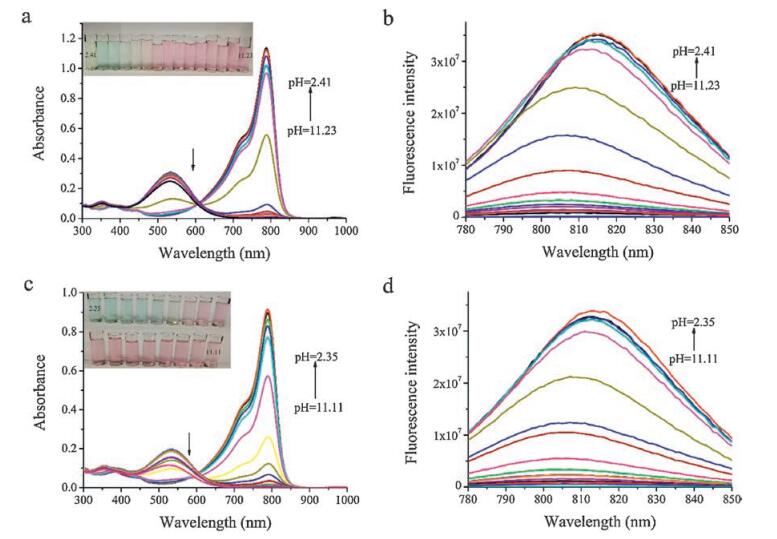
To evaluate their responses to pH, the absorption and fluorescence spectra of the probes in ethanol-water solution were firstly measured in the pH range of 12.00-2.00. As shown in Fig. 1(a and c), an absorption maximum at 535nm was observed in the pH range of 12.00-9.00. With decreasing the pH, the characteristic peak at 535nm was gradually reduced, whereas a new absorption peak was evolved and progressively increased at 789nm. Meanwhile, the color of the solution changed from pink to pale green, which demonstrated that both of 8 and 9 could serve as visual pH indicators. The fluorescence spectra of probes 8 and 9 upon different pH values were presented in Fig. 1(b and d). Under 750nm excitation, an emission band at 808nm appeared and underwent a concomitant monotonic increase with a decrease in the pH of the medium from 12.00 to 2.00. Moreover, Fig. S1 illustrated the pH response of probes 8 and 9 as a function of I/Imax vs. pH. According to the Henderson-Hasselbach-type mass action equation [37], the pKa values were 4.72 and 4.45 for probes 8 and 9 respectively, which indicated they were very suitable for studying acidic organelles. Probe 6 presented similar absorption and emission spectra as probe 8 or 9, but no fluorescent signal was observed any more when pH > 6.0 (Fig. S2 in Supporting information). In comparison, the pH response ranges of probes 8 and 9 were extended to12.0 from6.0. And compared with some reported probes [38-40], probes 8 and 9's absorption and emission wavelength were both in NIR region, which was more suitable for future biological applications. Furthermore, it was worth mentioning that the aqueous solubility of probes 8 and 9 (ethanol/ water = 2/8, v/v) were much better than that of probe 6 (ethanol/ water = 4:6, v/v), indicating that probes 8 and 9 were more suitable for monitoring pH in environmental and biological analysis.
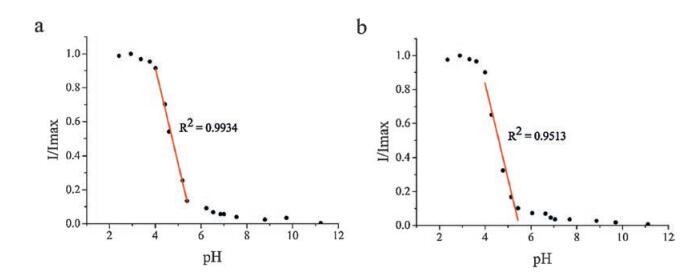
In order to directly reflect the relationship between pH and fluorescence, the relative fluorescent intensity at maximum emission wavelength towards pH were then plotted (Fig. 2). Remarkably, for probes 8 and 9, a sharp and almost linear fluorescence intensity increase (about 6-fold enhancement) appeared within the narrow range of pH 5.50-4.00. Thus, we speculated that these two cationic probes could achieve not only qualitative but also quantitative results in pH range of 5.50-4.00, making these pH-sensitive probes promising fluorescence indicators for monitoring slight pH fluctuation in physiological environment. What is more, compared with probe 6' pH-sensitive range (pH < 4.00 (Fig. S3 in Supporting information) and other reported probes' pH-sensitive range (pH 6.7-7.9) [17, 28], the pH-sensitive range of probes 8 and 9 more accorded with our original concept, particularly monitoring pH in acid organelles.
The reversibility of probes 8 and 9 was investigated [27, 41]. It was found that their response behaviors toward pH fluctuation were reversible according to the absorption and emission titration experiments. The absorption titration showed that the addition of hydrochloric acid could lead to bathochromic shift of absorption maxima and obvious color change. When pH was adjusted back to 8.96 by sodium hydroxide solution, the absorption maxima moved back to the original state and the color of the system recovered to pink (Fig. 3a and c). The emission titration also reflected that fluorescent signal could be reversibly enhanced and decreased by cyclically adding hydrochloric acid and sodium hydroxide (Fig. 3b and d).

The photostability of probes 8 and 9 was examined under irradiation with a 254 nm UV lamp. Their time-dependent fluorescence spectra with pH = 4.01 at room temperature were recorded over 60 min and the curves of fluorescence intensity vs. time were depicted in Fig. 4. For probe 8, almost no reduction of the fluorescence intensity was observed within the irradiating period, confirming that this probe was stable to environmental factors such as light, air and medium. However, for probe 9, the fluorescence intensity was slightly decreased over the irradiating time, yet the fluorescence intensity was still high. The difference between probe 8 and probe 9 on photostability was likely attributed to better activity of pyridinium salt than triethyl ammonium salt. Based on these results, we could conclude that probes 8 and 9 exhibited reversible response to pH and produced steady signals, indicating that these two probes could serve as switch on sensor for practical applications.

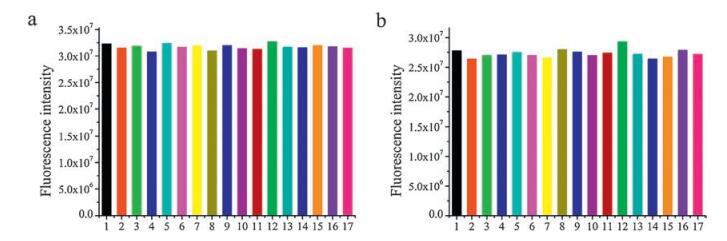
On account of the complexity of the intracellular environment, the selectivity of these two probes (1.0 × 10⁻⁵ mol/L) were studied at pH = 4.01 with a series of potential competitive species, including metal ions (Na+, K+, Mg2+, Zn2+, Cu2+, Ca2+, Mn2+, Co2+, and Ni2+), and some biologically important species (GSH, Cys, Gly, Trp, His, Arg, and H2O2). As expected (Fig. 5), no remarkable changes were observed upon addition of these potential interferents, enabling them as the promising pH-sensitive probes for practical application in complex environment.
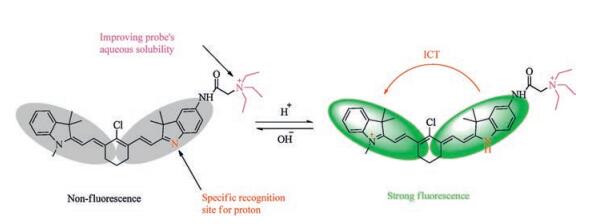
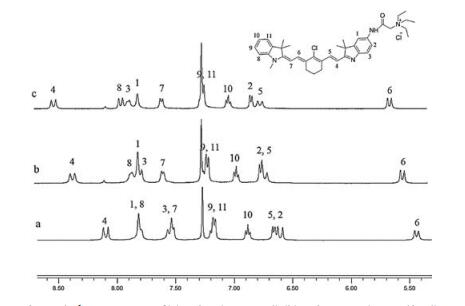
The responsive mechanism of probes 8 and 9 upon pH is ICT process (probe 8 as a typical example illustrated in Scheme 2). The pH-sensitive spectral response is possibly attributed to the protonation and deprotonation of the indole nitrogen atoms. The ICT process is enhanced upon the protonation of the nonalkylated nitrogen atoms, which leads to a bathochromic shift of absorption maxima and remarkable enhancement of the fluorescence intensity. To confirm this, 1H NMR spectra of probe 8 under different H+ concentrations were collected in CDCl3 (Fig. 6) (The 1H NMR spectra of probe 9 was shown in Fig. S4). Upon addition of CF3COOH, an obvious up-field shift was observed for the chemical shifts of the conjugation structural prontons (H1-H11). Meanwhile, the benzene ring protons of non N -alkylated indole (H1-H3) and the double bond protons adjoining non N -alkylated indole (H4, H5) had larger up-field shift than the other protons (H6-H11). The result revealed the protonation of the non-alkylated nitrogen atoms [14], which resulted in the decrease of electron density around the conjugation structure.
In addition, the wider pH response range of probe 8 or 9 than probe 6 is attributed to the pKa of their alkaline sites: aniline N atom (AN-N) > indole non-alkylated N atom (IA-N) > anilide N atom (AD-N). For probe 6, proton tends to bind AN-N instead of IA-N, thus just AN-N is protonated when pH > 5.90 and there is no ICT process as well as fluorescent signal observed. While pH < 5.90, excess proton induces protonation of IA-N, further enhanced ICT process and induced strong fluorescent signal. For probes 8 and 9, proton binds to IA-N preferentially, then IA-N is protonated in pH range from 12.00 to 2.00, namely there always exists ICT process and the fluorescent signal in pH range from 12.00 to 2.00.
To evaluate cytotoxicity of probes 8 and 9, we performed an MTT assay in HeLa cells with probes concentrations from 1.0 × 10⁻⁶ mol/L to 1.0 × 10⁻⁴ mol/L. As shown in Fig. S5, more than 70% of cells were viable at testing concentration for both probes 8 and 9, which clearly demonstrated that these two probes were low-toxic to cultured cell lines under the experimental conditions at the concentration of 1.0 × 10⁻⁵ mol/L.
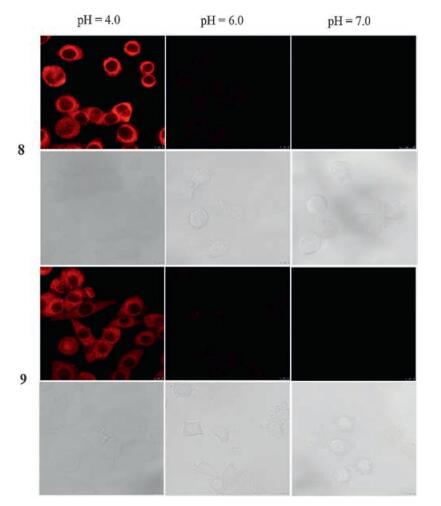
Live-cell imaging studies were carried out to evaluate the applicability of probes 8 and 9 for pH monitoring in living cells. We measured the cell experiments using HeLa cells incubated with probes 8 and 9 at pH 4.0, 6.0 and 7.0. As shown in Fig. 7, the cells exhibited almost no fluorescence emission at pH 7.0, but at pH 6.0 there was weak fluorescence emission and at pH 4.0 the fluorescence intensity obviously increased. Bright-field transmission measurements after probes 8 and 9 incubation confirmed that the cells were viable. These data demonstrated that probes 8 and 9 had good cell-membrane permeabilities and both probes could be used for imaging pH fluctuations under acidic condition in living cells.
In summary, two novel NIR cyanine fluorescent probes bearing quaternary ammonium unit were designed and synthesized. These two probes were highly sensitive to pH fluctuation and especially responded linearly and rapidly to pH in the range of 5.50 to 4.00 with pKa values of 4.72 and 4.45, respectively. Furthermore, these two fluorescent probes could be reversibly turned off and on by alternating pH values. These two cyanine fluorescent probes possessed several great properties, including desirable photostability, high selectivity, excellent aqueous solubility and low cytotoxicity, which would widen their applications. The pHdependent fluorescence imaging experiment demonstrated that probes 8 and 9 had excellent cell-membrane permeability and further monitored pH fluctuations in live cells. These results indicate that these two probes are particularly potential for detecting pH fluctuation in biological systems.
All the raw chemicals were purchased from commercial sources and used without further purification.
1H NMR and 13C NMR spectra were recorded on a Bruker Avance 400 spectrometer with TMS as an internal standard. Highresolution mass spectrum was obtained using a Bruker Daltonics microOTOF-Q Ⅱ instrument. All pH measurements were carried out with a Sartorius basic pH-meter PB-10. UV-vis spectra were measured on an Evolution 300 UV-vis spectrophotometer. Fluorescence spectra were recorded on a Jobin Yvon-Spex Fluorolog3 spectrophotometer.
The stock solutions of probes 8 and 9 (1.0 × 10⁻³ mol/L) were prepared by dissolving appropriate amount of probe 8 (6.3 mg) and probe 9 (6.0 mg) in ethanol and diluting them to the mark in the 10 mL volumetric flasks. Further dilution yielded the working solution (1.0 × 10⁻⁵ mol/L) by diluting 2.5 mL stock solution to 250 mL with ethanol-water (2:8, v/v). For measuring the optical response of the probes towards pH, the accurate pH of the working solution was adjusted by 0.1 mol/L NaOH and 0.1 mol/L HCl. The absorption and emission spectra were recorded in the wavelength range of 300 to 1000 nm. For the fluorescence measurements, excitation and emission slits were 10 nm and 8 nm, respectively. The excitation wavelengths for both compounds 8 and 9 were 750 nm.
We are grateful for the financial support from the National Natural Science Foundation of China (No. 21576194).
Supplementary data associated with this article can be found, in the online version, at http://dx.doi.org/10.1016/j.cclet.2017.03.037.
Yeh J.T., Venkatesan P., Wu S.P.. A highly selective turn-on fluorescent sensor for fluoride and its application in imaging of living cells[J]. New J. Chem., 2014, 38: 6198-6204. doi: 10.1039/C4NJ01486C
Lee H., Akers W., Bhushan K.. Near-infrared pH-activatable fluorescent probes for imaging primary and metastatic breast tumors[J]. Bioconjug. Chem., 2011, 22: 777-784. doi: 10.1021/bc100584d
Li C.Y., Kong X.F., Li Y.F.. Ratiometric and colorimetric fluorescent chemosensor for Ag+ based on tricarbocyanine[J]. Dyes Pigm., 2013, 99: 903-907. doi: 10.1016/j.dyepig.2013.07.032
Han Z.X., Zhu B.S., Wu T.L.. A fluorescent probe for Hg2+ sensing in solutions and living cells with a wide working pH range[J]. Chin. Chem. Lett., 2014, 25: 73-76. doi: 10.1016/j.cclet.2013.10.027
Maity D., Manna A.K., Karthigeyan D.. Visible-near-infrared and fluorescent copper sensors based on julolidine conjugates:selective detection and fluorescence imaging in living cells[J]. Chem. Eur. J., 2011, 17: 11152-11161. doi: 10.1002/chem.201101906
Wang C.C., Yan S.Y., Chen Y.Q.. Triphenylamine pyridine acetonitrile fluorogens with green emission for pH sensing and application in cells[J]. Chin. Chem. Lett., 2015, 26: 323-328. doi: 10.1016/j.cclet.2014.11.029
Shi W., Li X.H., Ma H.M.. Fluorescent probes and nanoparticles for intracellular sensing of pH values[J]. Methods Appl. Fluoresc, 2014, 2: 042001. doi: 10.1088/2050-6120/2/4/042001
Lv H.S., Huang Sh.Y., Zhao B.X.. A new rhodamine B-based lysosomal pH fluorescent indicator[J]. Anal. Chim. Acta, 2013, 788: 177-182. doi: 10.1016/j.aca.2013.06.038
Cao X.J., Chen L.N., Zhang X.. A NBD-based simple but effective fluorescent pH probe for imaging of lysosomes in living cells[J]. Anal. Chim. Acta, 2016, 920: 86-93. doi: 10.1016/j.aca.2016.03.029
Shen S.L., Chen X.P., Zhang X.F.. A rhodamine B-based lysosomal pH probe[J]. J. Mater. Chem. B, 2015, 3: 919-925.
Zhang X.F., Zhang T., Shen S.L.. A ratiometric lysosomal pH probe based on the naphthalimide-rhodamine system[J]. J. Mater. Chem. B, 2015, 3: 3260-3266. doi: 10.1039/C4TB02082K
Zhang X.F., Zhang T., Shen S.L.. A ratiometric lysosomal pH probe based on the coumarin-rhodamine FRET system[J]. RSC Adv., 2015, 5: 49115-49121. doi: 10.1039/C5RA06246B
Asanuma D., Takaoka Y., Namiki S.. Acidic-pH-activatable fluorescence probes for visualizing exocytosis dynamics[J]. Angew. Chem., 2014, 126: 6199-6203. doi: 10.1002/ange.201402030
Han J.Y., Burgess K.. Fluorescent indicators for intracellular pH[J]. Chem. Rev., 2010, 110: 2709-2728. doi: 10.1021/cr900249z
Klohs J., Baeva N., Steinbrink J.. In vivo near-infrared fluorescence imaging of matrix metalloproteinase activity after cerebral ischemia[J]. J. Cerebr. Blood Flow Metab., 2009, 29: 1284-1292. doi: 10.1038/jcbfm.2009.51
Li X.Q., Yue Y.K., Wen Y.. Hemicyanine based fluorimetric and colorimetric pH probe and its application in bioimaging[J]. Dyes Pigm., 2016, 134: 291-296. doi: 10.1016/j.dyepig.2016.07.033
Tang B., Yu F., Li P.. A near-infrared neutral pH fluorescent probe for monitoring minor pH changes:imaging in living HepG2 and HL-7702 cells[J]. J. Am. Chem. Soc., 2009, 131: 3016-3023. doi: 10.1021/ja809149g
Su M.H., Liu Y., Ma H.M.. 1, 9-Dihydro-3-phenyl-4H-pyrazolo[3, 4-b] quinolin-4-one, a novel fluorescent probe for extreme pH measurement[J]. Chem. Commun., 2001, 11: 960-961.
Wan Q.Q., Chen S.M., Shi W.. Lysosomal pH rise during heat shock monitored by a lysosome-targeting near-infrared ratiometric fluorescent probe[J]. Angew. Chem. Int. Ed., 2014, 53: 10916-10920. doi: 10.1002/anie.201405742
Yue Y.K., Huo F.J., Lee S.Y.. A review:the trend of progress about pH probes in cell application in recent years[J]. Analyst, 2017, 142: 30-41. doi: 10.1039/C6AN01942K
Yue Y.K., Huo F.J., Lee S.Y.. A dual colorimetric/fluorescence system for determining pH based on the nucleophilic addition reaction of an ohydroxymerocyanine dye[J]. Chem. Eur. J., 2016, 22: 1239-1243. doi: 10.1002/chem.201504395
Guo Z., Park S., Yoon J., Shin I.. Recent progress in the development of nearinfrared fluorescent probes for bioimaging applications[J]. Chem. Soc. Rev., 2014, 43: 16-29. doi: 10.1039/C3CS60271K
Stennett E.M., Ciuba M.A., Levitus M.. Photophysical processes in single molecule organic fluorescent probes[J]. Chem. Soc. Rev., 2014, 43: 1057-1075. doi: 10.1039/C3CS60211G
Shi W., Li X.H., Ma H.M.. A tunable ratiometric pH sensor based on carbon nanodots for the quantitative measurement of the intracellular pH of whole cells[J]. Angew. Chem., 2012, 124: 6538-6541. doi: 10.1002/ange.201202533
Urano Y., Asanuma D., Hama Y.. Selective molecular imaging of viable cancer cells with pH-activatable fluorescence probes[J]. Nat. Med., 2009, 15: 104-109. doi: 10.1038/nm.1854
Ma L.J., Cao W., Liu J.. A highly selective and sensitive fluorescence dualresponsive pH probe in water[J]. Sens. Actuators B, 2012, 169: 243-247. doi: 10.1016/j.snb.2012.04.076
Lv H.S., Liu J., Zhao J.. Highly selective and sensitive pH-responsive fluorescent probe in living Hela and HUVEC cells[J]. Sens. Actuators B, 2013, 177: 956-963. doi: 10.1016/j.snb.2012.12.014
Deng M., Yang C.D., Gong D.Y.. BODIPY-derived piperazidine fluorescent near-neutral pH indicator and its bioimaging[J]. Sens. Actuators B, 2016, 232: 492-498. doi: 10.1016/j.snb.2016.04.003
He L., Lin W., Xu Q., Wei H.. A unique type of pyrrole-based cyanine fluorophores with turn-on and ratiometric fluorescence signals at different pH regions for sensing pH in enzymes and living cells[J]. ACS Appl. Mater. Interfaces, 2014, 6: 22326-22333. doi: 10.1021/am506322h
Sun C.L., Wang P., Li L.S.. A new near-infrared neutral pH fluorescent probe for monitoring minor pH changes and its application in imaging of HepG2 cells[J]. Appl. Biochem. Biotechnol., 2014, 172: 1036-1044. doi: 10.1007/s12010-013-0573-8
Li X.H., Gao X.H., Shi W.. Design strategies for water-soluble small molecular chromogenic and fluorogenic probes[J]. Chem. Rev., 2014, 114: 590-659. doi: 10.1021/cr300508p
Zhao X.X., Ge D., Dai X.. A water-soluble pH fluorescence probe based on quaternary ammonium salt for bioanalytical applications[J]. Spectrochim. Acta Part A, 2015, 151: 218-224. doi: 10.1016/j.saa.2015.06.111
Lee M.H., Park N., Yi C.. Mitochondria-immobilized pH-sensitive off-on fluorescent probe[J]. J. Am. Chem. Soc., 2014, 136: 14136-14142. doi: 10.1021/ja506301n
Mo R., Sun Q., Xue J.W.. Multistage pH-responsive liposomes for mitochondrial-targeted anticancer drug delivery[J]. Adv. Mater., 2012, 24: 3659-3665. doi: 10.1002/adma.v24.27
Yu L., Wang Q.L., Li T.T., Chen L.G.. Preparation of a pH-sensitive polystyrene fluorescent microsphere based on a cyanine dye[J]. J. Chem. Res., 2012, 36: 632-634. doi: 10.3184/174751912X13466874476971
Zhao X., Li Y., Jin D.. A near-infrared multifunctional fluorescent probe with an inherent tumor-targeting property for bioimaging[J]. Chem. Commun., 2015, 51: 11721-11724. doi: 10.1039/C5CC03878B
Briggs M.S., Burns D.D., Cooper M.E.. A pH sensitive fluorescent cyanine dye for biological applications[J]. Chem. Commun, 2000, : 2323-2324.
Darjee S.M., Bhatt K.D., Panchal U.S.. Scrupulous recognition of biologically important acids by fluorescent turn off-on" mechanism of thaicalix reduced silver nanoparticles[J]. Chin. Chem. Lett., 2017, 28: 312-318. doi: 10.1016/j.cclet.2016.07.026
Hong M.M., Liu A.F., Xu Y.. Synthesis and properties of three novel rhodamine-based fluorescent sensors for Hg2+[J]. Chin. Chem. Lett., 2016, 27: 989-992. doi: 10.1016/j.cclet.2016.03.027
Luo Q.J., Li Y.X., Zhan M.Q.. A highly sensitive, dual-signal assay based on rhodamine B covered silver nanoparticles for carbamate pesticides[J]. Chin. Chem. Lett., 2017, 28: 345-349. doi: 10.1016/j.cclet.2016.10.024
Niu W.F., Nan M., Fan L.. A novel pH fluorescent probe based on indocyanine for imaging of living cells[J]. Dyes Pigm., 2016, 126: 224-231. doi: 10.1016/j.dyepig.2015.11.027

Figure 1 (a) UV-vis spectra of probe 8 upon pH change in ethanol-water (2/8, v/v) solution. pH 2.41, 2.93, 3.37, 3.76, 4.01, 4.42, 4.60, 5.19, 5.39, 6.23, 6.53, 6.85, 7.00, 7.55, 8.79, 9.73, 11.23. Inset: visual color changes upon pH. (b) The fluorescence spectra of probe 8 upon pH change in ethanol-water (2/8, v/v) solution. pH 2.41, 2.93, 3.37, 3.76, 4.01, 4.42, 4.60, 5.19, 5.39, 6.23, 6.53, 6.85, 7.00, 7.55, 8.79, 9.73, 11.23. (c) UV-vis spectra of probe 9 upon pH change in ethanol-water (2/8, v/v). pH 2.35, 2.89, 3.31, 3.61, 3.99, 4.27, 4.43, 4.77, 5.13, 5.43, 6.25, 6.63, 6.86, 7.05, 7.69, 8.86, 9.70, 11.11. Inset: visual color changes upon pH. (d) The fluorescence spectra of probe 9 upon pH change in ethanol-water (2/8, v/ v) solution. pH 2.35, 2.89, 3.31, 3.61, 3.99, 4.27, 4.43, 4.77, 5.13, 5.43, 6.25, 6.63, 6.86, 7.05, 7.69, 8.86, 9.70, 11.11.

Figure 2 The relationship between I/Imax and pH of probes 8 and 9 (a, and b). I was measured fluorescent intensity at that pH, and Imax was the maximum output of the probes.

Figure 3 (a) Reversible changes of the absorption spectra of probe 8 between pH 8.96 and 3.02. (b) Reversible fluorescent switching of probe 8 upon pH fluctuation between pH 8.96 and 3.02. (c) Reversible changes of the absorption spectra of probe 9 between pH 8.96 and 3.01. (b) Reversible fluorescent switching of probe 9 upon pH fluctuation between pH 8.96 and 3.01.

Figure 4 (a) Time-dependent changes of the fluorescence spectra of probe 8 at pH=4.01 over 60min. (b) Time-dependent changes of fluorescence intensity at λem=815nm of probe 8 at pH=4.01 over 60min. (c) Time-dependent changes of the fluorescence spectra of probe 9 at pH=4.01 over 60min. (d) Time-dependent changes of fluorescence intensity at λem=810nm of probe 9 at pH=4.01 over 60min.

Figure 5 The fluorescence intensity at (a) λem=815 nm of probe 8 (1.0 × 10⁻⁵ mol/L) and (b) λem=810 nm of probe 9 (1.0 × 10⁻⁵mol/L) at pH=4.01 in ethanol-water (2/8, v/v) solution upon addition of different interferents (1.0 × 10⁻⁴ mol/L).1, probe; 2, Na+; 3, K+; 4, Mg2+; 5, Zn2+; 6, Cu2+; 7, Ca2+; 8, Mn2+; 9, Co2+; 10, Ni2+; 11, GSH; 12, Cys; 13, Gly; 14, Trp; 15, His; 16, Arg; 17, H2O2.

Figure 6 The 1HNMRspectraof(a)probe8(14.4 μmol), (b)probe8-TFA(2:1, mol/mol), (c) probe 8 -TFA (1:1, mol/mol) in CDCl3.

 扫一扫看文章

扫一扫关注我们
 下载:
下载:

 下载:
下载:


 下载:
下载: