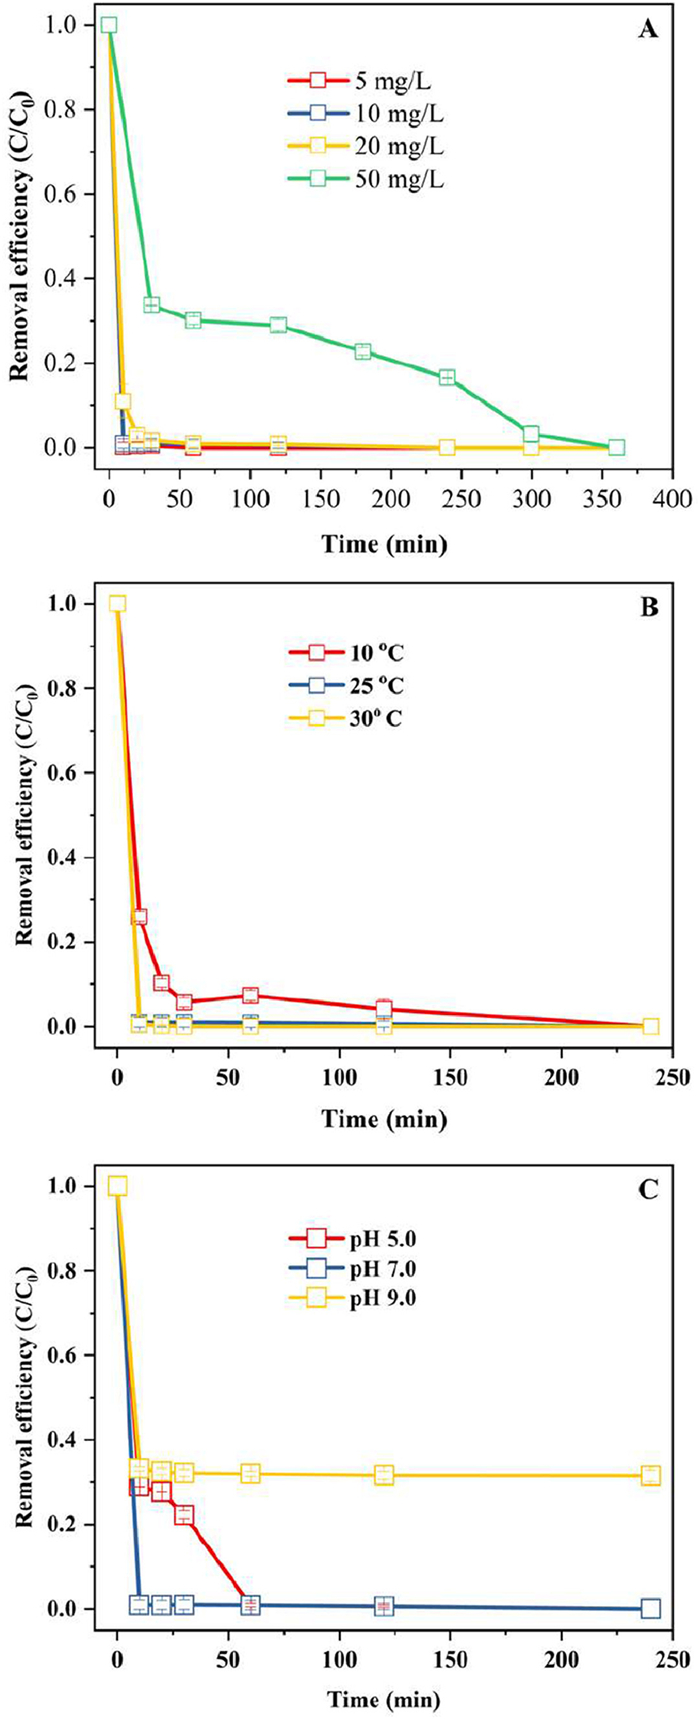
Figure 1.
The phenol degradation characteristics by Chryseobacterium sp. under different conditions: (A) phenol initial concentration, (B) temperature, (C) solution pH.

Treatment of high salinity wastewater by Chryseobacterium sp. coupled to ionizing irradiation technology
Xiaoyong Shu , Shizong Wang , Jianlong Wang , Qi Zhou , Yong Liu , Yongxia Sun


Treatment of industrial wastewater is important for the environmental protection and sustainable development of industries. In general, biological treatment is the core process for the industrial wastewater treatment [1]. Its performance directly affected the quality of final effluents, although advanced treatment process has been used after biological treatment process [2]. Biological treatment process has the advantages of easy operation, good treatment effect and low treatment cost [3]. But its performance is easily affected by environmental conditions such as temperature and wastewater component such as heavy metals. It is well known that the salinity such as chloride ions and sulfate ions could inhibit the microbial activity [4–6]. Thus, the treatment of salinity wastewater has been always a tough problem.
To increase the tolerance of microorganisms to salinity could be a way to increase the performance of biological treatment process in the treatment of saline wastewater, which could be realized by microbial acclimation to enrich the halotolerant bacteria in the biological treatment system [7,8]. To now, several halotolerant bacteria and microbial consortium have been reported in the previous studies such as Aureobasidium sp. MSP8 [9], Rhodococcus erythropolis PTCC 1767 [10], Pseudomonas mendocina TJPU04 and microbial consortium with Halomonas genus [11]. These bacteria have different properties such as salt-tolerant degree and degradation characteristics for organic pollutants. For instance, Rhodococcus erythropolis PTCC 1767 could tolerate up to 60 g/L NaCl and have high activity for the removal of hydrocarbons [10], while microbial consortium with Halomonas genus could tolerate up to 20 g/L NaCl and degrade the organic pollutants with the azo bond [11]. It is thus concluded that for specific wastewater, acclimation of salt-tolerant bacteria is an effective method to enhance the removal of organic pollutants in saline wastewater.
Coking wastewater has the characteristics of huge amount and complex water component [12,13]. To increase the reusability of coking wastewater, reverse osmose (RO) membrane is usually adopted in the process of wastewater treatment that resulted in the production of reverse osmosis concentrated wastewater (ROCW) containing high salinity and organic pollutant [14–16]. The high salinity would strongly inhibit the effect of advanced oxidation processes on the removal of organic pollutants [17,18]. Thus, advanced oxidation processes were not widely used for the treatment of RO concentrated wastewater. Instead, mechanical steam recompression is the common method for the treatment of ROCW in practice [19], but its operation cost is high. Furthermore, the salt after mechanical steam recompression is hard to be recycled due to the existence of organic pollutants [20]. It is thus necessary to remove the organic pollutants in the high salinity wastewater. Considering the effect of high salinity on the chemical oxidation technology, the removal of organic pollutants in the high salinity wastewater using halotolerant bacteria could be an option.
It is noted that the halotolerant bacteria are hard to further remove organic pollutants due to the bioavailability when the concentration of organic pollutants decreased to certain extent [21], although they can resist the inhibition of high salinity.
Recent studies have highlighted that coupling biological methods with advanced oxidation processes (AOPs) offers a promising strategy for saline wastewater treatment. For example, Cai et al. reported that applying AOPs prior to biological treatment significantly enhanced the removal of organic matter in reverse osmosis concentrate [22]. Similarly, Chaturvedi et al. summarized research on the treatment of high-salinity wastewater using such combined approaches [23]. These studies primarily focus on improving the biodegradability of saline effluents through AOPs, followed by further removal using biological processes. However, the inherent drawbacks of AOPs in high-salinity conditions, such as low efficiency and high energy consumption, still remain unavoidable.
Ionizing irradiation is an emerging advanced oxidation process that has been applied for the treatment of actual wastewater such as dyeing wastewater and medical wastewater [24,25]. Compared to the conventional advanced oxidation process, it has own advantages such as no need for chemical addition and high treatment efficiency [26]. Our study has demonstrated that ionizing irradiation has higher resistance to salinity than conventional advanced oxidation process [27]. It is thus speculated that the treatment of halotolerant bacteria followed by ionizing irradiation could effectively remove the organic pollutants in the high salinity wastewater.
Therein, Chryseobacterium sp. were isolated and significantly enriched. Chryseobacterium species are predominantly found in soil and water environments. It was reported that these organisms can survive in chlorine-treated municipal water supplies, often colonizing sink basins and taps [28].
Therefore, the aim of this study is to isolate the halotolerant bacteria and investigate its performance in the removal of organic pollutants in the high salinity wastewater, to verify the performance of Chryseobacterium sp. coupled with ionizing irradiation in the treatment of high salinity wastewater finally.
The Shanghai Aladdin Biochemical Technology Co., Ltd. provided the following chemicals: phenol (≥ 99.5%), benzoic acid (99.0%), p-cresol (99.0%), indole (99.0%), sodium chloride (≥ 99.0%), tryptone (reagent grade) and yeast extract. The RO concentrate was obtained from a coking plant located in Hebei, China. The basic characteristics of RO concentrate was as follows: COD 296.9 mg/L, solution pH 6.4, total organic carbon 72.4 mg/L, chloride ions 2.06 g/L and conductivity 16,613 μS/cm.
The Chryseobacterium sp. was isolated from the biological process unity of the coking plant located in Hebei, China and identified according to the analysis of 16S rDNA gene sequence. The PCR amplication primers used in this study were 27F (5-AGAGTTTGATCCTGGCTCAG-3) and 1492R (5-CTACGGCTACCTTGTTACGA-3). The identified procedure was presented in the previous studies [29,30]. The strain has been registered in NCBI Genbank with accession number Genbank OR827197.
To enrich the Chryseobacterium sp., Chryseobacterium sp. was inoculated in the sterilized LB medium that includes 10 g/L tryptone, 5 g/L yeast extract and 10 g/L and 10 g/L sodium chloride. The cultures were incubated at pH 7.0 and 25 ℃. For the biodegradation experiments, exponentially growing cells were harvested by centrifugation (8000 rpm for 10 min) and subsequently washed with phosphate buffer (0.1 mol/L) piror to use.
The degradation experiments of the selected organic pollutants that were commonly found in the coking wastewater by Chryseobacterium sp. were conducted. Specifically, 200 mL solution with 10 mg/L of the selected organic pollutant was poured into 250-mL glass bottle. Then quantified Chryseobacterium sp. pellet was added into the solution to make the initial OD600 0.2. The glass bottles were placed into thermostat water bath at 25 ℃. To elucidate the contribution of biosorption to the degradation of organic pollutants, the control experiments were conducted with sterilized Chryseobacterium sp. (121 ℃ for 30 min) to determine the role of biosorption. To verify the role of different functional groups in the degradation of organic pollutants, the following experiments were conducted. The Chryseobacterium sp. pellet was treated by anhydrous methanol and hydrochloric acid for 3 h to initiate the carboxyl esterification for determining the role of carboxyl groups. The Chryseobacterium sp. pellet was treated by acetic anhydride/ethanol for 2 h to initiate the aminoacetylation for determining the role of amino group. The Chryseobacterium sp. pellet was treated by triethyl phosphate/nitromethane solution for 3 h to initiate phosphorus esterification for elucidating the role of phosphate group. The Chryseobacterium sp. pellet was treated by proteinase K for identifying the role of proteins. All the experiments were conducted in duplicate.
For the treatment of RO concentrate, the quantified Chryseobacterium sp. pellets were harvested and added into the glass bottle containing 100 mL RO concentrate to make the initial OD600 3.0. The glass bottle was placed into a thermostat water bath for 8 h. Thereafter, the COD of RO concentrate was determined. The RO concentrate after biological treatment was centrifuged at 8000 rpm, and the supernatant was collected for ionizing irradiation treatment. Specifically, 40 mL of supernatant was transferred into 50 mL centrifuge tubes and placed in a 60Co irradiation chamber located in Tsinghua University, China. The irradiation dose rate was 24 kGy/h, and the applied absorbed doses were 10, 20, and 30 kGy. The corresponding irradiation times were calculated by dividing the target dose by the dose rate. The COD concentration of treated supernatant was determined after ionizing irradiation. In comparison, the treatment of RO concentrate by single ionizing irradiation was also investigated. It is noted that compared to that in synthetic wastewater (OD600 = 0.2), this higher biomass requirement was due to the complex composition of RO concentrate, including high salinity and refractory organics, which exert stronger inhibitory effects on microbial activity.
The concentration of the selected organic pollutants including phenol, p-cresol and indole was determined by high-performance liquid chromatography (HPLC). The detailed conditions have been reported in our previous studies [31,32]. The COD was measured using potassium dichromate method.
To identify the DEGs between the two different samples (i.e., A1 and A3 bio-samples), the expression levels for each gene were calculated using the fragments per kilobase of exon per million mapped reads (FRKM) method. R statistical package edgeR was used for differential expression analysis. Therein, Volcano-plot of the differentially expressed genes between A1 and A3 bio-samples The DEGs between the two samples were selected using the following criteria: The logarithmic of fold change was greater than 2, and the false discovery rate (FDR) was less than 0.05. To understand the functions of differentially expressed genes, Gene Ontology (GO) functional enrichment and Kyoto Encyclopedia of Genes and Genomes (KEGG) pathway analysis were carried out by Goatools (
The phenol was selected to investigate the degradaiton chacteristics of Chryseobacterium sp. When its initial concentraiton ranged from 5 to 20 mg/L, more than 90% phenol was removed within 10 min. The degradation rate decreased with the increase of phenol initial concentration. The initial removal efficiency significantly decreased to 66.4% at 10 min when the phenol initial concentration was 50 mg/L. Thereafter, a slow degradation phase was observed. However, the phenol removal efficiency achieved 100% at the end under all the cases (Fig. 1A), indicating that Chryseobacterium sp. could effectively remove phenol.
Temperature had significant effect on the activity of Chryseobacterium sp. The degradation rate increased with the increase of temperature from 10 ℃ to 30 ℃ (Fig. 1B). Nevertheless, the phenol was completely removed at 240 min no matter what the temperature was, suggesting that Chryseobacterium sp. had a relatively wide temperature adaptation range.
The solution pH had obvious effect on the activity of Chryseobacterium sp. (Fig. 1C). At neutral condition, the phenol was completely removed at 10 min. When the solution pH was 5.0, the initial degradation rate of phenol became slower. Its removal efficiency decreased to 71.1% at 10 min, but it was still completely degraded at 60 min. When the solution pH was 9.0. Its removal efficiency further decreased to 66.9%. Thereafter, it remained almost unchanged, suggesting that the activity of Chryseobacterium sp. was inhibited at alkali conditions.
In addition to phenol, other organic pollutants including p-cresol, indole and benzoic acid were also selected to conduct the degradation experiments. The removal efficiency of p-cresol reached 84.2% at 10 min that was slightly lower than phenol degradation. After 10 min, the p-cresol concentration gradually decreased. At the end the p-cresol was completely removed (Fig. 2A). The similar degradation trend was found for benzoic acid, but the initial degradation rate of benzoic acid was lower than p-cresol. In comparison with p-cresol and benzoic acid, Chryseobacterium sp. showed much lower degradation activity for indole. The degradation of indole mainly occurred at 10 min when 24.7% of indole was removed. Thereafter, the indole removal efficiency gradually increased until the end in which 40.1% of indole was depleted. The removal efficiency of indole remained almost unchanged from 120 min to 240 min. For phenol, p-cresol and benzoic acid, all of them had one benzene ring. All of them were eventually removed, although the degradation rate varied. While indole has a dual-ring structure, in addition to benzene ring, it has a pyrrole ring. By comparison, it can be concluded that Chryseobacterium sp. had high activity for benzene ring and low activity for pyrrole ring.
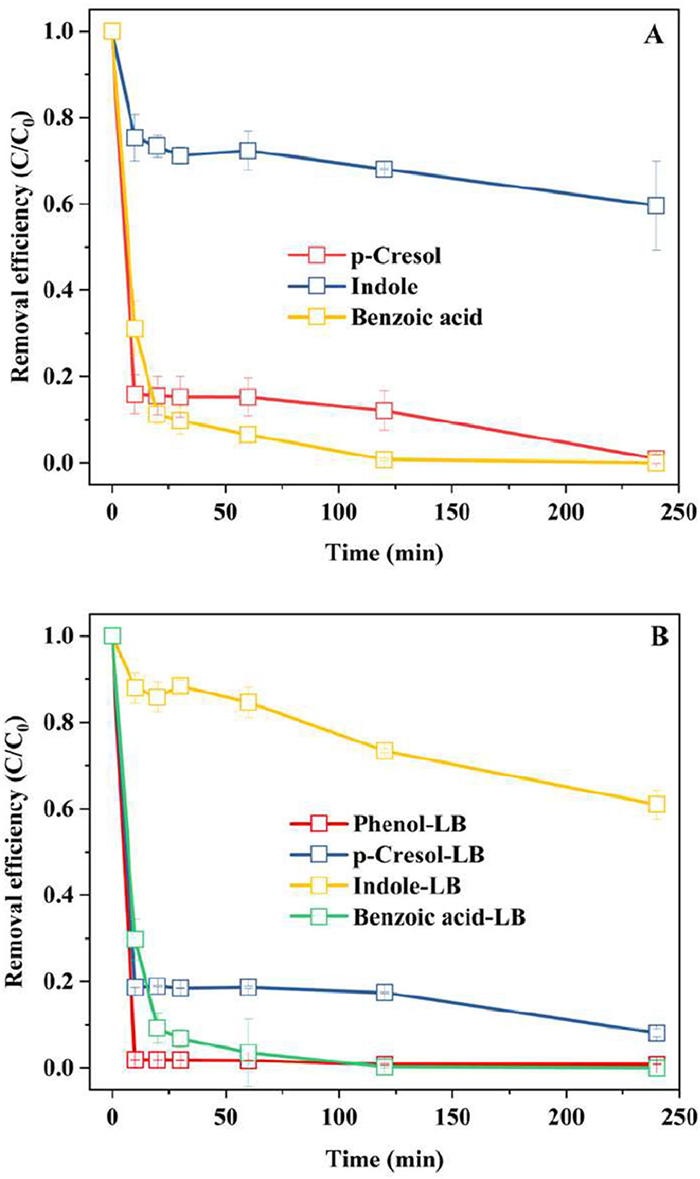
To check whether Chryseobacterium sp. could degrade indole by co-metabolism, the degradation experiments of the selected organic pollutants in the presence of carbon source were conducted. For phenol, p-cresol and benzoic acid, the carbon source had no significant effect on the degradation kinetics and removal efficiency (Fig. 2B). But for indole, the addition of carbon source decreased the removal efficiency, suggesting that Chryseobacterium sp. preferred carbon source to indole. This also demonstrated that Chryseobacterium sp. cannot degrade indole by co-metabolism.
Chloride ions and sulfate ions are the main constituents of high salinity. Thus, their effect on the phenol degradation was investigated. The presence of chloride ions inhibited the phenol removal. In the presence of chloride ions, the phenol degradation could be divided into two phases: slow degradation phase and fast degradation phase. The increase of chloride ions' concentration significantly decreased the removal efficiency of phenol at 360 min. The final removal efficiency of phenol was 100%, 94.8%, 71.2% and 63.3%, respectively, when the initial concentration of chloride ions was 1, 5, 10 and 20 g/L (Fig. 3A). It is noted that the removal efficiency of phenol (~50%) was almost the same at 30 min no matter what the initial concentration of chloride ion was, suggesting the biosorption may be the initial step for biological removal of phenol. In addition, the degradation kinetics presented obvious difference with the change of chloride ions' concentration. When the initial concentration of chloride ions was 1 g/L, the slow degradation phase lasted for 120 min, it extended to 300 min when the initial concentration of chloride ion was 5 g/L. When the initial concentration of chloride ions was 10 and 20 g/L, only slow degradation was found during the experimental process, indicating that the increased inhibition along with the increase of chloride ions' concentration. It is noted that although the chloride ions inhibited the activity of Chryseobacterium sp., the phenol degradation did not cease even in the presence of 20 g/L, suggesting that the extension of reaction time or the increase of biomass could still remove phenol completely.
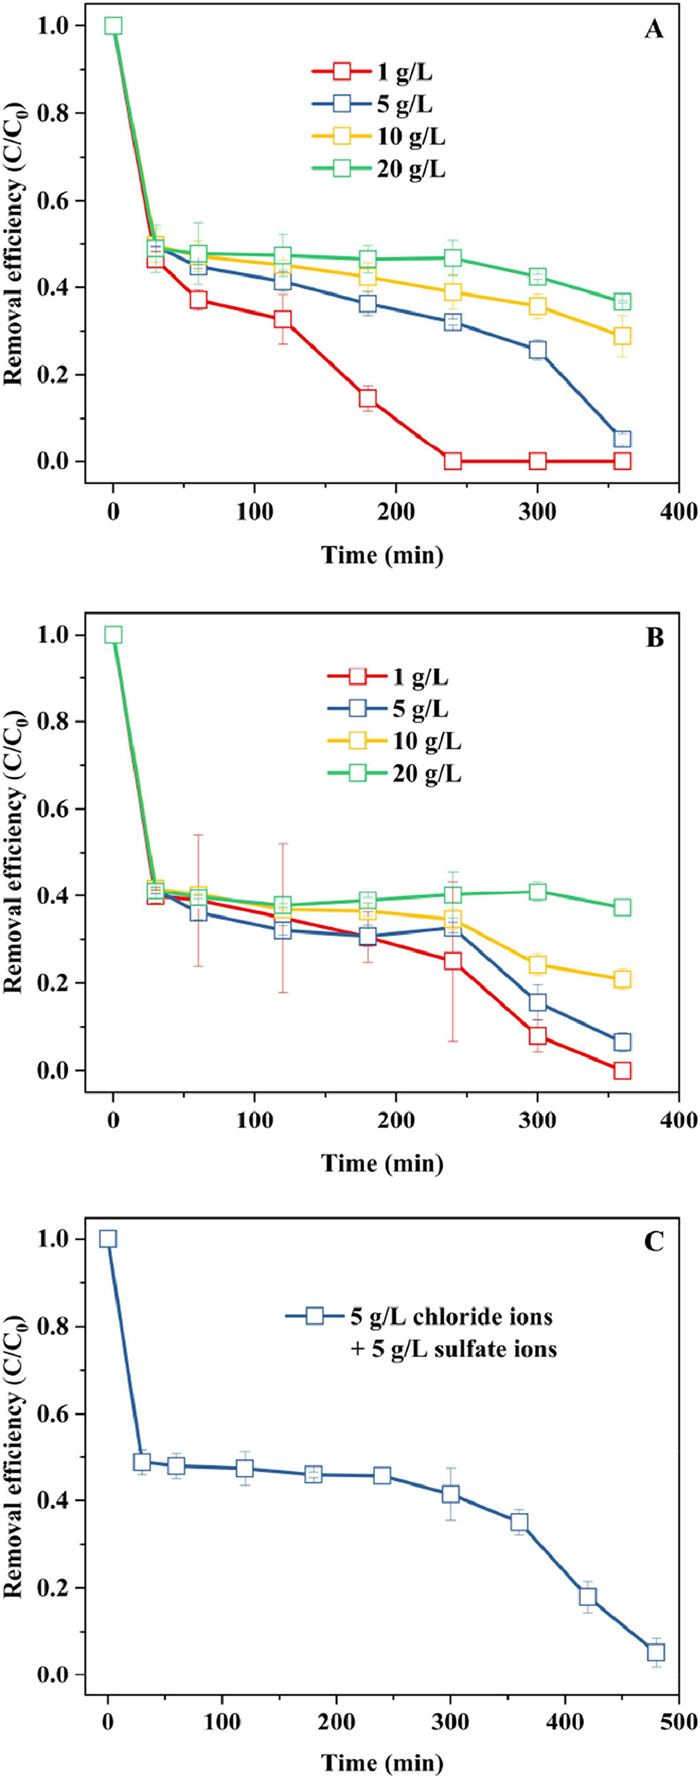
In line with chloride ions, sulfate ions showed similar effect on the removal of phenol. The initial removal efficiency of phenol at 30 min achieved about 60% no matter what the initial concentration of sulfate ions was (Fig. 3B). After 30 min, the phenol degradation proceeded along with the time. The inhibition degree increased with the concentration of sulfate ions as evidenced by the time of slow degradation phase. At 360 min, the removal efficiency of phenol was 100%, 93.7%, 79.2% and 62.8%, respectively when the initial concentration of sulfate ions was 1, 5, 10 and 20 g/L.
When the chloride ions and sulfate ions co-existed, the removal efficiency of phenol reached about 50% at 30 min (Fig. 3C). Thereafter, the phenol degradation entered a slow degradation phase until 360 min. After 360 min, the fast degradation phase was found. At 480 min, the phenol removal efficiency achieved 94.7%. Compared with the presence of individual chloride or sulfate ions, the co-existence of both ions exhibited a stronger inhibitory effect. But the inhibition could be counteracted by extending the reaction time, indicating that Chryseobacterium sp. had high resistance to high salinity.
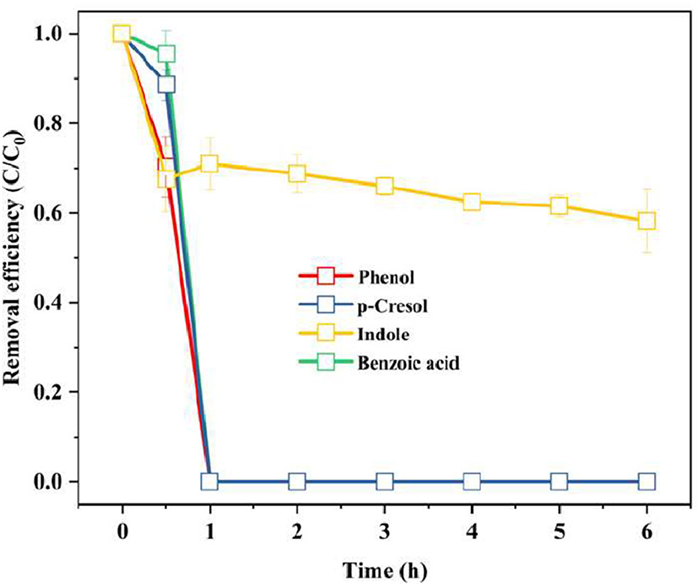
To investigate the effect of actual wastewater components on the activity of Chryseobacterium sp., the selected organic pollutants were added into the actual RO concentrate. It was found that compared to that in the deionized water, the removal efficiencies of phenol, p-cresol and benzoic acid were significantly depressed at 30 min (Fig. 4), which could be due to the competition of bacterial surface functional groups between wastewater components and the selected organic pollutants. But the phenol, p-cresol and benzoic acid could be completely removed at 1 h. Moreover, for p-cresol and benzoic acid, the removal rates in the RO concentrate were even higher than that in the deionized water, which could be due to the promoted growth of Chryseobacterium sp. by some bioavailable organic pollutants. For indole, there was no obvious difference for its degradation in the actual RO concentrate compared to that in the deionized water. The above results demonstrated that the wastewater components had some negative effect on the activity of Chryseobacterium sp. at first. However, Chryseobacterium sp. could quickly overcome the inhibition. It was reported that other phenol-degrading bacteria, including Rhodococcus ruber, Alcaligenes faecalis, Rhodotorula sp. and Ralstonia taiwanensis, were significantly inhibited when exposed to high-salt stress [33]. Thus, it was concluded that Chryseobacterium sp. have strong salt-tolerant capabilities with high phenol degradation efficiency.
Chryseobacterium sp. was firstly sterilized to investigate the role of biosorption in the phenol removal. The phenol removal efficiency achieved 77% at 30 min, indicating that biosorption made important contribution to the phenol removal (Fig. 5A). To investigate the role of functional groups in the biosorption, four control experiments were conducted. It was found that the phenol removal efficiency decreased to 53.8% when the phosphoric groups were inhibited, while it decreased to 50.1% when the protein was inhibited. It decreased to 42.9% and 42%, respectively as the carboxyl groups and ammino groups were inhibited, indicating the surface functional groups played important role in the biosorption of phenol, and the order was as follows: Carboxyl groups ≈ ammino groups > protein > phosphoric groups.
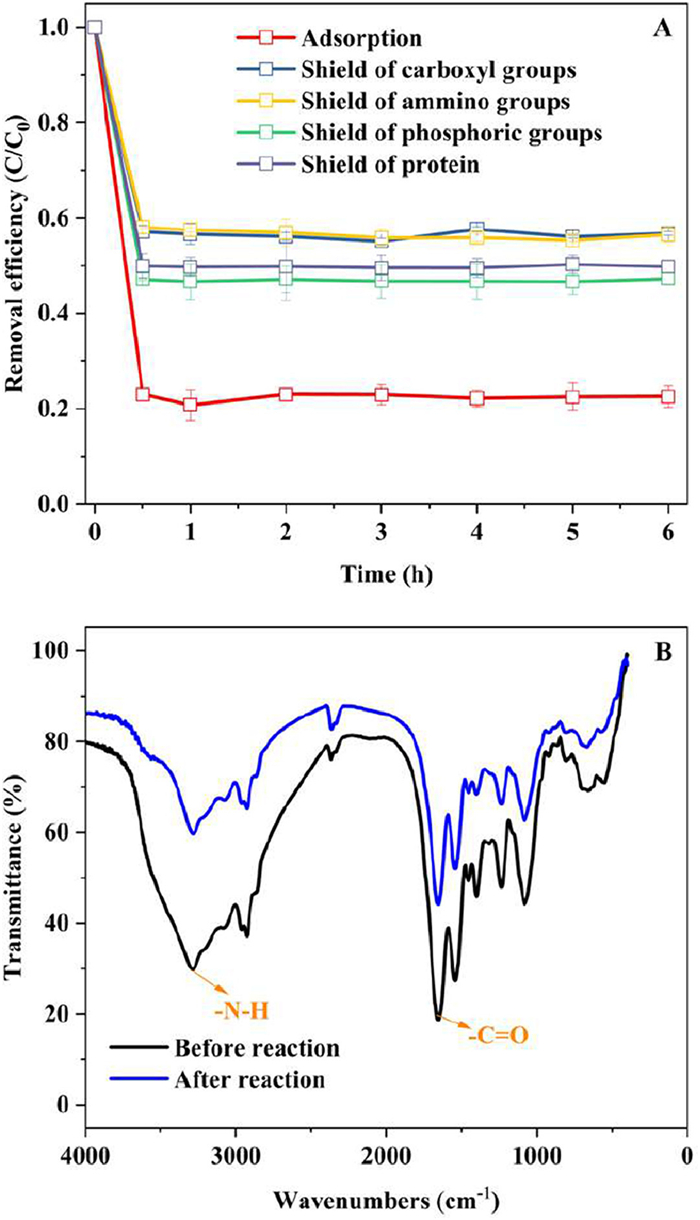
To further verify the removal mechanism of Chryseobacterium sp. for phenol, the pellet of Chryseobacterium sp. before and after reaction was characterized by FTIR. The characteristic peaks of -N-H, -C=O and PO43- were found (Fig. 5B) [34,35]. Moreover, there were no big changes of these functional groups before and after reaction, further suggesting that the phenol removal was not due to the biosorption, but the degradation.
For the unsterilized Chryseobacterium sp., the phenol could be completely removed, suggesting that Chryseobacterium sp. could degrade phenol in addition to biosorption. In addition, at the end of the experiments, the OD600 increased from 0.2 to 0.37, further proving that Chryseobacterium sp. could use phenol as carbon source for growth. Based on the above analysis, it is concluded that Chryseobacterium sp. remove phenol mainly via metabolism.
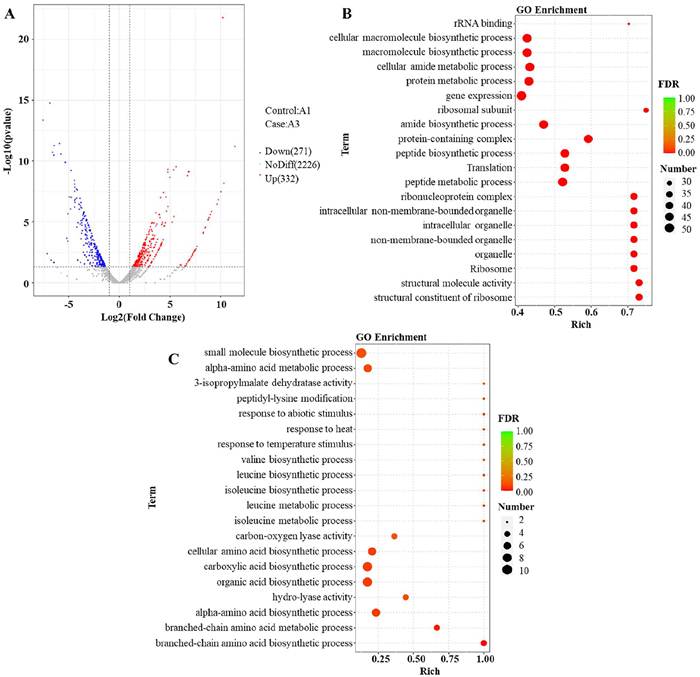
The salt-tolerant mechanism of Chryseobacterium sp. was analyzed via transcriptome analysis. As shown in Fig. 6A, transcriptome analysis shown a total of 603 genes were identified as differential expression genes (DEGs) for the A3 group (5 g/L Cl- + 5 g/L SO42-), when compared with the A1 control group (fold change (FC) ≥ ± 2, P < 0.05), which preliminarily showed that salinity affected the genes expression. Among these DEGs, 332 were up-regulated and 271 were down-regulated (Fig. 6A). To better understand the functions of the DEGs, we performed a GO enrichment analysis for the up-regulated and down-regulated DEGs, respectively. As shown in Fig. 6B, the most annotated GO terms for up-regulated DEGs were structural constituent of ribosome (molecular function, MF), structural molecule activity (molecular function, MF), ribosome (cellular component, CC), organelle (cellular component, CC), involved to rplM, rpsI, rpsB, rpmF, rpsU and rplK genes. These up-regulated genes are related to ribosome synthesis, which was positively correlated with the protein synthesis [36]. It was speculated that the addition of Cl- promoted the synthesis of salt-tolerant protein/enzymes. As shown in Fig. 6C, the most annotated GO terms for down-regulated DEGs were branched-chain amino acid biosynthetic process, branched-chain amino acid metabolic process, alpha-amino acid biosynthetic process, all belong to the biological process, (BP), involved to leuD, leuC, ilvC and ilvD genes. These down-regulated genes are related to biosynthetic and metabolic of branched-chain amino acid (BCAA). The BACC, called as essential amino acids, included l-valine, l-isoleucine, and l-leucine, which mainly ensure nutrition supply to maintain growth and survival of microorganisms [37]. In general, Chryseobacterium sp. may promote the formation of salt-tolerant protein/enzymes via decreasing the synthesis of essential amino acids, which endowed them with the tolerance capacity for salinity.
The Chryseobacterium sp. was used to treat the actual RO concentrate. During the process of biological treatment, the COD concentration decreased with time. The COD removal efficiency achieved 57.8% at 12 h (Fig. 7A).
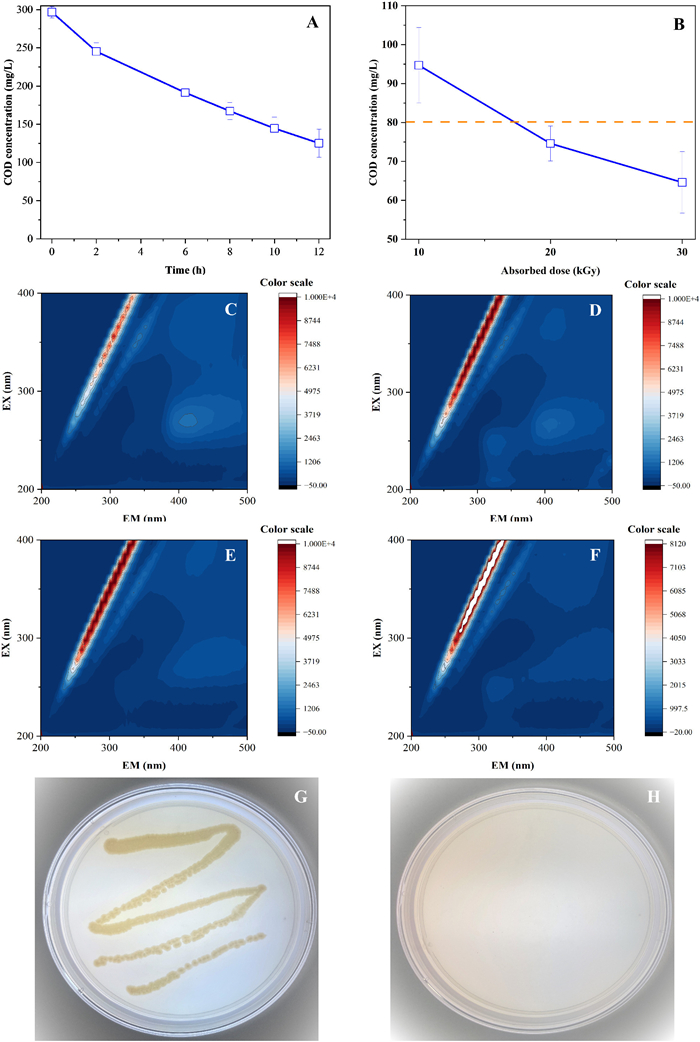
Ionizing irradiation is an emerging advanced oxidation technology. Its primary mechanism involves the generation of reactive species from water molecules, which interact with organic pollutants to facilitate their removal [26,27,38]. In aqueous systems, reductive species are rapidly converted to oxidative species by dissolved oxygen, making oxidative species the predominant agents in wastewater treatment. In this study, ionizing irradiation was employed to treat effluent from the biological treatment process. The COD removal efficiency further increased with the increase of absorbed dose. It reached 68.1%, 74.8% and 78.3%, respectively, when the absorbed dose was 10, 20 and 30 kGy (Fig. 7B). When the absorbed dose was higher than 20 kGy, the COD concentration of effluents was lower than 80 mg/L. The EEM analysis of the effluents was further employed to investigate the variation of wastewater components after treatment. The EEM spectrum is commonly divided into five regions: Region Ⅰ (EM: 200–325 nm; EX: 200–250 nm), representing aromatic proteins containing tryptophan; Region Ⅱ (EM: 325–375 nm; EX: 200–250 nm), corresponding to aromatic proteins with tyrosine; Region Ⅲ (EM: 375–500 nm; EX: 200–250 nm), associated with fulvic acid-like substances; Region Ⅳ (EM: 200–375 nm; EX: 250–350 nm), indicative of soluble microbial by-products; and Region Ⅴ (EM: 375–500 nm; EX: 250–400 nm), reflecting humic acid-related compounds [39]. After the treatment of Chryseobacterium sp., the fluorescence intensity of humic acid decreased. In comparison, the fluorescence intensity of soluble microbial by-products and aromatic protein containing tryptophan increased (Figs. 7C and D), suggesting the transformation of RO concentrate components during the biological treatment process. After the treatment of ionizing irradiation (10 kGy), the fluorescence intensity of humic acid and aromatic protein containing tryptophan decreased compared to that treated by biological treatment (Fig. 7E). The increase of absorbed dose resulted in the occurrence of aromatic proteins with tyrosine (Fig. 7F), confirming the transformation of RO concentration components during the process of ionizing irradiation. These results were consistent with the change of COD. It is thus concluded that the Chryseobacterium sp. coupled with ionizing irradiation showed good performance in the treatment of RO concentrate. In addition, the bacterial community was found in the solid media when the RO concentrate treated by Chryseobacterium sp. was used as inoculum (Fig. 7G), while no bacteria was observed in the solid media when the RO concentrate treated by Chryseobacterium sp. coupled to ionizing irradiation was used as inoculum (Fig. 7H), indicating that the ionizing irradiation followed by biological treatment could kill the Chryseobacterium sp. for guaranteeing the biological safety.
In addition, compared with previous studies where advanced oxidation processes were applied prior to biological treatment in order to enhance wastewater biodegradability, the present work proposes the reverse sequence by employing halotolerant biodegradation followed by ionizing irradiation. This arrangement enables both processes take advantage of their respective advantages: The biological step selectively degrades and transforms organic pollutants under saline conditions, while the subsequent irradiation further eliminates refractory organics and simultaneously ensures biosafety through complete microbial inactivation. Such a coupled strategy therefore offers superior pollutant removal efficiency and operational safety compared with conventional AOP-first approaches.
A salinity-tolerant Chryseobacterium sp. capable of metabolically degrading phenol, p-cresol, indole, and benzoic acid was isolated from RO concentrate. Transcriptomic analysis revealed that its high salt resistance was associated with the synthesis of salt-tolerant proteins and enzymes. Although elevated chloride and sulfate concentrations reduced the phenol removal rate, complete degradation was still achieved. Coupling this halotolerant biodegradation with ionizing irradiation significantly enhanced COD removal (up to 78.3%) and ensured effluent biosafety, offering an efficient and practical strategy for high-salinity RO concentrate treatment.
The authors declare that they have no known competing financial interests or personal relationships that could have appeared to influence the work reported in this paper.
Xiaoyong Shu: Investigation. Shizong Wang: Writing – original draft, Supervision, Formal analysis, Conceptualization. Jianlong Wang: Writing – review & editing, Supervision, Funding acquisition, Conceptualization. Qi Zhou: Formal analysis. Yong Liu: Writing – review & editing, Supervision. Yongxia Sun: Writing – review & editing.
This research was supported by the National Key R&D Program of China (No. 2024YFE0101700).
A. Robles, A. Jiménez-Benítez, J.B. Giménez, et al., Water Res. 215 (2022) 118249. doi: 10.1016/j.watres.2022.118249
S.J. Zhang, H.C. Zheng, P.G. Tratnyek, Nat. Water 1 (2023) 666–681. doi: 10.1038/s44221-023-00098-1
J.G. Li, M.B. Feng, S.K. Zheng, et al., Chem. Eng. J. 460 (2023) 141693. doi: 10.1016/j.cej.2023.141693
G. Xu, X. Zhao, S. Zhao, et al., Isme J. 17 (2023) 660–670. doi: 10.1038/s41396-023-01377-1
R. Khan, S. Shukla, M. Kumar, et al., Chem. Eng. J. 471 (2023) 144495. doi: 10.1016/j.cej.2023.144495
A. Srivastava, V.K. Parida, A. Majumder, et al., J. Environ. Chem. Eng. 9 (2021) 105775. doi: 10.1016/j.jece.2021.105775
T.N.D. Cao, X.T. Bui, L.T. Le, et al., Bioresour. Technol. 363 (2022) 127831. doi: 10.1016/j.biortech.2022.127831
X. Tan, I. Acquah, H. Liu, et al., Chemosphere 220 (2019) 1150–1162. doi: 10.1016/j.chemosphere.2019.01.027
X. Zeng, J.J. Huang, B. Hua, Bioresour. Technol. 334 (2021) 125237. doi: 10.1016/j.biortech.2021.125237
S.M.A. Ojagh, N. Fallah, B. Nasernejad, J. Environ. Chem. Eng. 8 (2020) 104412. doi: 10.1016/j.jece.2020.104412
S. Asad, M.A. Amoozegar, A.A. Pourbabaee, et al., J. Hazard. Mater. 98 (2007) 2082–2088.
M. Tamang, K.K. Paul, Water Sci. Technol. 85 (2022) 449–473. doi: 10.2166/wst.2021.497
Z. Li, T. Wei, J. Pan, et al., J. Hazard. Mater. 447 (2023) 130802. doi: 10.1016/j.jhazmat.2023.130802
L. Wang, X. Sun, F. Gao, et al., Desalination 592 (2024) 118124. doi: 10.1016/j.desal.2024.118124
X. Ke, T. Wei, G. Wei, et al., Chem. Eng. J. 457 (2023) 141257. doi: 10.1016/j.cej.2022.141257
I. Curic, Z. Zgorelec, M. Galic, D. Dolar, Sep. Purif. Technol. 377 (2025) 134324. doi: 10.1016/j.seppur.2025.134324
J. Wang, S. Wang, Chem. Eng. J. 411 (2021) 128392. doi: 10.1016/j.cej.2020.128392
Y. Xue, Z. Wang, R. Naidu, et al., Chem. Eng. J. 433 (2022) 134546. doi: 10.1016/j.cej.2022.134546
S. Yao, J. Hu, D. Shen, J. Water Process. Eng. 60 (2024) 105124. doi: 10.1016/j.jwpe.2024.105124
Y. Li, X. Zhang, Y. Wang, et al., Desalination 505 (2021) 115007. doi: 10.1016/j.desal.2021.115007
H. Cheng, S. Ma, K. Liao, et al., Chem. Eng. J. 466 (2023) 143338. doi: 10.1016/j.cej.2023.143338
Q.Q. Cai, M.Y. Wu, R. Li, et al., Chem. Eng. J. 389 (2020) 123419. doi: 10.1016/j.cej.2019.123419
A. Chaturvedi, B.N. Rai, R.S. Singh, R.P. Jaiswal, Rev. Chem. Eng. 38 (2022) 617–639. doi: 10.1515/revce-2020-0010
S. Wang, J. Wang, J. Clean. Prod. 454 (2024) 142344. doi: 10.1016/j.jclepro.2024.142344
S. Wang, J. Wang, C. Chen, et al., Radiat. Phys. Chem. 196 (2022) 110136. doi: 10.1016/j.radphyschem.2022.110136
S.Z. Wang, J.Z. Wang, Y. Tian, et al., ACS Es&T Eng. 4 (2024) 807–818. doi: 10.1021/acsestengg.3c00471
S.Z. Wang, J. Hu, J.L. Wang, Chem. Eng. J. 505 (2025) 159438. doi: 10.1016/j.cej.2025.159438
H.S. Sader, R.N. Jones, Int. J. Antimicrob. Agents 25 (2005) 95–109. doi: 10.1016/j.ijantimicag.2004.10.002
J. Zhang, H.M. Xin, W.J. Wang, et al., Sci. Rep. 14 (2024) 22111. doi: 10.1038/s41598-024-72793-2
P.C.Y. Woo, S.K.P. Lau, J.L.L. Teng, et al., Clin. Microbiol. Infect. 14 (2008) 908–934. doi: 10.1111/j.1469-0691.2008.02070.x
H. He, S. Wang, J. Wang, Chemosphere 287 (2022) 131983. doi: 10.1016/j.chemosphere.2021.131983
S. Wang, J. Wang, Chem. Eng. J. 456 (2023) 141086. doi: 10.1016/j.cej.2022.141086
S.M. Sun, S. Wang, Y.L. Yin, et al., Water Res. 255 (2024) 121448. doi: 10.1016/j.watres.2024.121448
J.G. Gwon, S.Y. Lee, G.H. Doh, J.H. Kim, J. Appl. Polym. Sci. 116 (2010) 3212–3219. doi: 10.1002/app.31746
N. Thombare, A. Mahto, D. Singh, et al., J. Polym. Environ. 31 (2023) 3372–3380. doi: 10.1007/s10924-023-02821-1
Z. Wang, X. Zhang, C. Liu, et al., Nat. Commun. 15 (2024) 8693. doi: 10.1038/s41467-024-52945-8
Y.F. Liang, Z.X. Long, Y.J. Zhang, et al., Biochimie 184 (2021) 72–87. doi: 10.1016/j.biochi.2021.02.008
X.Y. Liu, J.J. Wang, Chemosphere 351 (2024) 141255. doi: 10.1016/j.chemosphere.2024.141255
W. Chen, P. Westerhoff, J.A. Leenheer, K. Booksh, Environ. Sci. Technol. 37 (2003) 5701–5710. doi: 10.1021/es034354c

Figure 1 The phenol degradation characteristics by Chryseobacterium sp. under different conditions: (A) phenol initial concentration, (B) temperature, (C) solution pH.

Figure 2 Degradation of other organic pollutants by Chryseobacterium sp. in the absence of LB media (A), and in the presence of LB media (B). [p-cresol] = [indole] = [benzoic acid] = [phenol] = 10 mg/L, 25 ℃, pH 7.0.

Figure 3 Effect of chloride ions and sulfate ions on the phenol degradation by Chryseobacterium sp. (A) Chloride ions, (B) sulfate ions, (C) co-existence of chloride ions and sulfate ions. [Phenol] = 10 mg/L, 25 ℃, pH 7.0.

Figure 4 Removal of the selected organic pollutants in the actual RO concentrate. [Phenol] = [p-cresol] = [indole] = [benzoic acid] = 10 mg/L, 25 ℃, pH 7.0.

Figure 5 Removal mechanism of phenol by Chryseobacterium sp. [Phenol] = 10 mg/L, 25 ℃, pH 7.0.

Figure 6 (A) Volcano-plot of the differentially expressed genes between A1 and A3 bio-samples. The abscissa means the logarithm of the multiple difference of the expression of genes in the two samples: The larger the absolute value, the greater the difference in gene expression. The ordinate means the negative logarithm of the statistical significance of the expression of gene: The larger the value, the more significant the differential expression and the more reliable the differential gene. Red points represent up-regulated genes, blue points represent down-regulated genes, and gray circles represent genes showing no significant differences in expression. (B) GO enrichment analysis for the up-regulated DEGs between A1 and A3 bio-samples. (C) GO enrichment analysis for the down-regulated DEGs between A1 and A3 bio-samples. The abscissa represents the enrichment factor, and the ordinate represents the GO function classification. Circles indicate numbers of enriched genes, and colors depict the P-value. The enrichment factor was calculated using the number of enriched DEGs divided by the total number of background genes in the corresponding pathway. The size of each circle represents the number of significant DEGs enriched in the corresponding pathway. The chromatogram from blue to red represents the corrected P-value (FDR).

Figure 7 Performance of Chryseobacterium sp. coupled to ionizing irradiation in the removal of RO concentrate. (A) COD change during the treatment process of Chryseobacterium sp. (B) COD change followed by ionizing irradiation. (C) EEM spectrums of original RO concentrate. (D) EEM spectrums after the treatment of Chryseobacterium sp. (E) EEM spectrum after ionizing irradiation at 10 kGy. (F) EEM spectrum after ionizing irradiation at 30 kGy. (G) Chryseobacterium sp. culture in soild media with unirradiated wastewater as inoculation. (H) Chryseobacterium sp. culture in soild media with irradiated wastewater as inoculation.

 扫一扫看文章


扫一扫关注我们
 DownLoad:
 下载:
下载:
 下载:
下载: