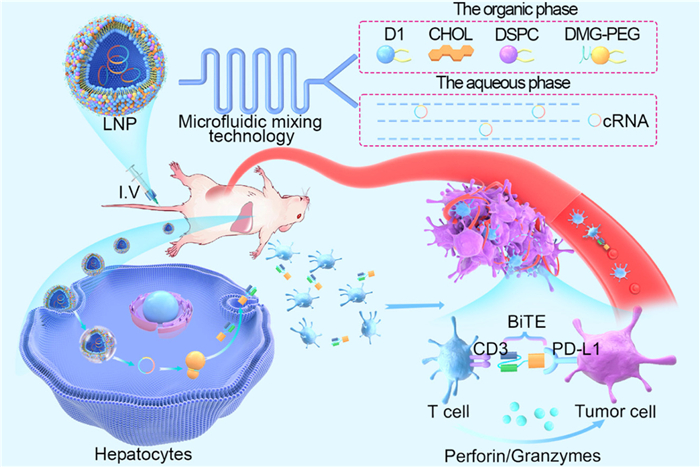
Scheme 1.
Schematic illustration of antitumor efficacy using lipid nanoparticle delivery system for cRNA-encoded PD-L1×CD3 BiTEs.

A novel ionizable lipid nanoparticle platform for circular RNA-encoded PD-L1×CD3 bispecific antibodies elicits potent antitumor immunity
Cheng Huang , Wanqin Zeng , Kunhong Zhong , Xing Duan , Yi Liu , Qingqing Tian , Liangxue Zhou , Yuelong Wang , Chunlai Nie , Aiping Tong


Cancer immunotherapy, particularly immune checkpoint blockade (ICB) therapy, has marked a significant advancement in immune oncology, notably extending overall survival across various cancers [1]. Programmed death ligand 1 (PD-L1, also known as B7-H1 and CD274), a transmembrane protein located on tumor cell surfaces [2], plays a crucial role in inhibiting tumor-infiltrating lymphocytes (TILs), thereby facilitating tumor immune evasion [3]. Although monoclonal antibodies (mAbs) against PD-1 and PD-L1 have demonstrated dramatic clinical effects, their beneficial response is limited to approximately 20%–30% [4]. Bispecific T-cell engagers (BiTEs), such as ATG-101, a 41BB×PD-L1 bispecific antibody, works by activating 41BB on T cells and inhibiting PD-L1 to enhance anti-tumor immune responses, currently in Phase Ⅰ/Ⅱ clinical trials for solid tumors and hematologic malignancies [5,6].
Compared to recombinant protein technology, mRNA-based protein expression offers advantages such as faster development, lower production costs, and the ability to produce a wider range of proteins, addressing challenges like scalability, stability, and complex protein modifications. Compared to linear RNA (lRNA), circular RNA (cRNA) exhibits superior stability and prolonged protein expression due to its covalently closed circular structure that confers resistance to RNase degradation. cRNA utilizes internal ribosome entry site (IRES) elements for cap-independent translation initiation, enabling sustained protein production [7–9]. Therefore, cRNA-based protein replacement therapy enables sustained endogenous antibody synthesis of PD-L1×CD3 BiTEs, which is favorable to promote the antitumor efficacy [10,11].
Lipid nanoparticles (LNPs) have emerged as the most advanced nonviral delivery systems for nucleic acids, playing a pivotal role in determining protein expression levels and therapeutic outcomes, particularly in mRNA-based therapies where efficient delivery vectors are essential for clinical translation [12,13]. Although widely used benchmark ionizable lipids such as C12-200, DLin-MC3-DMA, SM-102, and ALC-0315 demonstrate satisfactory delivery efficiency, their clinical translation faces significant challenges due to complex multi-step synthesis processes typically involving 4–7 steps and stringent purification requirements [14–16]. Furthermore, linear mRNA formulations suffer from transient expression and instability, reducing therapeutic durability [17]. To directly address these limitations, we engineered a novel ionizable lipid, D1, synthesized via a streamlined one-step reaction that simplifies manufacturing and enhances reproducibility [18]. When combined with cRNA, which exhibits superior nuclease resistance and sustained protein expression due to its covalently closed structure the D1LNPs@cRNABiTEs platform uniquely integrates simplified production with robust RNA delivery. This approach facilitates efficient hepatic targeting and durable BiTEs expression, leading to potent T-cell activation and antitumor efficacy, offering a scalable and innovative solution for cancer immunotherapy that effectively overcomes key gaps in existing technologies [19].
As a consequence, the novel ionizable lipid nanoparticle D1LNP was successfully developed for efficient delivery of cRNA encoding PD-L1×CD3 BiTEs (Scheme 1). D1LNPs were prepared via microfluidic mixing, encapsulating cRNA through electrostatic interactions, and demonstrated hepatocyte-targeted delivery in vivo after intravenous administration. The LNPs facilitated endosomal escape and subsequent release of cRNA, leading to robust and sustained expression of BiTEs. The secreted BiTEs effectively bridged T cells and PD-L1+ tumor cells, triggering potent T-cell activation and tumor cell lysis, thereby achieving significant antitumor immunity.
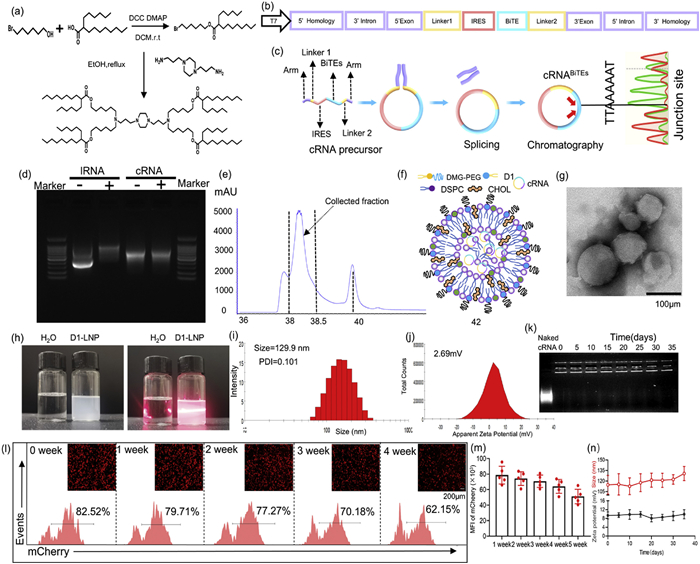
The cRNA delivery lipid D1 was synthesized according to the standard synthetic procedures outlined in Fig. 1a. NMR data for D0 and D1 are shown in Fig. S1 (Supporting information). In this study, we employed a cRNA platform to express BiTEs in mice. A cDNA backbone containing the CVB3-IRES element, protein-coding sequences, and RNA circularization elements, based on the back-splicing reaction, was designed (Figs. 1b and c). To characterize the cRNA, we digested cRNA and its linear counterpart with RNase R, followed by gel electrophoresis. The results revealed that, compared with linear RNA (lRNA), cRNA exhibited increased resistance to RNase R digestion, suggesting the superior stability of cRNA (Fig. 1d). The final products were reaction purified via liquid chromatography (Fig. 1e) as referring to previous studies [20,21]. Fig. 1f provides a detailed representation of the composition and internal structure of the D1LNPs@cRNA. The cRNA was encapsulated into LNPs through electrostatic interactions with the cationic head groups of D1. Notably, the LNPs displayed a spherical shape, along with curved, thread-like structures, with multiple overlapping thread regions visible (Fig. 1g). Furthermore, Fig. 1h shows an obvious Tyndall effect in the LNPs solution upon exposure to UV light (right). The transmission electron microscopy (TEM) image of the LNPs allowed for the characterization of their mean particle size, polydispersity index (PDI), and zeta potential using a Zetasizer. These parameters were measured as 129.9 nm ± 2.67 nm, 0.101 ± 0.18, and 2.69 ± 1.14 mV, respectively (Figs. 1i and j). Additionally, the transfection capability of D1LNPs@cRNARFP was evaluated by analyzing transfection images and flow cytometry (FCM) data over a 4-week period at room temperature. Notably, D1LNPs@cRNARFP maintained significant transfection efficiency over time (Figs. 1k and l). To assess the stability of cRNA loading in D1LNPs, agarose gel electrophoresis was performed to detect the binding of cRNA to D1LNPs (Fig. 1m). Moreover, after 35 days of storage at 4 ℃, the mean particle diameter and zeta potential of the mRNA-LNPs remained relatively unchanged (Fig. 1n). Overall, these results confirmed that cRNA was completely encapsulated by D1LNPs Collectively, these findings suggest that D1LNPs@cRNA maintains structural stability.
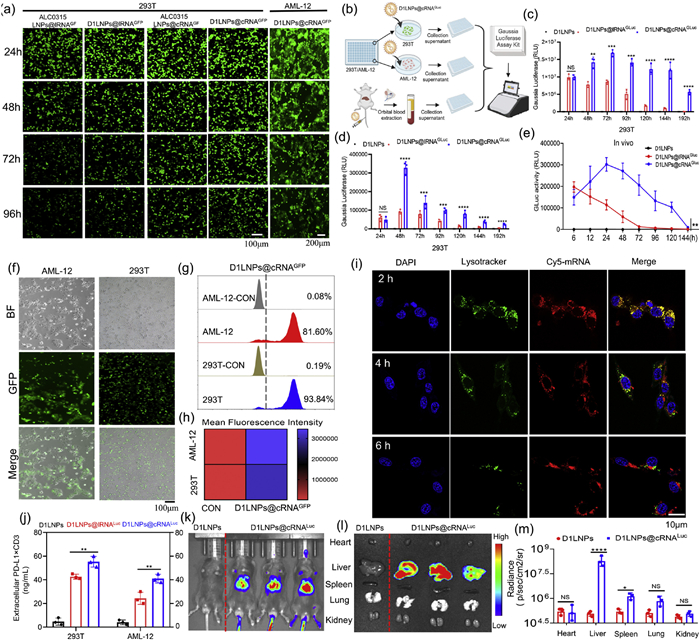
Next, we compared the green fluorescent protein (GFP) expression mediated by D1-based lipid nanoparticles and ALC0315-based LNPs in HEK293T cells using cRNA and lRNA formulations (Fig. 2a and Fig. S2a in Supporting information). We found that whether using the commercial ALC-0315 or the self-synthesized D1 lipid, encapsulating cRNAGFP significantly induced higher and more sustained GFP expression compared to lRNAGFP. Furthermore, we observed robust and sustained green fluorescence in the AML-12 cell lines treated with D1LNPs@cRNAGFP. Since PD-L1×CD3 BiTEs are secretory proteins, we employed Gaussia luciferase cRNA (cRNAGluc) to better simulate the translation and expression dynamics of cRNABiTEs both in vitro and in vivo (Fig. 2b). In vitro, GLuc protein levels translated from D1LNPs@cRNAGluc and D1LNPs@lRNAGluc peaked within 24 h, with no significant difference observed. However, GLuc expression from cRNAGluc significantly increased compared to lRNAGluc, with the divergence becoming progressively more pronounced (Figs. 2c and d). Similarly, total GLuc expression, as measured by the area under the curve, was ~2 times higher for D1LNPs@cRNAGluc than for D1LNPs@ lRNAGluc over time (Fig. 2e). Additionally, in vitro expression of PD-L1×CD3 BiTEs was more robust after treatment with D1LNPs@cRNABiTEs compared to D1LNPs@lRNABiTEs (Fig. 2j). Based on fluorescence microscopy, we observed strong green fluorescence enrichment in 293T and AML-12 cell lines treated with D1LNPs@cRNAGFP (Fig. 2f). Additionally, GFP fluorescence intensity was analyzed by FACS, revealing favorable transfection efficiency in both 293T and AML-12 cell lines (Figs. 2g and h). The internalized D1LNPs@CY5-mRNA complex must escape from endosomes or lysosomes to exert its function. Therefore, we investigated the lysosomal escape ability of D1LNPs@CY5-mRNA and observed red spots within AML-12 cells. The D1LNPs@CY5-mRNA predominantly colocalized with LysoTracker Green-stained organelles after 1-2 h of incubation. After 4-6 h, the separation between the green and red fluorescence spots became more pronounced, suggesting successful escape from endo/lysosomes, as confirmed by fluorescence colocalization analysis (Fig. 2i). Finally, to evaluate the liver-targeted delivery of D1LNPs@cRNALuc in vivo, live fluorescence images were collected 6 hours after intravenous injection of D1LNPs@cRNALuc, showing a strong fluorescent signal in the liver (Fig. 2k). In vitro fluorescence images of isolated organs collected 6 h post-injection revealed the highest transfection efficiency in liver tissue, followed by spleen tissue, and the lowest in other organs (Fig. 2l). Quantitative analysis of Luc fluorescence intensity confirmed significant increases in the liver tissue of the D1LNPs@cRNALuc treatment group compared to controls. Interestingly, Luc fluorescence levels in the spleen also showed improvements to varying degrees after intravenous administration of D1LNPs@cRNALuc (Fig. 2m). Notably, to directly compare the performance of D1LNPs with the commercially available standard ALC0315, we also evaluated the in vivo transfection efficacy of ALC0315-LNPs@cRNALuc. Compared to ALC0315-LNPs, D1LNPs demonstrated a comparable level of in vivo transfection efficiency (Figs. S2b and c in Supporting information). Mice were housed in a specific pathogen-free facility at Sichuan University, and all procedures complied with protocols approved by the Biomedical Research Ethics Committee of West China Hospital (approval No. 20250306104). All procedures adhered to protocols minimizing animal distress.
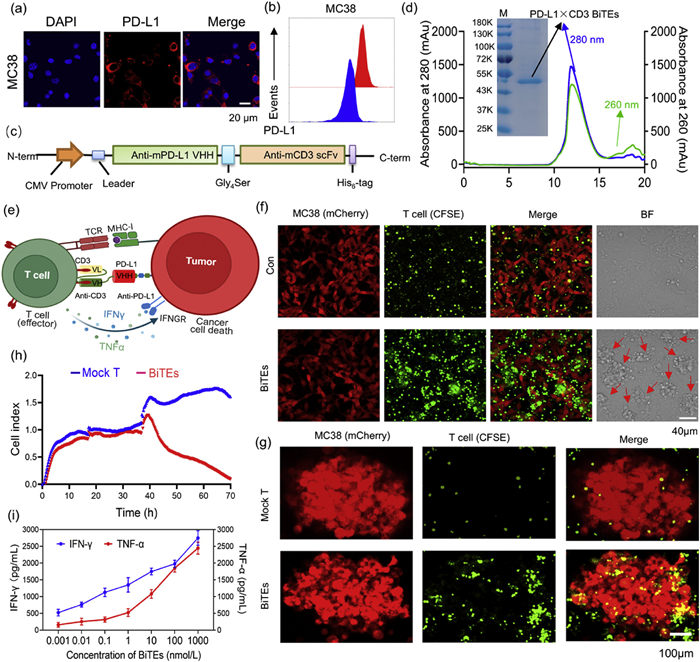
We next perform an analysis of PD-L1 expression and characterize the PD-L1×CD3 BiTEs. To investigate the correlation between PD-L1 expression and overall survival, a bioinformatic analysis was conducted using the KM-plotter database. The results revealed that elevated PD-L1 expression is associated with improved survival outcomes in colorectal cancer (CRC) patients (Fig. S3a in Supporting information). Furthermore, athough PD-L1 mRNA levels did not significantly differ across clinical stages or between normal tissues and primary tumor, PD-L1 mRNA levels were slightly higher in advanced CRC stages compared to early stages, suggesting a potential protective role of PD-L1 in specific CRC contexts (Figs. S3b and c in Supporting information). Additionally, the expression level of PD-L1 mRNA in CRC patients with recurrence and metastasis showed no significant difference (P > 0.05) (Fig. S3d in Supporting information), which further clarifies that PD-L1 expression may not be a key determinant in metastatic or recurrent settings, thereby providing a comprehensive view of its role in CRC progression. Immunohistochemistry on CRC tissue microarrays, including 80 adenocarcinoma cases, revealed significantly higher PD-L1 protein expression in advanced CRC tumors compared to adjacent normal tissues (Fig. S4a in Supporting information), while PD-L1 was not significantly expressed in normal infra-mesocolic region tissues or human multi-organ tissue microarrays samples (Figs. S4b and S5 in Supporting information). Additionally, PD-L1 protein expression in MC38 tumor cells was confirmed using immunofluorescence and FCM (Figs. 3a and b). These findings underscore the potential of PD-L1 as a clinical target for solid tumor treatment. Therefore, a single-chain camel VHH recognizing mouse PD-L1 (anti-PD-L1 VHH) was linked to an scFv recognizing mouse CD3 (anti-CD3 scFv) using a flexible glycine-serine linker (G4S)3 to obtain the PD-L1×CD3 BiTEs, and a 6×His tag was fused to the C-terminus to facilitate protein purification (Fig. 3c). Fig. 3d showed the sodium dodecyl sulfate-polyacrylamide gel electrophoresis (SDS-PAGE) analysis of purified PD-L1×CD3 BiTEs by Gel filtration chromatograph on a superdex 200 increase 10/300GL column. Coomassie blue staining of the protein gel showed PD-L1×CD3 BiTEs with the expected molecular weight (~50 kDa, Table S2 in Supporting information). To evaluate the in virto antitumor efficacy of BiTEs, a schematic of the treatment regimen is shown in Fig. 3e. We co-cultured mcherry-MC38 cells with carboxyfluorescein succinimidyl ester (CFSE)-T cells in the presence of BiTEs. Microscopy imaging revealed extensive T cell infiltration and tumor cell killing in the BiTEs group (Fig. 3f). Time-lapse analysis using xCELLigence demonstrated a marked reduction in cell index in the BiTEs group, indicating significant tumor cell death (Fig. 3g). Using a 3D tumor spheroid model, confocal microscopy showed substantial T cell infiltration into the spheroids and increased tumor cell disruption in the BiTEs group (Fig. 3h). Furthermore, interferon-gamma (IFN-γ) and tumor necrosis factor-alpha (TNF-α) secretion was measured by using the corresponding enzyme-linked immunosorbent assay (ELISA) assay kit. Concomitant with this increase in concentration of BiTEs, an increasing secretion of the IFN-γ and TNF-α cytokine can be observed (Fig. 3i). These findings demonstrate that PD-L1×CD3 BiTEs promote robust T cell activation and enhanced tumor cell targeting.
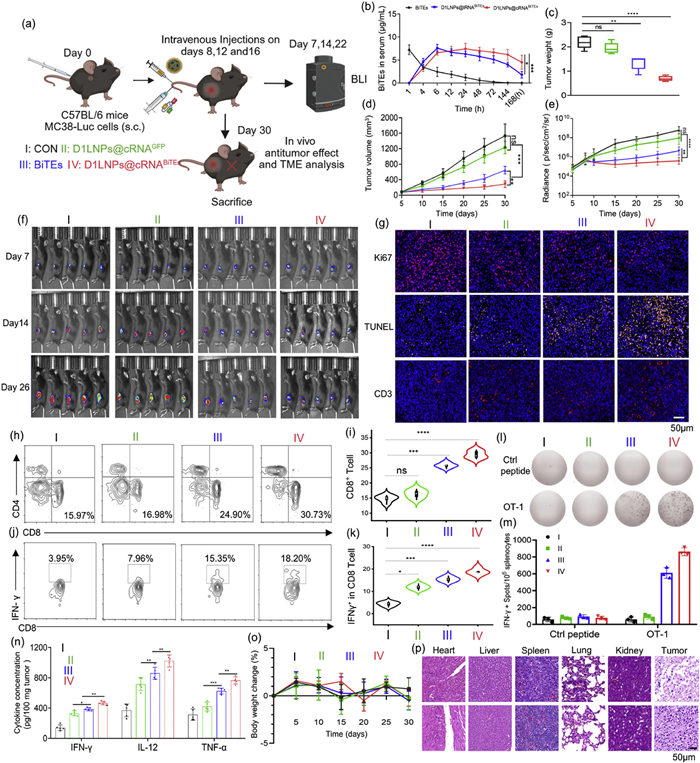
In this study, we evaluated the efficacy of D1LNPs@cRNABiTEs in treating MC38-Luc tumor-bearing C57BL/6 mice. Mice were assigned to four treatment groups: Ⅰ–CON, Ⅱ–D1LNPs@cRNAGFP, Ⅲ–BiTEs, Ⅳ–D1LNPs@cRNABiTEs. These treatments were administered intravenously on days 8, 12, and 16. Tumor progression was monitored by bioluminescence imaging (BLI) on days 7, 14, and 22, with tumor tissues collected on day 30 for subsequent analysis of antitumor effects and tumor microenvironment (TME) (Fig. 4a). Notably, pharmacokinetic analysis revealed that BiTEs remained in the serum for an extended period, with the D1LNPs@cRNABiTEs group showing the highest and most sustained levels of BITEs compared to D1LNPs@lRNABiTEs and BiTEs (Fig. 4b). Quantitative assessment of the pharmacokinetic parameters provided compelling evidence for the superiority of the cRNA platform. The BiTEs expressed from cRNA exhibited a significantly prolonged elimination half-life compared to that from lRNA, indicating a more persistent in vivo presence. Moreover, the total systemic exposure, as measured by the area under the concentration-time curve (AUC), was more than 1.5-fold higher for the cRNA-based BiTE (893.24 h µg mL−1) than for the lRNA-based formulation (589.49 h µg mL−1). This substantial increase in AUC underscores the enhanced cumulative protein production driven by the stable cRNA template. In stark contrast, the recombinant BiTEs protein control was rapidly cleared, with a short half-life, highlighting the critical advantage of endogenous expression via the RNA platform (Table S3 in Supporting information). These pharmacokinetic findings directly correlate with the robust and durable antitumor efficacy observed, affirming that the sustained protein delivery from D1LNPs@cRNABiTEs is a key determinant of its therapeutic success. Next, tumor growth data revealed a significant reduction in both tumor weight and volume in BiTEs group, where D1LNPs@cRNABiTEs group had the lowest tumor weight at sacrifice (day 30) and the smallest tumor volume throughout the study, as illustrated by the tumor volume growth curves and tumor weight data (Figs. 4c and d). Similarly, the weakest fluorescence signal of tumors was observed in mice treated with the D1LNPs@cRNABiTEs, followed by tumors treated with BiTEs (Figs. 4e and f). Analysis of the TME showed increased infiltration of CD3 T cells and enhanced apoptosis in D1LNPs@cRNABiTEs, as evidenced by TUNEL and CD3 immunofluorescence staining. The Ki67 staining revealed a reduction in cell proliferation within the tumor tissues of D1LNPs@cRNABiTEs group, supporting the therapeutic efficacy of the D1LNPs@cRNABiTEs in reducing tumor cell growth (Fig. 4g). Moreover, a significant increase in cytotoxic CD8+ T cells was observed in tumor tissue for the mice administrated with D1LNPs@cRNABiTEs (30.73%), compared to minor increases in D1LNPs@cRNAGFP (16.98%), and BiTEs (24.90%) groups (Figs. 4h and i). Furthermore, D1LNPs@cRNABiTEs treatment led to a about 5 fold increase in IFN-γ+ T cell proportion, indicating T cell-mediated antitumor response (Figs. 4j and k). Additionally, ELISpot analysis demonstrated that D1LNPs@cRNABiTEs treatment induced robust IFN-γ secretion from splenic cells, with a significantly higher number of IFN-γ-producing spots compared to control peptide group (Figs. 4l and m), further confirming the enhancement of antigen-specific T cell responses at a systemic level. This suggests that the D1LNPs@cRNABiTEs significantly enhances the immune response in the TME, with a notable increase in the number of activated cytotoxic T cells. Cytokine production in the tumor tissues, including IFN-γ, IL-12, and TNF-α, was significantly elevated in D1LNPs@cRNABiTEs treatment group compared to the other groups (Fig. 4n), further supporting the conclusion that the D1LNPs@cRNABiTEs promotes a potent pro-inflammatory immune response that contributes to tumor regression. Lastly, no significant body weight loss and morphological changes in the heart, spleen, kidney or lung were observed across the treatment groups, indicating that the treatment regimen was well tolerated and did not result in severe toxicity (Figs. 4o and p). These findings provide compelling molecular evidence supporting the therapeutic effect of this D1LNPs delivery system in preclinical models of colorectal cancer.
In summary, this work achieves two pivotal advances: (1) The successful formulation of D1LNPs@cRNABiTEs provides a robust and versatile platform for in vivo cRNA delivery, which could be adapted for a variety of cancer therapies. The cRNA formulation provided sustained BiTEs expression and improved protein stability compared to linear mRNA. (2) The development of a simplified, one-step ionizable lipid (D1) enabling efficient cRNA delivery. Compared to traditional LNPs requiring complex synthesis, D1LNPs exhibited comparable efficacy with reduced production hurdles. Therefore, monotherapy with D1LNPs@cRNABiTEs markedly inhibited tumor growth, increased CD8+ T-cell infiltration, boosted the secretion of proinflammatory cytokines, and significantly remodeled the tumor immune microenvironment. Collectively, these findings highlight a potent, scalable immunotherapeutic strategy based on advanced RNA delivery platforms.
The use of human tissue samples in this study, including colorectal cancer tissue microarrays (adenocarcinoma cases with adjacent normal tissues) and human multi-organ tissue microarrays, was approved by the Ethics Committee of Shanghai Outdo Biotech Company (approval Nos. YBM-05-01 and YBM-05-02). All procedures involving human samples were conducted in accordance with the ethical standards of the institutional research committee and with the principles of the Declaration of Helsinki. Informed consent was obtained from all participants or their legal representatives for the original sample collection, as documented by the supplier (Shanghai Outdo Biotech Company).
The authors declare that they have no known competing financial interests or personal relationships that could have appeared to influence the work reported in this paper.
Cheng Huang: Writing – review & editing, Writing – original draft, Investigation. Wanqin Zeng: Software, Data curation. Kunhong Zhong: Resources, Methodology. Xing Duan: Visualization, Conceptualization. Yi Liu: Project administration, Funding acquisition. Qingqing Tian: Resources, Formal analysis. Liangxue Zhou: Visualization, Validation, Supervision, Funding acquisition. Yuelong Wang: Writing – review & editing, Supervision, Funding acquisition. Chunlai Nie: Visualization, Validation, Methodology, Investigation. Aiping Tong: Visualization, Validation, Supervision.
This work was supported by the National Key Research and Development Program of China (Nos. 2023YFC3403303, 2023YFC3403304), the Sichuan Province science and technology Department key research and development project (No. 2023YFS0013)
Supplementary material associated with this article can be found, in the online version, at doi:
R.S. Riley, C.H. June, R. Langer, et al., Nat. Rev. Drug Discov. 18 (2019) 175-196. doi: 10.1038/s41573-018-0006-z
V.A. Boussiotis. N. Engl. J. Med. 375 (2016) 1767-1778. doi: 10.1056/NEJMra1514296
D.B. Doroshow, S. Bhalla, M.B. Beasley, et al., Nat. Rev. Clin. Oncol. 18 (2021) 345-362. doi: 10.1038/s41571-021-00473-5
C. Hsu, S.H. Lee, S. Ejadi, et al., J. Clin. Oncol. 35 (2017) 4050-4056. doi: 10.1200/JCO.2017.73.3675
S. Jeong, E. Park, H.D. Kim, et al., J. Immunother. Cancer. 9 (2021) 002428.
P. Sharma, S. Hu-Lieskovan, J.A. Wargo, et al., Cell 168 (2017) 707-723. doi: 10.1016/j.cell.2017.01.017
R.A. Wesselhoeft, P.S. Kowalski, D.G. Anderson. Nat. Commun. 9 (2018) 2629. doi: 10.1038/s41467-018-05096-6
R. Chen, S.K. Wang, J.A. Belk, et al., Nat. Biotechnol. 41 (2023) 262-272. doi: 10.1038/s41587-022-01393-0
I.L. Patop, S. Wüst, S. Kadener. EMBO J. 38 (2019) e100836.
C.R. Stadler, H. Bähr-Mahmud, L. Celik, B. Hebich, et al., Nat. Med. 23 (2017) 815-817. doi: 10.1038/nm.4356
H. Li, K. Peng, K. Yang, et al., Theranostics 12 (2022) 6422-6436. doi: 10.7150/thno.77350
R. Tenchov, R. Bird, A.E. Curtze, et al., ACS Nano 15 (2021) 16982-17015. doi: 10.1021/acsnano.1c04996
C. Huang, X. Duan, J. Wang, et al., Adv. Sci. 10 (2023) e2205532. doi: 10.1002/advs.202205532
C. Wang, Y. Zhang, Y. Dong. Acc. Chem. Res. 54 (2021) 4283-4293. doi: 10.1021/acs.accounts.1c00550
J. Wang, Y. Ding, K. Chong, M. Cui, et al., Vaccines 12 (2024) 1148. doi: 10.3390/vaccines12101148
F. Ferraresso, A.W. Strilchuk, L.J. Juang, et al., Mol. Pharm. 19 (2022) 2175-2182. doi: 10.1021/acs.molpharmaceut.2c00033
Y. Shi, M. Shi, Y. Wang, et al., Sig. Transduct. Target. Ther. 9 (2024) 322. doi: 10.3390/drones8070322
Y. Tian, M. Li, Y. Yang, et al., Chin. Chem. Lett. 35 (2024) 109270. doi: 10.1016/j.cclet.2023.109270
H. Xu, J. Fan, J. Liu, et al., Chin. Chem. Lett. 36 (2025) 110833. doi: 10.1016/j.cclet.2025.110833
R.A. Wesselhoeft, P.S. Kowalski, D.G. Anderson, et al., Nat. Commun. 9 (2018) 2629. doi: 10.1038/s41467-018-05096-6
R.A. Wesselhoeft, P.S. Kowalski, F.C. Parker-Hale, et al., Mol. Cell 74 (2019) 508–520 .e504. doi: 10.1016/j.molcel.2019.02.015

Scheme 1 Schematic illustration of antitumor efficacy using lipid nanoparticle delivery system for cRNA-encoded PD-L1×CD3 BiTEs.

Figure 1 Characterization and physicochemical properties of the designed D1LNPs@cRNA. (a) Schematic illustration of D1 synthesis. (b) Flow chart depicting the elements required for cRNABiTEs production using the PIE system. (c) Sanger sequencing chromatograph for the junction site of the reverse-transcribed cRNABiTEs sample is shown on the right. (d) Agarose gel electrophoresis of precursor RNA and cRNA after RNase R digestion. (e) Chromatogram of cRNA coding BiTEs purification via the AKTA purifier system. (f) Schematic diagram showing the components and 2D structure of D1LNPs@cRNA. (g) Representative TEM images of D1LNPs@cRNA. Scale bar: 100 nm. Weight ratios of 1:15 (cRNA to D1) were used in LNPs synthesis. (h) The Tyndall effect of D1LNPs@cRNA. (i) Size distribution of the D1LNPs@cRNA determined by the dynamic laser scanning method. (j) Apparent zeta potential of D1LNP@cRNA. (k) Transfection assay and FCM to investigate the cRNARFP loading stability of D1LNPs from week zero to week fourth stored at 4 ℃. Scale bar: 100 µm. (l) RFP quantitative analysis of D1LNPs@ cRNARFP in 293T cells at the indicated times (mean ± SD, n = 5). (m) cRNA loading stability by LNPs was evaluated by a gel retardation assay. (n) The variation in particle size and zeta potential of D1LNPs@ cRNARFP after 40 days of storage at 4 ℃.

Figure 2 D1LNPs@cRNA translation efficacy and transfection effect in vitro and in vivo. (a) The effects of different lipid and RNA formulations on GFP expression in cell transfection from 24 h to 96 h. (b) Schematic flow chart of the cRNA and lRNA translation experimental design in vitro and in vivo. (c, d) In vitro sustained expression of Gluc after D1LNPs@lRNAGluc or D1LNPs@cRNAGluc treatment at different times in AML-12 and 293T cells. (e) In vivo expression of Gluc after D1LNPs@lRNAGluc or D1LNPs@cRNAGluc treatment at different times. (f) Graphs illustrate GFP expression after D1LNPs@cRNAGFP in AML-12 and 293T cells. Scale bar: 100 µm. (g, h) FCM and quantitative analysis of 293T and AML-12 cells treated with D1LNPs@cRNAGFP for 24 h. (i) Confocal laser scanning microscopy (CLSM) images show the lysosome escape of D1LNPs@ CY5-mRNA in AML12 cells after 2, 4 and 6 h of incubation. Lysosomes and nucleus were stained with lysotracker green and 4′, 6-diamidino-2-phenylindole (DAPI), respectively. Scale bar: 10 µm. (j) BiTEs expression analyzed by ELISA in 293T cells and AML-12 cells after indicated treatments. (k) In vivo transfection efficacy of D1LNPs@cRNALuc following intravenous administration. Ex vivo imaging of organs (l) and quantitative analysis of luminescence (m) were performed 6 h after intravenous administration of D1LNPs@cRNALuc. Data were analyzed by Student's t test (c, d, j, m) or two-way ANOVA with Tukey's multiple comparisons test (e). Data were presented as mean ± SD (n = 3). P < 0.05, **P < 0.01, ***P < 0.001, ****P < 0.0001. NS, not significant.

Figure 3 PD-L1×CD3 BiTEs-mediated cytotoxicity in vitro. (a, b) Immunofluorescence staining and FCM analysis of PD-L1 expression in MC38 cells. Scale bar: 20 µm. (c) Schematic diagram of PD-L1×CD3 BiTEs construction. (d) SDS PAGE and gel filtration chromatograph of PD-L1×CD3 BiTEs. (e) Schematic of hypothesized working model. (f, g) Morphology analysis of 2D tumor cells and 3D tumorsphere model using confocal microscopy after indicated treatments; Target cells (MC38-mCherry) and effector cells (T cell-CFSE). Scale bar: 40, 100 µm. (h) Survival curves of MC38 tumor cells recorded by xCELLigence® real-time cell analyzer after indicated treatments. (i) T cells co-cultured with target cells at various PD-L1×CD3 BiTEs concentrations for 24 h. The IFN-γ and TNF-α secretion levels were measured by ELISA kit. Data are presented as mean ± SD (n = 3).

Figure 4 In vivo antitumor effects of D1LNPs@cRNABiTEs in MC38 subcutaneous tumor xenograft models. (a) Schematic diagram of the indicated treatments administered to MC38 tumor-bearing mice and photographs of MC38 tumor-bearing mouse on day 30 after the indicated treatments. (b) Pharmacokinetics endogenously translated PD-L1×CD3 BiTEs in the plasma of mice that were i.v. injected with 120 µg (6 mg/kg) PD-L1×CD3 BiTEs (positive control), 30 µg (1.5 mg/kg) of D1LNPs@lRNABiTE or 30 µg (1.5 mg/kg) of D1LNPs@cRNABiTEs. (c-e) Tumor weight (c), tumor volume (d), and tumor bioluminescence total data (in p/s) (e) in different groups of mice. (f) Representative tumor growth visualized by bioluminescence imaging using IVIS 200 at 7, 14, and 26 days post-implantation. Laser power density, 2 W/cm. (g) Ki-67, TUNEL and CD3 immunofluorescence staining of tumor slices. Scale bar: 20, 50 µm. (h, i) Representative flow cytometric and quantitative analysis of the CD8+ T cells population in tumors after indicated treatments. (j, k) FCM results and quantitative analysis of IFN-γ+ CD8+ T cells in tumors. (l) Secretion of IFN-γ from splenic detected by an ELISpot. (m) Quantity of spots read by an ELISpot reader. (n) Relative levels of proinflammatory cytokines (IFN-γ, IL-12 and TNF-α) in tumor tissues after different treatments. (o) Body weight change in different groups of mice. (p) Preclinical safety assessment and antitumor effect were evaluated by hematoxylin and eosin staining (H & E). Data were analyzed by Student's t test (c, i, k, n) or two-way ANOVA with Tukey's multiple comparisons test (b, d, e). Data were presented as mean ± SD (n = 5). P < 0.05, **P < 0.01, ***P < 0.001, ****P < 0.0001.

 扫一扫看文章


扫一扫关注我们
 DownLoad:
 下载:
下载:
 下载:
下载: