 图1
SEM images of the Pt nanoparticles obtained in [DEME][BF4] containing 30 mmol·L-1 H2PtCl6 by potentiostatic electrodeposition at 60 ℃ for 600 s with different potentials
Figure1.
SEM images of the Pt nanoparticles obtained in [DEME][BF4] containing 30 mmol·L-1 H2PtCl6 by potentiostatic electrodeposition at 60 ℃ for 600 s with different potentials
图1
SEM images of the Pt nanoparticles obtained in [DEME][BF4] containing 30 mmol·L-1 H2PtCl6 by potentiostatic electrodeposition at 60 ℃ for 600 s with different potentials
Figure1.
SEM images of the Pt nanoparticles obtained in [DEME][BF4] containing 30 mmol·L-1 H2PtCl6 by potentiostatic electrodeposition at 60 ℃ for 600 s with different potentials
Citation:
WANG Dan, LIU Li-Lai, LI Ming-Xian, PAN Xiao-Na, ZHAO Yan-Hong, ZHANG Jin-Qiu, AN Mao-Zhong, YANG Pei-Xia. Preparation of Platinum Nanoparticles via Electrochemical Method in N, N-diethyl-N-methyl-N-(2-methoxyethyl)ammonium tetrafluoroborate Ionic Liquid[J]. Chinese Journal of Inorganic Chemistry,
2018, 34(2): 409-414.
doi:
10.11862/CJIC.2018.045

以电化学方法在离子液体[DEME][BF4]中合成铂纳米粒子
摘要:
通过恒电位电沉积法在离子液体N,N-二乙基-N-甲基-N-(2-甲氧基乙基)铵四氟硼酸铵([DEME][BF4])中,在玻碳电极上制备了铂纳米颗粒。首先探究了不同沉积电势和不同沉积时间对铂纳米粒子微观形貌的影响,由SEM和TEM图发现在-2.5 V下沉积480 s制备的铂纳米粒子的平均粒径约为2.38 nm。使用高分辨率透射电子显微镜(HRTEM)和电子衍射(SAED)对其晶体结构进行表征,证明了铂纳米粒子为面心立方(fcc)晶体结构。在硫酸中测试铂纳米粒子的催化性能,发现其暴露出明显的(110)和(100)晶面。进一步对铂的电沉积行为进行研究发现,Pt(Ⅳ)的两步还原是由扩散过程和电化学过程共同控制。
English
Preparation of Platinum Nanoparticles via Electrochemical Method in N, N-diethyl-N-methyl-N-(2-methoxyethyl)ammonium tetrafluoroborate Ionic Liquid
Abstract:
Platinum nanoparticles were prepared via a potentiostatic electrodeposition method on a glassy carbon electrode from N, N-diethyl-N-methyl-N-(2-methoxyethyl)ammonium tetrafluoroborate ([DEME] [BF4]) ionic liquid. At first, the effects of different deposition potentials and deposition times on the micromorphology of platinum nanoparticles were investigated. It has been found that the mean size of Pt nanoparticles obtained at -2.5 V for 480 s was estimated to be ca. 2.38 nm from the SEM and TEM images. Its face-centered cubic (fcc) crystal structure was confirmed by high-resolution transmission electron microscopy (HRTEM) and electron diffraction (SAED). At the same time, Platinum nanoparticles exposed significant (110) and (100) planes in sulfuric acid. Further study of the deposition behavior of platinum reveals that the diffusion process and the electrochemical process controll the two-step reduction of Pt(Ⅳ) together.
-
Key words:
- ionic liquid
- / Pt
- / electrodeposition
- / fuel cell
-
As a promising catalyst, Pt has been widely used for decades due to its high catalytic activity in oxygen reduction reaction, hydrogen oxidation reaction, alcohol and acid oxidation reaction for fuel cells as well as organic reactions for petroleum chemistry. On account of the high cost of platinum, it is significant to reduce the particle size to improve electrochemical active area and utilization of the platinum. Platinum particles can be produced by the method of chemical reduc-tion[1-2], impregnation[3], microemulsion[4], microwave assisted[5-6], electrodeposition[7-11], magnetron sputter-ing[12-13] and some other methods. Electrodeposition method is a low cost and environmentally friendly way to synthesis most metals compared to other methods. Hence, there are some studies on the electrodeposition of platinum in aqueous solution[7-8, 14], and the results show that it is difficult to obtain a few nanometers of platinum nanoparticles in aqueous solution. In addition, electrodeposition in aqueous solution is often accompanied with hydrogen evolution reaction, resulting in the emergence of pinholes on the coating, which can seriously affect the coating performance.
Therefore, electrodeposition in the nonaqueous solution shows its advantages and necessity. In recent years, ionic liquids have attracted intensive attention as new possible solvents for fabrication of both noble metals and non-noble metals due to its many advantages[15-16], such as a wide electrochemical window, high ionic conductivity, good thermal stability, and etc.
In order to obtain more smaller and uniform Pt nanoparticles, there are some efforts have been made to deposit Pt in ionic liquids. Some researchers investigated the electrodeposition of platinum in 1-n-butyl-3-methylimidazolium tetrafluoroborate ([BMIM][BF4])[17], 1-n-butyl-3-methylimidazolium hexafluoro-phosphate ([BMIM][PF6])[17-18] and N, N-diethyl-N-methyl-N-(2-methoxyethyl)ammonium tetrafluoroborate ([DEME][BF4])[19]. These are mainly focused on the electrodeposition behavior of Pt, and the investagation about the catalytic performance of Pt, which electrode-posited in ionic liquids, is still rare.
In this study, electrodeposition of Pt nanoparticles was carried out on a glassy carbon electrode in [DEME][BF4] containing chloroplatinic acid hexahydrate at 60 ℃. And the catalytic performance of Pt nanoparticles was also investigated. The mean size of as prepared Pt nanoparticles is estimated to be ca. 2.38 nm, which also exhibit good catalytic performance.
1 Experimental
1.1 Materials
[DEME][BF4] was purchased from Shanghai Chengjie Chemical Co., Ltd. The ionic liquid was dried under vacuum at a temperature of 80 ℃ for more than 24 h before using. H2PtCl6·6H2O and H2SO4 were obtained from Sinopharm Group Chemical Reagent Co., Ltd. Both of them were analytical grade and used without further purification.
1.2 Methods
The electrodeposition was performed by a three-electrode system. Glassy carbon (GC, Φ=3 mm) was used as a working electrode (WE). A Pt wire (Φ=0.5 mm) acted as the quasi-reference electrode and a Pt foil (1.2 cm×1.2 cm) served as counter electrode (CE). A constant potential was applied to the working electrode for 480 s to generate Pt nanoparticles on the GC at 60 ℃.
1.3 Characterization and testing
The catalytic test was also proceeded by a three-electrode system, in which Pt supported on GC acted as WE, Saturated calomel electrode (SCE) and Pt foil served as RE and CE, respectively. The cyclic voltammetry measurements were also carried out by a three electrode system, and the only difference was that a Pt wire was used as a quasi-reference electrode. All of the electrochemical measurements were carried out on a CHI750D electrochemical workstation. The microstructure of the Pt particles was characterized by scanning electron spectroscope (SEM, SU8010, Hitachi, 15 kV), transmission eletron microscope (TEM, Tecnai G2 F20 S-TWIN, FEI, 200 kV), high-resolution trans-mission electron microscope (HRTEM, 200 kV) and selected area electron diffraction (SAED).
2 Results and discussion
2.1 Micromorphology of the Pt particles
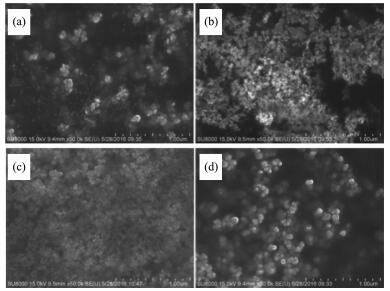
SEM images of the Pt nanoparticles obtained at different electrodeposition potential are showed in Fig. 1. When the potential is negatively shifted from -2.0 to -2.5 V, the particles are more uniform, and become smaller at -2.8 V. According to the metal electrode-position theory, the nucleation rate is greater than the growth rate with the cathode overpotential increasing so that it can obtain smaller and dense deposition. The particle size of Pt particles is obviously larger when the potential is -3.0 V, which is due to apparently agglomeration of the nanoparticles.
图1
SEM images of the Pt nanoparticles obtained in [DEME][BF4] containing 30 mmol·L-1 H2PtCl6 by potentiostatic electrodeposition at 60 ℃ for 600 s with different potentials
Figure1.
SEM images of the Pt nanoparticles obtained in [DEME][BF4] containing 30 mmol·L-1 H2PtCl6 by potentiostatic electrodeposition at 60 ℃ for 600 s with different potentials
The morphologies of Pt particles deposited for different deposition time are shown in Fig. 2. When the deposition time is 120 s, the obtained particles are less and dispersed. The particles deposited for 300 s are uniformly distributed, but become more locally stacked and agglomerated when the deposition time increases to 480 s. As shown in Fig. 2, a dense deposition was formed due to lengthen deposition time to 600 s causing the particles serious agglomeration. It is obvious that the agglomeration of the particles become more seriously with the deposition time increasing.
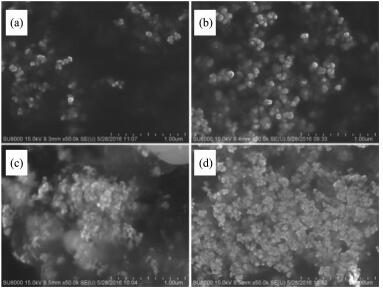 图2
SEM images of the Pt nanoparticles obtained in [DEME][BF4] containing 30 mmol·L-1 H2PtCl6 by potentiostatic electrodeposition with -2.5 V at 60 ℃ for different times
Figure2.
SEM images of the Pt nanoparticles obtained in [DEME][BF4] containing 30 mmol·L-1 H2PtCl6 by potentiostatic electrodeposition with -2.5 V at 60 ℃ for different times
图2
SEM images of the Pt nanoparticles obtained in [DEME][BF4] containing 30 mmol·L-1 H2PtCl6 by potentiostatic electrodeposition with -2.5 V at 60 ℃ for different times
Figure2.
SEM images of the Pt nanoparticles obtained in [DEME][BF4] containing 30 mmol·L-1 H2PtCl6 by potentiostatic electrodeposition with -2.5 V at 60 ℃ for different times
Fig. 3 shows TEM images and the size distribution of Pt nanoparticles. The Pt nanoparticles obtained at the two different electrode potentials are both well dispersed and uniform. The average sizes (in diameter) of the Pt nanoparticles obtained by electrodeposition at -2.5 and -3.0 V are estimated to be 2.38 and 3.10 nm, respectively. It has been reported that when the particle size of platinum nanoparticles is 2.5~3.5 nm, the electrocatalytic activity of platinum catalyst can be greatly improved[20]. Hence, it can be speculated that the prepared nanoparticles have good electrocatalytic activity.
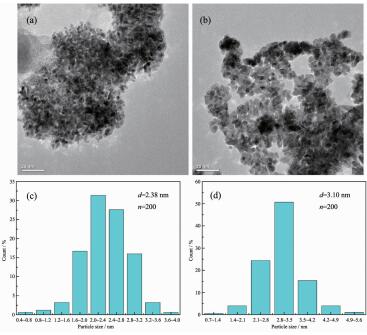 图3
Transmission electron microscopy and size distribution of the Pt nanoparticles obtained in [DEME][BF4] containing 30 mmol·L-1 H2PtCl6 by potentiostatic electrodeposition at 60 ℃ for 480 s with different potentials
Figure3.
Transmission electron microscopy and size distribution of the Pt nanoparticles obtained in [DEME][BF4] containing 30 mmol·L-1 H2PtCl6 by potentiostatic electrodeposition at 60 ℃ for 480 s with different potentials
图3
Transmission electron microscopy and size distribution of the Pt nanoparticles obtained in [DEME][BF4] containing 30 mmol·L-1 H2PtCl6 by potentiostatic electrodeposition at 60 ℃ for 480 s with different potentials
Figure3.
Transmission electron microscopy and size distribution of the Pt nanoparticles obtained in [DEME][BF4] containing 30 mmol·L-1 H2PtCl6 by potentiostatic electrodeposition at 60 ℃ for 480 s with different potentials
2.2 Crystal structure of Pt
In order to investigate the microstructure of Pt nanoparticles more closely, the HRTEM images and SAED patterns of the catalysts are presented in Fig. 4. The HRTEM image of Pt nanoparticles shown in Fig. 4a demonstrates clear lattice fringes with an inter fringe distance of 0.221 nm corresponding to the lattice spacing of Pt(111) plane. The HRTEM image shown in Fig. 4b displays the inter fringe distance of approximately 0.196 nm analogous to the Pt(200) plane. Its SAED pattern reveals the face-centered cubic (fcc) Pt crystal structure, which is indexed as (111), (200), (220) and (311) lattice planes of Pt.
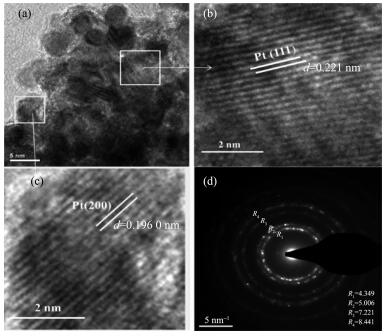 图4
HRTEM images and SAED patterns of Pt nanoparticles obtained in [DEME][BF4] containing 30 mmol·L-1 H2PtCl6 by potentiostatic electrodeposition with -2.5 V at 60 ℃ for 480 s
Figure4.
HRTEM images and SAED patterns of Pt nanoparticles obtained in [DEME][BF4] containing 30 mmol·L-1 H2PtCl6 by potentiostatic electrodeposition with -2.5 V at 60 ℃ for 480 s
图4
HRTEM images and SAED patterns of Pt nanoparticles obtained in [DEME][BF4] containing 30 mmol·L-1 H2PtCl6 by potentiostatic electrodeposition with -2.5 V at 60 ℃ for 480 s
Figure4.
HRTEM images and SAED patterns of Pt nanoparticles obtained in [DEME][BF4] containing 30 mmol·L-1 H2PtCl6 by potentiostatic electrodeposition with -2.5 V at 60 ℃ for 480 s
2.3 Electrocatalytic evalution of Pt
To electrochemically evaluate the platinum nanoparticles, the CV curve of as prepared GC/Pt electrode were conducted with potential scanned from -0.25 to 1.25 V (SCE), as shown in Fig. 5. Hydrogen adsorption and desorption curve each containing two separate peaks is due to the exposure of the different crystal planes of platinum nanoparticles[21-22]. The catalytic peaks of Pt(110) and (100) planes gradually exposed with the scanning progress. The peak at about -0.07 V originates from the hydrogen adsorption/desorption on the Pt(100) plane, and its intensity reflects the fact that how many Pt(100) planes are present on the surface of nanoparticles[23]. These results demonstrate that the Pt nanoparticles prepared at -2.5 V are relatively enriched in Pt(110) and (100) planes, when these planes are compared. This is consistent with the results of the HRTEM images and SAED patterns in Fig. 4. The crystal planes of Pt nanoparticles can greatly affect the electrocatalytic activity of the surface[24]. Accordingly, these results demonstrate that the prepared catalyst has good electrocatalytic performance. Of course, it′s also need to make some efforts on optimizing the electrocatalytic performance of the Pt nanoparticles.
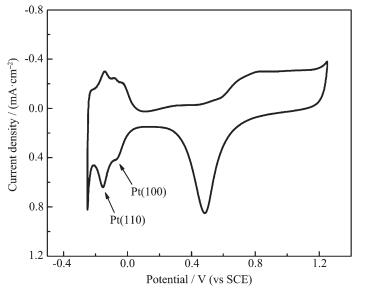 图5
Cyclic voltammogram curve of GC/Pt electrode obtained in [DEME][BF4] containing 30 mmol·L-1 H2PtCl6 by potentiostatic electrodeposition at -2.5 V (vs Pt) in 0.5 mol·L-1 H2SO4 with a scan rate of 50 mV·s-1
Figure5.
Cyclic voltammogram curve of GC/Pt electrode obtained in [DEME][BF4] containing 30 mmol·L-1 H2PtCl6 by potentiostatic electrodeposition at -2.5 V (vs Pt) in 0.5 mol·L-1 H2SO4 with a scan rate of 50 mV·s-1
图5
Cyclic voltammogram curve of GC/Pt electrode obtained in [DEME][BF4] containing 30 mmol·L-1 H2PtCl6 by potentiostatic electrodeposition at -2.5 V (vs Pt) in 0.5 mol·L-1 H2SO4 with a scan rate of 50 mV·s-1
Figure5.
Cyclic voltammogram curve of GC/Pt electrode obtained in [DEME][BF4] containing 30 mmol·L-1 H2PtCl6 by potentiostatic electrodeposition at -2.5 V (vs Pt) in 0.5 mol·L-1 H2SO4 with a scan rate of 50 mV·s-1
2.4 Electrodeposition behavior of Pt
Fig. 6 displays the cyclic voltammogram of the GC electrode in [DEME][BF4] (Fig. 6a) and [DEME][BF4] containing 30 mmol·L-1 H2PtCl6 (Fig. 6b). As shown in Fig. 6, the ionic liquid is relatively stable in the range of the potential from 1.5 to -3.5 V (vs Pt). When the potential is negatively shifted to -3.5 V (vs Pt), the decomposition of the cation [DEME]+ begins to occur, and becomes seriously after -4.1 V (vs Pt). As can be seen from Fig. 6b, there are two reduction peaks in the negative scanning process. The first reduction peak c1 appears at the potential of -0.8 V (vs Pt) and the second reduction peak c2 appears at -1.7 V (vs Pt). It′s possibly corresponding to the two-step reduction of chloroplatinic acid[19]. The first step is the process of reduction of Pt(Ⅳ) to Pt(Ⅱ) at -0.8 V (vs Pt), and the second step is the process of Pt(Ⅱ) to Pt at -1.7 V (vs Pt). In the positive scanning process, only one oxidation peak a1 occurs at -0.4 V (vs Pt), which corresponds to the oxidization of Pt(Ⅱ) to Pt(Ⅳ). However, the area of peak a1 is small compared with the reduction peaks. It′s likely to be that some of the [PtCl4]2- is reduced to Pt metal when the potential is negatively shifted during the scanning process.
 图6
Cyclic voltammograms of the GC electrode in different electrolytes at 60 ℃ with a scan rate of 50 mV·s-1
Figure6.
Cyclic voltammograms of the GC electrode in different electrolytes at 60 ℃ with a scan rate of 50 mV·s-1
图6
Cyclic voltammograms of the GC electrode in different electrolytes at 60 ℃ with a scan rate of 50 mV·s-1
Figure6.
Cyclic voltammograms of the GC electrode in different electrolytes at 60 ℃ with a scan rate of 50 mV·s-1
The CV curves at different scan rates were carried out to have an in-depth study on the electrodeposition behavior of platinum. Fig. 7 displays the CV curves of [DEME][BF4] containing 30 mmol·L-1 H2PtCl6 at 60 ℃ with a sacn rate of 10, 20, 40, 60, 80, 100 mV·s-1, respectively. If a reaction is a reversible reaction, the peak potential Ep will maintain constant because of the different scan rates. But for irreversible reactions, the peak potential Ep will move. In Fig. 7, the scan rate increases from 10 to 100 mV·s-1, and the second reduced peak potential (c2) Ep is negatively shifted. It indicates that the reaction of Pt(Ⅱ) to Pt is an irreversible reaction[25-27].
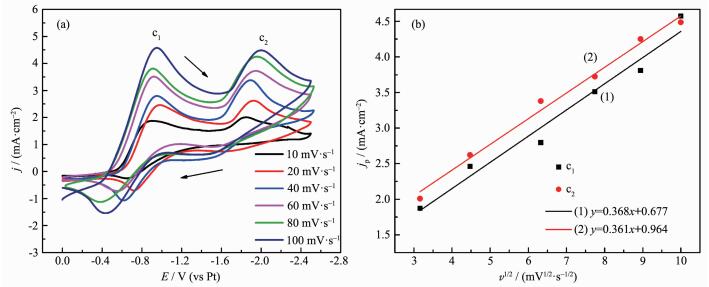 图7
(a) Cyclic voltammograms of the GC electrode in [DEME][BF4] containing 30 mmol·L-1 H2PtCl6 at 60 ℃ with different scan rates; (b) Fitting curve of peak current density jp and v1/2
Figure7.
(a) Cyclic voltammograms of the GC electrode in [DEME][BF4] containing 30 mmol·L-1 H2PtCl6 at 60 ℃ with different scan rates; (b) Fitting curve of peak current density jp and v1/2
图7
(a) Cyclic voltammograms of the GC electrode in [DEME][BF4] containing 30 mmol·L-1 H2PtCl6 at 60 ℃ with different scan rates; (b) Fitting curve of peak current density jp and v1/2
Figure7.
(a) Cyclic voltammograms of the GC electrode in [DEME][BF4] containing 30 mmol·L-1 H2PtCl6 at 60 ℃ with different scan rates; (b) Fitting curve of peak current density jp and v1/2
The fitting equation of curve (1) and curve (2) obtained according to the peak c1 and c2 are y=0.368x+0.677, y=0.361x+0.964, respectively. From the fitting formula and Fig. 7, it is obvious that jp and v1/2 have a good linear relationship and the fitting curve does not go through the origin, indicating that the processes of Pt(Ⅳ) reduced to Pt(Ⅱ) and Pt(Ⅱ)reduced to Pt are both controlled by diffusion process and electrochemical process together.
3 Conclusions
In conclusion, platinum nanoparticles with a mean size of ca. 2.38 nm were prepared via a potentiostatic electrodeposition method on a glassy carbon electrode from [DEME][BF4] at -2.5 V. The HRTEM images and cyclic voltammogram curve confirm that the Pt nanoparticles show relatively high catalytic performance due to its (110) and (100) planes. Likewise, it is confirmed that the two-step reduction of Pt(Ⅳ) is controlled by diffusion process and electrochemical process together. However, the catalytic performance should be improved further. It′s necessary to optimize the electrodeposition process of the Pt nanoparticles in the further research.
-
-
[1]
Antoniassi R M, Otubo L, Vaz J M, et al. J. Catal., 2016, 342:67-74 doi: 10.1016/j.jcat.2016.07.022
-
[2]
Pullamsetty A, Sundara R. J. Colloid Interface Sci., 2016, 479:260-270 doi: 10.1016/j.jcis.2016.06.069
-
[3]
Zhang J, Yi X B, Liu S, et al. J. Phys. Chem. Solids, 2017, 102:99-104 doi: 10.1016/j.jpcs.2016.11.006
-
[4]
Pajić M N K, Stevanović S I, Radmilović V V, et al. J. Solid State Electrochem., 2016, 20(12):3405-3414 doi: 10.1007/s10008-016-3319-z
-
[5]
Chu Y Y, Wang Z B, Gu D M, et al. J. Power Sources, 2010, 195:1799-1804 doi: 10.1016/j.jpowsour.2009.10.039
-
[6]
Bharti A, Cheruvally G, Muliankeezhu S. Int. J. Hydrogen Energy, 2017, 42(16):11622-11631 doi: 10.1016/j.ijhydene.2017.02.109
-
[7]
Liu S, Wang J Q, Zeng J, et al. J. Power Sources, 2010, 195(15):4628-4633 doi: 10.1016/j.jpowsour.2010.02.024
-
[8]
Hsieh C T, Wei J M, Lin J S, et al. Catal. Commun., 2011, 16(1):220-224 doi: 10.1016/j.catcom.2011.09.030
-
[9]
Ye F, Wang T T, Li J J, et al. J. Electrochem. Soc., 2009, 156(8):B981-B985 doi: 10.1149/1.3151868
-
[10]
Ruengkit C, Tantavichet N. Thin Solid Films, 2017, 636(31):116-126
-
[11]
Zhang Y Y, Li F P, Liu X Q, et al. Electrochim. Acta, 2017, 242:165-172 doi: 10.1016/j.electacta.2017.05.020
-
[12]
Hussain S, Erikson H, Kongi N, et al. Int. J. Hydrogen Energy, 2017, 42(9):5958-5970 doi: 10.1016/j.ijhydene.2016.11.164
-
[13]
Alexeeva O K, Fateev V N. Int. J. Hydrogen Energy, 2016, 41(5):3373-3386 doi: 10.1016/j.ijhydene.2015.12.147
-
[14]
Fouda-Onana F, Guillet N, AlMayouf A M. J. Power Sources, 2014, 271:401-405 doi: 10.1016/j.jpowsour.2014.08.031
-
[15]
Endres F, Bukowski M, Hempelmann R, et al. Angew. Chem. Int. Ed., 2003, 42(29):3428-3430 doi: 10.1002/anie.200350912
-
[16]
Abbott A P, McKenzie K J. Phys. Chem. Chem. Phys., 2006, 8(37):4265-4279 doi: 10.1039/b607329h
-
[17]
He P, Liu H T, Li Z Y, et al. J. Electrochem. Soc., 2005, 152(4):E146-E153 doi: 10.1149/1.1870754
-
[18]
Yu P, Qian Q, Wang X, et al. J. Mater. Chem., 2010, 20(28):5820-5822 doi: 10.1039/c0jm01293a
-
[19]
Zhang D, Chang W C, Okajima T, et al. Langmuir, 2011, 27(23):14662-14668 doi: 10.1021/la202992m
-
[20]
Giordano N, Passalacqua E, Pino L, et al. Electrochim. Acta, 1991, 36(13):1979-1984 doi: 10.1016/0013-4686(91)85082-I
-
[21]
Solla-Gullón J, Vidal-Iglesias F J, Rodriguez P, et al. J. Phys. Chem. B, 2004, 108(36):13573-13575 doi: 10.1021/jp0471453
-
[22]
Markovic N, Gasteiger H, Ross P N. J. Electrochem. Soc., 1997, 144(5):1591-1597 doi: 10.1149/1.1837646
-
[23]
Wang C, Daimon H, Onodera T, et al. Angew. Chem. Int. Ed., 2008, 47(19):3588-3591 doi: 10.1002/(ISSN)1521-3773
-
[24]
Markovic N M, Gasteiger H A, Ross Jr P N. J. Phys. Chem., 1995, 99(11):3411-3415 doi: 10.1021/j100011a001
-
[25]
Xiaowei Y, Maozhong A, Yunwang Z, et al. Electrochim. Acta, 2011, 58:516-522 doi: 10.1016/j.electacta.2011.09.078
-
[26]
杨潇薇, 张云望, 安茂忠, 等.无机化学学报, 2012, 28(12):2617-2625 http://www.wjhxxb.cn/wjhxxbcn/ch/reader/view_abstract.aspx?file_no=20121218&flag=1YANG Xiao-Wei, ZHANG Yun-Wang, AN Mao-Zhong, et al. Chinese J. Inorg. Chem., 2012, 28(12):2617-2625 http://www.wjhxxb.cn/wjhxxbcn/ch/reader/view_abstract.aspx?file_no=20121218&flag=1
-
[27]
Jayakumar M, Venkatesan K A, Srinivasan T G. Electrochim. Acta, 2007, 52(24):7121-7127 doi: 10.1016/j.electacta.2007.05.049
-
[1]
-

Figure 1 SEM images of the Pt nanoparticles obtained in [DEME][BF4] containing 30 mmol·L-1 H2PtCl6 by potentiostatic electrodeposition at 60 ℃ for 600 s with different potentials
(a)-2.0 V; (b)-2.5 V; (c)-2.8 V; (d) -3.0 V

Figure 2 SEM images of the Pt nanoparticles obtained in [DEME][BF4] containing 30 mmol·L-1 H2PtCl6 by potentiostatic electrodeposition with -2.5 V at 60 ℃ for different times
(a) 120 s; (b) 300 s; (c) 480 s; (d) 600 s

Figure 3 Transmission electron microscopy and size distribution of the Pt nanoparticles obtained in [DEME][BF4] containing 30 mmol·L-1 H2PtCl6 by potentiostatic electrodeposition at 60 ℃ for 480 s with different potentials
(a)-2.5 V; (b)-3.0 V; (c)-2.5 V; (d) -3.0 V

Figure 4 HRTEM images and SAED patterns of Pt nanoparticles obtained in [DEME][BF4] containing 30 mmol·L-1 H2PtCl6 by potentiostatic electrodeposition with -2.5 V at 60 ℃ for 480 s

Figure 5 Cyclic voltammogram curve of GC/Pt electrode obtained in [DEME][BF4] containing 30 mmol·L-1 H2PtCl6 by potentiostatic electrodeposition at -2.5 V (vs Pt) in 0.5 mol·L-1 H2SO4 with a scan rate of 50 mV·s-1

Figure 6 Cyclic voltammograms of the GC electrode in different electrolytes at 60 ℃ with a scan rate of 50 mV·s-1
(a) [DEME][BF4]; (b) [DEME][BF4] containing 30 mmol·L-1 H2PtCl6
-


 下载:
下载:


 扫一扫看文章
计量
- PDF下载量: 9
- 文章访问数: 1563
- HTML全文浏览量: 129
 下载:
下载:
