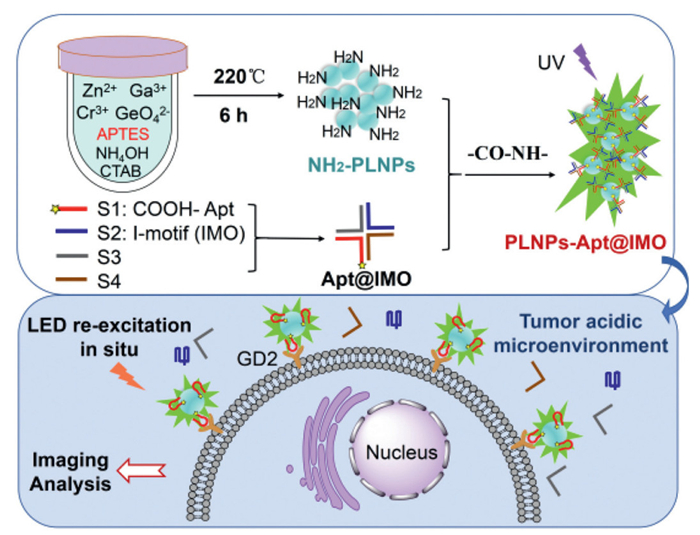
Scheme 1.
Schematic illustration of the synthesis and working mechanism of PLNPs-Apt@IMO and its application in tumor imaging.

DNA-modified persistent luminescent nanoparticles with enhanced dispersion and targeting: A pH-activated nanoprobe for logic-gated tumor molecular imaging
Qionglin Wang , Qiyan Lv , Yang Zhou , Weyland Cheng , Minghui Hu , Xiangzhan Zhu , Yaodong Zhang , Wancun Zhang


Disialoganglioside (GD2), a glycosphingolipid that contains sialic acid, is primarily expressed on the surface of malignant tumor cells originating from neuroectoderm. It exhibits abnormally high expression in various cancers, including neuroblastoma, melanoma, small cell lung cancer, osteosarcoma, and breast cancer (especially triple-negative breast cancer) [1–5]. It is closely related to tumor invasiveness, metastasis, and treatment resistance. Given the pronounced levels of GD2 expression, it has emerged as a critical target for immunotherapy in malignant tumors, particularly in neuroblastoma [6,7]. As a tumor-associated antigen in various tumor types, GD2 holds significant value in treatment, diagnosis, and intraoperative navigation. In terms of GD2-targeted imaging, significant breakthroughs have also been achieved. For example, a dual-labeled (radioisotope and fluorescence) anti-GD2 probe was developed for detecting small lesions and enabling precise intraoperative navigation in 2024 [1]. Molecular imaging technology has emerged as a key focus in malignant tumor research [8–12]. However, the shortage of effective targeted probes continues to pose challenges for early imaging diagnosis.
In view of ongoing research, many scientists are developing new imaging probes to improve accuracy and sensitivity in tumor imaging [13–15]. The advantages of optical imaging modalities include high sensitivity, no radiation, and low cost. Persistent luminescent nanoparticles (PLNPs) with near-infrared (NIR) luminescence can emit light continuously within the NIR optical imaging window. They remain luminescent for hours, or even tens of hours, after the excitation light is turned off. This allows for enhanced tissue penetration and minimizes the interference from tissue autofluorescence, thus improving the signal-to-noise ratio and sensitivity of biological imaging [16–21]. Since 2014, reports of Cr3+-doped gallium germanate have significantly advanced the application of PLNPs in clinical imaging. Their synthesis method is straightforward, operates under mild conditions, and produces uniformly sized particles [22,23]. However, their dispersibility remains unsatisfactory, and most do not carry functional groups. Our team's previous research found that adding aminopropyl triethoxysilane (APTES) to the hydrothermal synthesis reaction system can achieve a one-step synthesis of Cr3+-doped amino-modified PLNPs (PLNPs-NH2) with significantly enhanced NIR luminescence intensity and inherent amines. Furthermore, after multiple excitations in vivo with orange/red LED lights, they exhibited good long-term tracking performance in living organisms [24]. However, their dispersibility is still insufficient, and they lack targeting specificity.
Currently, aptamers demonstrate superior performance due to their high affinity, specificity, flexibility, stability in chemical modifications, multifunctionality, controllability, and low immunogenicity [25,26]. This makes them highly applicable in targeted imaging and drug delivery [27,28]. However, many specific antigens or molecules are not only found on tumor cells but also have low or similar expression levels in some healthy tissues. For example, GD2 is normally expressed at low levels in the central nervous system, peripheral nervous system, and skin melanocytes, and it participates in cell signaling, adhesion, and neurodevelopment [29,30]. As a result, the specificity of aptamer targeting for tumors is inadequate in this context. Research shows that aptamers exhibit pH-activated behavior in the tumor microenvironment after binding to Ⅰ-motif (IMO) structures, which enhances their targeting specificity [31,32]. This strategy offers a novel approach to enhance the targeting specificity of imaging probes in both cells and tumor tissues. By exploiting the unique acidic microenvironment of tumor tissues, we can use the GD2 molecule, which is overexpressed on neuroblastoma cell membranes [7,33], as a target to design pH-activated GD2-targeting nanoprobes. This approach distinguishes between target and non-target cells with the same receptor, enhances the specific uptake and accumulation of the probes in neuroblastoma, and reduces toxicity to healthy tissues.
In this study, we developed a pH-activated nanoprobe (PLNPs-Apt@IMO), which combines the GD2 aptamer, the IMO structure, and persistent luminescent nanoparticles to enhance targeting imaging functionality, achieving high sensitivity and specificity in neuroblastoma imaging. DNA serves two key functions: To enhance the dispersion of PLNPs and to improve the probe's targeting specificity. Scheme 1 illustrates the preparation and working principle, showing how the GD2 aptamer, IMO sequence, and two complementary sequences are synthesized into an Apt@IMO complex via one-step self-assembly. Subsequently, the Apt@IMO is covalently attached to the surface of PLNPs-NH2, which are synthesized using a hydrothermal method through amide bonds. This probe is easy to prepare, has strong targeting capabilities and dual-mode imaging performance (fluorescence and NIR luminescence), and provides persistent imaging signals, demonstrating significant clinical application potential. Specifically, the IMO sequence, composed of cytosine-rich sequences, remains stable in the neutral pH environment of normal tissues and forms a stable complex with the GD2 aptamer, preventing the aptamer from undergoing conformational changes to bind to GD2 molecules expressed at low levels in normal tissues. However, in the acidic microenvironment of tumors, the IMO sequence is protonated, triggering the formation of a quadruple folding structure. This conformational transition disrupts the original complex formed with the aptamer, enabling the GD2 aptamer to restore its specific recognition conformation and specifically bind to GD2 molecules overexpressed on tumor cells. Then, imaging analysis can be conducted through ultraviolet (UV) excitation and in situ re-excitation using LED lights. This nanoprobe we developed has improved dispersibility and stability, along with reduced cell toxicity. It enhances the targeting specificity for tumors by triggering aptamer affinity through the tumor microenvironment, achieving superior imaging performance in neuroblastoma.
PLNPs-NH2 were synthesized using the hydrothermal method. Fig. 1A-Ⅰ shows transmission electron microscope (TEM) image revealing that the synthesized PLNPs form highly uniform nanospheres approximately 10 nm in diameter. Additionally, the particle size distribution shown in Fig. S1A (Supporting information) follows a normal distribution. The high-resolution TEM (HRTEM) images of the PLNPs display the (111) and (311) lattice planes of spinel zinc gallogermanate, with lattice fringe distances of 4.81 Å and 2.54 Å, respectively (Fig. 1A-Ⅱ) [23,34]. The energy-dispersive X-ray spectroscopy (EDS) results in Fig. 1B confirm that PLNPs contain Zn, Ga, Ge, and Cr elements. Additionally, the element distribution is relatively uniform. Fig. S1B (Supporting information) illustrates that the X-ray diffraction (XRD) patterns of PLNPs closely match the standard data for ZnGa2O4 (JCPDS No. 38–1240). These results indicate that adding APTES and CTAB has not altered the structural properties of the host, which retains strong crystallinity.

Figs. 1C and D illustrate the best excitation and emission spectra of the PLNPs suspension. At an excitation wavelength of 254 nm, three emission bands are observed in the visible and NIR region at 510, 710, and 760 nm. The 510 nm emission (visible range) provides a strong signal for high-resolution fluorescence imaging, which is critical for validating probe localization in cells. The emissions at 710 and 760 nm (NIR range) serve as the basis for NIR imaging. NIR light exhibits deep tissue penetration and minimal auto-fluorescence interference, enabling in vivo tracking of probe accumulation in tumors [35,36]. At an excitation wavelength of 365 nm, only one emission band is observed in the NIR region at 730 nm, further confirming the NIR luminescence stability of PLNPs. The results indicate that the synthesized PLNPs have good imaging potential when excited by UV light. This potential applies to both the visible spectrum (for fluorescence imaging) and the NIR spectra (for NIR imaging), laying a solid foundation for subsequent in vitro and in vivo dual-mode imaging. Following a 5 min pre-excitation with composite UV light at 254 and 365 nm, strong fluorescence and NIR luminescence were observed. Fig. 1E shows the decay images of fluorescence (Inset Ⅰ) and NIR luminescence (Inset Ⅱ) for PLNPs powder and suspension. And Fig. 1F shows the corresponding intensity decay curves of fluorescence (Inset Ⅰ) and NIR luminescence (Inset Ⅱ) for PLNPs powder and suspension. These phenomena lasted over 6 h, highlighting their potential for dual-mode and long-term imaging. Moreover, statistical results show that both fluorescence and NIR luminescence signals rapidly decay during the first 1.5 h and then tend to stabilize. This signal trend may result from the competition among multiple excited-state relaxation pathways or from changes in dynamic energy and electron transfer efficiencies [37,38].
Overall, the synthesized PLNPs-NH2 demonstrate good dispersion, narrow particle size distribution, strong fluorescence and NIR luminescence dual-mode imaging, persistent luminescence time, and chemical stability, providing a solid foundation for targeted imaging.
The effectiveness of targeted imaging relies on the expression level of GD2. Therefore, we analyzed the expression of GD2 on the surface of the SK-N-AS cell line using flow cytometry. The detection results after incubation with FITC-labeled GD2 antibodies are shown in Figs. S2A and B (Supporting information), indicating significant expression of GD2 and a high GD2 positive rate in this cell line. Thus, SK-N-AS cells, known for its high GD2 expression, are selected for subsequent imaging analyses involving both cellular and animal studies. Several publications have reported studies on GD2 aptamers [39,40]. Building on previous studies of GD2 aptamers, we validated their affinity for SK-N-AS cells using BLI and ultimately selected a 46-base GD2 aptamer. The affinity and specificity results of the GD2 aptamer for SK-N-AS are presented in Figs. S2C and D (Supporting information). As the concentration of SK-N-AS cells increased from 3.75 × 10⁴ cells/mL to 75 × 104 cells/mL, the response signal increased linearly, consistent with the dynamic model analysis equation [41]. It confirmed the high affinity of the GD2 aptamer for GD2-positive (GD2+) cells. Furthermore, at the same concentration, the binding response signal of this GD2 aptamer to GD2+ cells (SK-N-AS and BM-17) was significantly higher than that to GD2-negative (GD2-) cells (293T, MCF-7, and A549).
In addition, we used the Molecular Operating Environment modeling package (MOE) to model the interaction between the GD2 aptamer and GD2 molecules in order to further elucidate their binding mechanism. According to the fitting results shown in Fig. S2E (Supporting information), the tertiary structure of the GD2 aptamer appears as a single-stranded DNA helix with a hairpin structure at the tail (orange band). The GD2 molecule (ball-and-stick) is encapsulated within the core of the aptamer's tertiary structure. This interaction forms a relatively stable GD2@Apt complex through intermolecular forces, with the gray mesh area representing the binding interface between the two molecules. The main intermolecular interactions are shown in Fig. S2F (Supporting information). The 25th-27th bases (CCA) of the aptamer sequence and the 42nd base (C) tightly bind to the side chains and backbone of the adjacent GD2 molecule. The latter acts as an electron donor to maintain the stability and functionality of the complex through interactions such as hydrogen bonding.
Based on the above results, we designed a functional DNA nanostructure-Apt@IMO, which exploits the affinity of the GD2 aptamer and the acidic pH-sensitive response of the IMO sequence. The mechanisms of assembly and response are illustrated in Fig. 2A. We added an 8-base extension to the 3′ end of the GD2 aptamer to create the GD2 Apt-Linker (S1). This linker interacts with the IMO sequence (S2) and two complementary sequences (S3 and S4) to assemble a DNAtet. In an acidic environment, the IMO sequence rapidly folds into a quadruple structure, which disrupts the tetramer's stability. This causes the release of the two complementary sequences, S3 and S4. Consequently, the GD2 aptamer forms a monomer that specifically binds to GD2 molecules, enhancing the probe's accumulation at the tumor site.
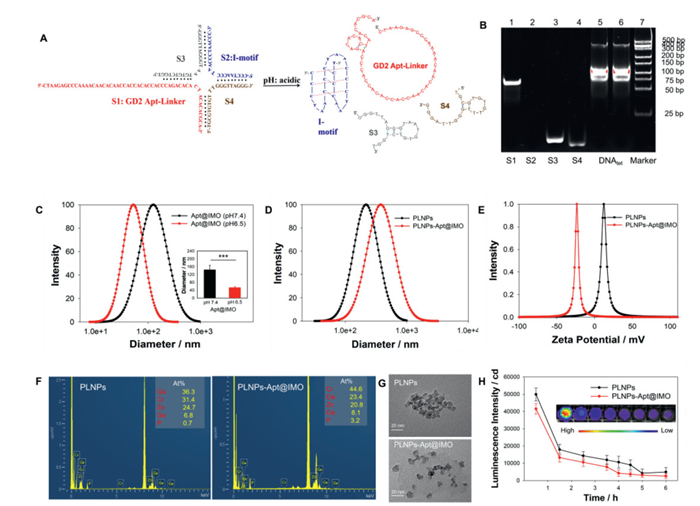
Subsequently, the electrophoresis results shown in Fig. 2B were used to verify the successful synthesis of the Apt@IMO nanostructure. In Fig. 2B, bands 5 and 6 represent the Apt@IMO complex product, namely DNAtet, which migrates significantly slower than the single-stranded bands 1 (S1), 2 (S2), 3 (S3), and 4 (S4). This result proves the successful synthesis of the DNA nanostructure-Apt@IMO. It is worth noting that band 2, which corresponds to the IMO sequence, showed almost no coloration. This may be due to the high cytosine content in the IMO sequence, resulting in insufficient insertion of the nucleic acid dye [42]. To validate this hypothesis, we conducted further experiments. The results are shown in Fig. S3 (Supporting information). The electrophoretic mobilities of bands 4 (S2@S3 complex) and 5 (S2@S4 complex) were significantly lower than those of bands 2 (S3) and 3 (S4), confirming the incorporation of the IMO sequence. However, the S2 sequence still showed no coloration. This result is consistent with previous literature, indicating that a high proportion of cytosine affects the amount of nucleic acid dye incorporation.
To verify the acidic pH-triggered dissociation property of Apt@IMO in vitro, we measured the hydrodynamic diameter of Apt@IMO nanostructure under neutral and mildly acidic conditions. The results are shown in Fig. 2C. At the neutral pH of 7.4, the hydrodynamic diameter of Apt@IMO was recorded at 139 ± 33 nm. Conversely, At the mildly acidic pH of 6.5, there was a notable reduction in the hydrodynamic diameter, which decreased to 52 ± 5 nm. These findings suggest that the Apt@IMO nanostructure undergoes dissociation in mildly acidic environments, thereby providing evidence that Apt@IMO can be activated by acidic pH. Moreover, by comparing the membrane binding signals of PLNPs-Apt@IMO in GD2-positive SK-N-AS cells cultured in normal medium (pH 7.4) and acidic medium (pH 6.5–6.8) (Fig. S4 in Supporting information), the results demonstrated that in neutral medium, the probes were sparsely distributed on the cell membrane and were also detectable in the cytoplasm and nucleus. In contrast, under acidic conditions, the majority of the probes localized predominantly to the cell membrane, with minimal presence observed in the cytoplasm and nucleus. This distribution pattern is attributable to the acid-dependent dissociation of IMO, which enhances the binding affinity of the aptamer. These findings further confirm the pH-activated behavior of Apt@IMO at the cellular level. In summary, the experimental results in this section fully demonstrate the feasibility of DNAtet synthesis and pH-activated functional response.
In order to obtain persistent luminescence nanoprobes with high tumor targeting, the GD2 aptamer is modified with carboxyl groups (–COOH) at the 5′ end. It then forms amide bonds (–CO–NH–) with the amino groups (–NH2) on the surface of PLNPs through a condensation reaction, resulting in the synthesis of the PLNPs-Apt@IMO complex. To prove that Apt@IMO was successfully modified on the surface of PLNPs, we characterized the hydrodynamic size and surface charge before and after Apt@IMO modification. After Apt@IMO modification on the surface of PLNPs, the hydrodynamic size increased from 218 nm to 378 nm (Fig. 2D), and the surface charge changed from +12.20 mV to −23.55 mV (Fig. 2E). The change in surface charge is mainly due to the large number of phosphate groups carried by DNA. In addition, the EDS results in Fig. 2F show that after conjugating the Apt@IMO complex, the atomic percentage (at%) of phosphorus (P) increased from 0.7% to 3.2%. These changes confirm the successful synthesis of the PLNPs-Apt@IMO complex. Moreover, TEM results in Fig. 2G show that the dispersion significantly improved after Apt@IMO modification of the surface of PLNPs. This indicates that functional DNA modification further enhances the dispersibility of nanomaterials. This improvement benefits the homogeneity of probe binding in subsequent cell experiments and prolongs the circulation time of probes in mice.
To quantitatively analyze the amount of Apt@IMO conjugated onto PLNPs, we measured the fluorescence response curve of Cy3-labeled GD2 aptamer at different concentrations and constructed a corresponding standard curve, as shown in Fig. S5 (Supporting information). Then, we measured the signal intensity of Cy3 in the supernatant of the reaction solution before and after synthesis of PLNPs-Apt@IMO, and determined that the concentration of GD2 aptamer modified on every 5 mg of PLNPs is 2.64 µmol/L. Furthermore, we measured the NIR luminescence intensity and duration of the synthesized product PLNPs-Apt@IMO, and the results are shown in Fig. 2H. Compared to PLNPs, modification with DNA molecules on the surface of PLNPs did not significantly affect luminescence intensity or duration. This result further confirms the persistent luminescence stability of the material.
Our PLNPs have intrinsic properties for high-performance imaging. Under 254 nm excitation, 510 nm (visible) emission supports high-resolution cellular imaging, while 710/760 nm (NIR) emission enables deep-tissue in vivo imaging (avoiding autofluorescence). However, unmodified PLNPs lack targeting, they are non-specifically taken up by both GD2+ SK-N-AS and GD2− 293T cells, limiting tumor-specific use. Apt@IMO modification brings molecular-level advantages. (1) Enhanced targeting: The GD2 aptamer (46-base) binds GD2 with high affinity, enabling active recognition of GD2+ cells. (2) Improved specificity: The IMO acts as a pH switch. At normal pH (~7.4), it forms a stable complex with the aptamer (preventing off-target binding to low-GD2 normal cells); at tumor pH (~6.5), it folds into a quadruple structure (hydrodynamic diameter reduced to 52 ± 5 nm), releasing the aptamer to bind tumor GD2.
To investigate the imaging performance of the probe PLNPs-Apt@IMO in live cells, we first analyzed the fluorescence imaging locations of PLNPs in two cell lines, SK-N-AS and 293T. The results in Fig. 3A showed that the distributions of unmodified PLNPs without functional DNA were the same in both cell types, uniformly distributed in the cytoplasm of the cells, likely taken up indiscriminately by the cells through endocytosis. Then, we incubated the SK-N-AS cells with Cy3-labeled non-targeted probe PLNPs-DNA-Cy3 and targeted probe PLNPs-Apt-Cy3. After 1 h of incubation, significant fluorescence co-localization signals were observed in both cell types, but their distribution showed clear differences in location. The confocal imaging results are shown in Fig. 3B. The non-targeted probe PLNPs-DNA-Cy3 is uniformly distributed across the cell membrane and cytoplasm, indicating its non-specificity. In contrast, the targeted probe PLNPs-Apt-Cy3 is mainly distributed on the cell membrane of SK-N-AS cells, with very little distribution in the cytoplasm. In addition, we used the Dil membrane staining method to study the imaging performance of the nanoprobe PLNPs-Apt@IMO in SK-N-AS cells. This was done to further verify the probe's targeting ability and its distribution within the cells. The results are shown in Fig. 3C, where the fluorescence signal of PLNPs is mainly concentrated on the cell membranes, rather than in the cytoplasm or nucleus. This result is consistent with the imaging performance of the targeting probe PLNPs-Apt-Cy3 shown in Fig. 3B, because GD2 molecules are highly expressed on the cell membranes of SK-N-AS. In summary, the probe PLNPs-Apt@IMO was successfully synthesized and effectively distinguishes GD2-positive tumor cells from normal cells without requiring additional reagents.
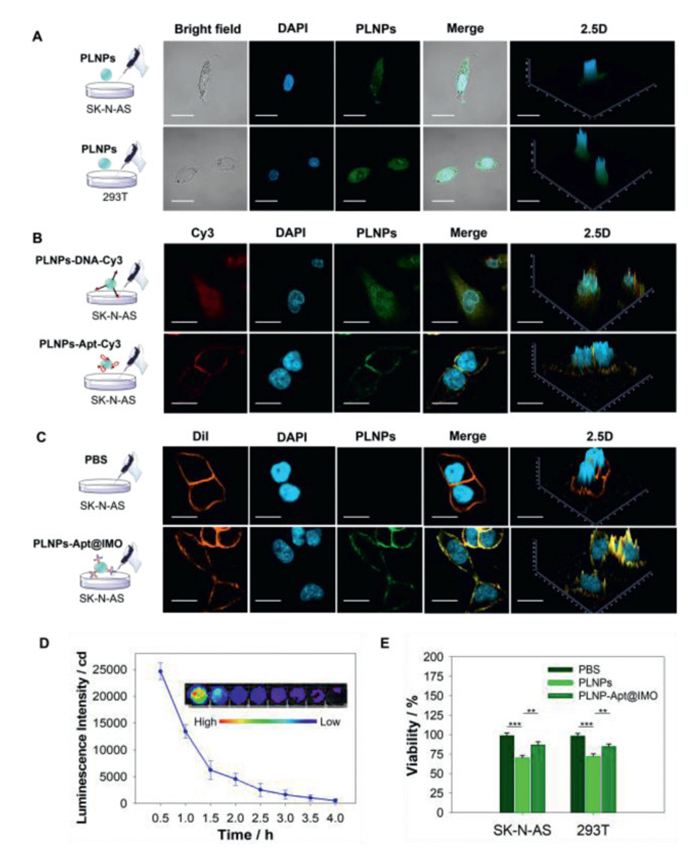
Afterwards, we analyzed the persistent luminescence performance of the PLNPs-Apt@IMO nanoprobe after incubation with cells, and the results are shown in Fig. 3D. The probe at a concentration of 1 mg/mL showed a decrease in NIR luminescence intensity and duration after incubation with cells and UV excitation. This decrease due to the lower probe concentration during cell incubation. however, it does not affect the probe's imaging performance in cell experiments. Moreover, at lower concentrations, the probe still maintained strong persistent luminescence for up to 2 h. Then, we analyzed the cytotoxicity of the probes PLNPs and PLNPs-Apt@IMO on SK-N-AS and 293T cell lines, and the results are shown in Fig. 3E. At a probe concentration of 1 mg/mL, after 2 h of incubation, the mortality rate of cells treated with PLNPs reaches over 30%, indicating significant toxicity. However, after incubation with the functionally modified DNA-based nanoprobes PLNPs-Apt@IMO, the resulting cell mortality rate was reduced to below 15%. This result indicates that the nanoprobes PLNPs-Apt@IMO possess relatively good cell compatibility.
Based on the success of live cell imaging, the targeted imaging performance of nanoprobes PLNPs-Apt@IMO was explored in vivo. All animal research conducted in this study received approval from the Animal Care and Use Committee of Zhengzhou University, and all experimental procedures adhered to the ARRIVE guidelines. Tumors grown for 21 days were used for in vivo imaging. Fig. 4A presents the time points for pre-excitation duration, injection time, imaging time, and re-excitation time for both the control and experimental groups. Whole-body NIR luminescence imaging of tumor-bearing mice was performed by intraperitoneal injection of nanoprobes. As shown in Fig. 4B, the probe excited by UV light was injected into the abdominal cavity. Five minutes later, a strong luminescence signal rapidly appeared in this area. In contrast, no NIR luminescence signal appeared in the abdominal cavity of saline-injected mice. This result demonstrates that NIR luminescence imaging effectively avoids autofluorescence interference, which in turn improves the sensitivity of biological imaging. Subsequently, the NIR luminescence signal intensity in the abdominal cavity of the non-targeted PLNPs group, targeted PLNPs-Apt group, and PLNPs-Apt@IMO group continuously declined over 30 min. Afterward, re-exciting the probes with orange light caused a significant increase in NIR luminescence intensity in the abdominal cavity, confirming their persistent luminescence re-excitation capability. After 60 min, a strong NIR luminescence signal could be observed in the tumor area, indicating that all three probes had differing levels of tumor targeting ability. As shown in Fig. S6 (Supporting information), the signal intensities at the tumor site following re-irradiation were also monitored at 60, 70, 80, and 90 min post-injection of different probes, all exhibiting a gradual increasing trend. Notably, PLNPs-Apt@IMO displayed the most rapid signal enhancement, indicating its superior targeting efficiency. The PLNPs-Apt@IMO probe exhibited the highest luminescence intensity in the tumor area at this time point, indicating its superior tumor-specific accumulation and targeting ability. Morover, for the non-targeted PLNPs group, the weak but detectable tumor signal mainly relies on the EPR effect. This passive targeting lacks specificity, resulting in low signal intensity and poor discrimination from normal tissues. In contrast, the PLNPs-Apt group and PLNPs-Apt@IMO group exhibit significantly stronger tumor signals, which originate from the synergy of EPR effect and active targeting by the GD2 aptamer. The GD2 aptamer guiding the probe to specifically attach to tumor cells and complements the EPR effect, leading to higher tumor accumulation than non-targeted PLNPs. Notably, the PLNPs-Apt@IMO group shows the strongest tumor signal, which confirms that the IMO structure further enhances active targeting.
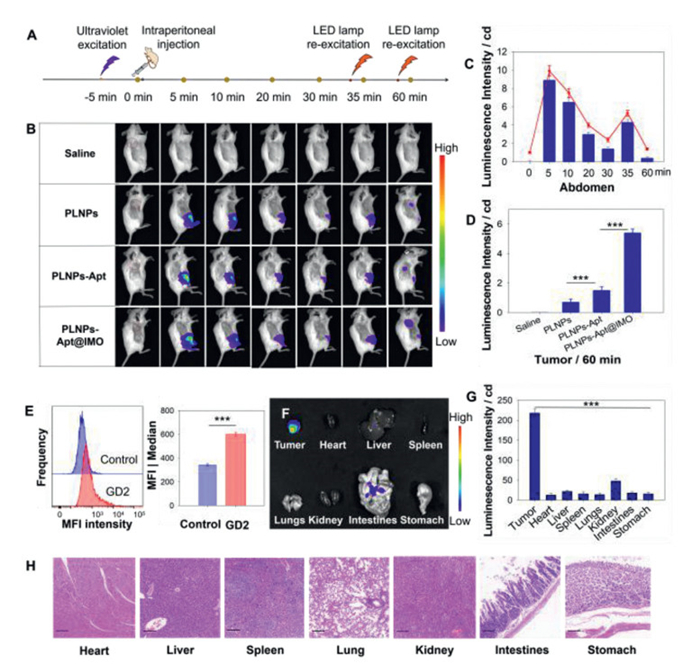
To facilitate comparison, we quantitatively analyzed the NIR luminescence intensity changes in the abdominal cavity over 60 min, as well as the NIR luminescence intensity of the tumor at 60 min, as shown in Figs. 4C and D. Over time, the NIR luminescence intensity in the abdominal cavity gradually decreased but showed a significant recovery after LED re-excitation. In the tumor region, the NIR luminescence intensity of the probe PLNPs-Apt@IMO increased over threefold compared to the probe PLNPs-Apt and over sixfold compared to the probe PLNPs. This effect is likely due to the acidic-pH activation characteristics of IMO, which enhance probe utilization and promote greater tumor-targeted accumulation, thereby strengthening tumor-targeting capability. The accumulation and images of the PLNPs in the tumor region are mainly attributed to the enhanced permeability and retention (EPR) effect of nanomaterials within tumors. However, its NIR luminescence intensity is very low, indicating insufficient targeting ability.
In addition, we analyzed the GD2 expression in ex vivo tumor tissue utilizing flow cytometry. The results are illustrated in Fig. 4E, indicating a higher GD2 expression level in tumor tissue. The findings support the conclusion that the elevated NIR luminescence detected in the tumor is predominantly attributed to the higher proportion of GD2+ cells present within the tumor.
To investigate the biodistribution of PLNPs-Apt@IMO in major organs, the mice were euthanized for ex vivo organ imaging. Fig. 4F shows that PLNPs-Apt@IMO are primarily distributed in the tumor, which can be easily distinguished from other organs by the significant difference in NIR luminescence intensity, consistent with the findings from in vivo imaging. Quantitative statistics of tumor-to-background ratio (TBR) is exhibited in Fig. 4G. These results confirm that PLNPs-Apt@IMO achieves superior imaging contrast between tumors and major organs after re-excitation, which is attributed to the pH-activated targeting enhancement by the IMO structure. The safety of PLNPs-Apt@IMO in isolated organs was verified by hematoxylin-eosin staining (H&E). The results showed that PLNPs-Apt@IMO uptake did not cause structural changes in the heart, liver, spleen, lung, kidney, intestine, and stomach tissues, indicating that intraperitoneal injection of PLNPs-Apt@IMO is safe for in vivo tissues and organs (Fig. 4H). In summary, the injection of nanoprobe PLNPs-Apt@IMO enables rapid and sensitive NIR luminescence imaging of tumors and has the potential to serve as a contrast agent to assist in tumor resection.
In summary, we successfully developed a pH-activated dual-mode imaging nanoprobe, PLNPs-Apt@IMO, for targeted-specific imaging of the neuroblastoma molecular marker GD2. This innovative probe combines the persistent luminescence properties of PLNPs with the GD2-targeting specificity of GD2 aptamers and the pH-responsive conformational switch of IMO sequence, enabling high-contrast imaging in both cellular and animal models. Key innovations include: NH2-PLNPs (~10 nm) synthesized through hydrothermal synthesis, exhibiting strong fluorescence and persistent NIR luminescence for over 6 h. The covalent conjugation of Apt@IMO further improved colloidal stability and reduced cytotoxicity, maintaining cell viability above 85%. Additionally, the probe demonstrates tumor microenvironment-triggered targeting: Under acidic conditions (pH~6.5), the IMO structure undergoes a quadruplex transition, releasing the GD2 aptamer to specifically bind to GD2+ cells. This pH-sensitive activation significantly enhances tumor accumulation, with in vivo signal intensity showing that PLNPs-Apt@IMO achieved threefold and sixfold stronger signals compared to PLNPs-Apt and PLNPs, respectively. Furthermore, in vivo studies confirmed the probe's capability to distinguish tumors from normal tissues, exhibiting deep-tissue penetration and no autofluorescence interference. Ex vivo organ imaging and H&E staining further validated its biosafety and tumor specificity. Although clinical validation is still pending, PLNPs-Apt@IMO presents a promising strategy for tumor location and intraoperative navigation of GD2+ malignant tumor, such as neuroblastoma. Future research will focus on optimizing pharmacokinetics and exploring applications for therapeutic co-delivery.
Qionglin Wang: Writing – review & editing, Writing – original draft, Methodology, Investigation, Funding acquisition, Data curation, Conceptualization. Qiyan Lv: Resources, Methodology. Yang Zhou: Resources, Methodology. Weyland Cheng: Writing – review & editing. Minghui Hu: Data curation. Xiangzhan Zhu: Methodology. Yaodong Zhang: Supervision. Wancun Zhang: Supervision, Resources, Funding acquisition, Conceptualization.
All authors declare that they have no known competing financial interests or personal relationships that could have appeared to influence the work reported in this paper.
This work were funded by National Natural Science Foundation of China (No. 32201237), Scientific and Technological Projects of Henan Province (No. 242102311160), Key Scientific Research Projects of Higher Education Institutions in Henan Province (No. 24B320025).
Supplementary material associated with this article can be found, in the online version, at doi:
L.T. Rosenblum, R.E. Sever, R. Gilbert, et al., J. Transl. Med. 22 (2024) 940. doi: 10.1186/s12967-024-05728-0
I.I. Doronin, P.A. Vishnyakova, I.V. Kholodenko, et al., BMC Cancer 14 (2014) 295. doi: 10.1186/1471-2407-14-295
S. Kinoshita, M. Ishii, J. Ando, et al., Cancer Res. 4 (2024) 723–737. doi: 10.1158/2767-9764.crc-23-0259
E.R. Butch, P.E. Mead, V.A. Diaz, et al., Cancer Res. 79 (2019) 3112–3124. doi: 10.1158/0008-5472.can-18-3340
C.M. Seitz, S. Schroeder, P. Knopf, et al., Oncoimmunology 9 (2020) 1683345. doi: 10.1080/2162402X.2019.1683345
F. Navid, V.M. Santana, R.C. Barfield, Curr. Cancer Drug Tar. 10 (2010) 200–209. doi: 10.2174/156800910791054167
B. Nazha, C. Inal, T.K. Owonikoko, Front. Oncol. 10 (2020) 1000. doi: 10.3389/fonc.2020.01000
L.J. Feng, S.Q. Li, C.R. Wang, et al., Semin. Nucl. Med. 53 (2023) 517–529. doi: 10.1053/j.semnuclmed.2022.12.004
M.X. Zhang, Y.Y. Zhang, X.W. Zhang, et al., Chem. Eng. J. 489 (2024) 151226. doi: 10.1016/j.cej.2024.151226
W. Zhou, D. He, N. Liu, et al., Chin. Chem. Lett. 36 (2025) 110854. doi: 10.1016/j.cclet.2025.110854
H. Liu, Q. Sun, M. Dong, et al., Chin. Chem. Lett. 37 (2026) 111655. doi: 10.1016/j.cclet.2025.111655
H. Lei, J. Zhou, Y. Han, et al., Chin. Chem. Lett. 37 (2026) 111737. doi: 10.1016/j.cclet.2025.111737
Z.Y. Jiang, C.L. Zhang, Q. Sun, et al., Angew. Chem. Int. Ed. 63 (2024) e202320072. doi: 10.1002/anie.202320072
W.C. Zhang, Z.Z. Tian, P. Zhang, et al., Chem. Eng. J. 517 (2025) 164581. doi: 10.1016/j.cej.2025.164581
J. Qiu, Y.C. Wu, Y.C. Wang, et al., J. Am. Chem. Soc. 135 (2013) 38–41. doi: 10.1021/ja309392x
H.X. Zhao, G. Shu, J.Y. Zhu, et al., Biomaterials 217 (2019) 119332. doi: 10.1016/j.biomaterials.2019.119332
M.H. Sun, M. Chen, J. Wang, Curr. Med. Chem. 31 (2024) 938–951. doi: 10.2174/0929867330666230210093411
X. Liu, Y. Zheng, M. Cui, et al., ACS Mater. Lett. 7 (2025) 2639–2647. doi: 10.1021/acsmaterialslett.5c00546
Y. Li, M. Gecevicius, J. Qiu, et al., Chem. Soc. Rev. 45 (2016) 2090–2136. doi: 10.1039/C5CS00582E
X. Chen, Y. Li, K. Huang, et al., Adv. Mater. 33 (2021) 2008722. doi: 10.1002/adma.202008722
K. Huang, N. Le, J.S. Wang, et al., Adv. Mater. 34 (2022) 2107962. doi: 10.1002/adma.202107962
T. Maldiney, A. Bessière, J. Seguin, et al., Nat. Mater. 13 (2014) 418–426. doi: 10.1038/nmat3908
A. Abdukayum, J.T. Chen, Q. Zhao, et al., J. Am. Chem. Soc. 135 (2013) 14125–14133. doi: 10.1021/ja404243v
J. Fu, Q.Y. Lv, Y.S. Li, et al., Nanotechnology 34 (2023) 175601. doi: 10.1088/1361-6528/acb69c
Q.L. Wang, P.B. Guo, W.Y. Cheng, et al., Talanta 269 (2024) 125535. doi: 10.1016/j.talanta.2023.125535
P.K. Kulabhusan, B. Hussain, M. Yüce, Pharmaceutics 12 (2020) 646. doi: 10.3390/pharmaceutics12070646
A.A. Koshmanova, P.V. Artyushenko, I.A. Shchugoreva, et al., Cancers 16 (2024) 4111. doi: 10.3390/cancers16234111
K.W. Goh, A. Stephen, Y.S. Wu, et al., J. Cancer 14 (2023) 2491–2516. doi: 10.7150/jca.85260
L. Svennerholm, K. Bostrom, P. Fredman, et al., Biochim. Biophys. Acta 1214 (1994) 115–123. doi: 10.1016/0005-2760(94)90034-5
S.L. Zhang, C. CordonCardo, H.S. Zhang, et al., Int. J. Cancer 73 (1997) 42–49. doi: 10.1002/(SICI)1097-0215(19970926)73:1<42::AID-IJC8>3.0.CO;2-1
L. Li, Y. Jiang, C. Cui, et al., J. Am. Chem. Soc. 140 (2018) 13335–13339. doi: 10.1021/jacs.8b08047
J. Huang, Y.C. Wu, H. He, et al., Theranostics 12 (2022) 3474–3487. doi: 10.7150/thno.72028
G.O. Sabbih, M.K. Danquah, Int. J. Mol. Sci. 22 (2021) 9101. doi: 10.3390/ijms22169101
Z.J. Li, Y.W. Zhang, X. Wu, et al., J. Am. Chem. Soc. 137 (2015) 5304–5307. doi: 10.1021/jacs.5b00872
L. Zhao, X. He, Y. Huang, et al., Anal. Bioanal. Chem. 412 (2020) 7211–7217. doi: 10.1007/s00216-020-02853-9
J.C. Kraft, R.J.Y. Ho, et al., Biochemistry 53 (2014) 1275–1283. doi: 10.1021/bi500021j
M.X. Li, T. Chen, J.J. Gooding, et al., ACS Sens. 4 (2019) 1732–1748. doi: 10.1021/acssensors.9b00514
Y. Peng, T. Meng, B.H. Yao, et al., Talanta 282 (2025) 126988. doi: 10.1016/j.talanta.2024.126988
L.Y. Zhang, M. Wang, Z.E. Zhu, et al., Int. J. Nanomed. 16 (2021) 3217–3240. doi: 10.2147/ijn.s302450
L.Y. Zhang, M. Wang, Z.E. Zhu, et al., Mol. Ther. Nucl. Acids 26 (2021) 732–748. doi: 10.1108/el-12-2020-0329
J.K. Barrows, M.W. Van Dyke, PLoS One 17 (2022) e0263322. doi: 10.1371/journal.pone.0263322
A. Baoutina, S. Bhat, Gene Ther. 29 (2022) 425–430. doi: 10.1038/s41434-021-00288-0

Scheme 1 Schematic illustration of the synthesis and working mechanism of PLNPs-Apt@IMO and its application in tumor imaging.

Figure 1 Characterization of synthesized PLNPs. (A) TEM morphology (Inset Ⅰ) and HRTEM images of PLNPs (Inset Ⅱ). (B) EDS element mapping on facies of Zn, Ga, Ge, and Cr, respectively. (C) Excitation spectrum (Em = 510 nm) and emission spectra (Ex = 254 nm) of PLNPs. (D) Excitation spectrum (Em = 730 nm) and emission spectra (Ex = 365 nm) of PLNPs. (E) Fluorescence decay images (Inset Ⅰ) and NIR luminescence decay images (Inset Ⅱ) obtained at various periods after stoppage of UV irradiation (5 min) of PLNPs powder and suspension. (F) The corresponding fluorescence intensity decay curve (Inset Ⅰ) and NIR luminescence intensity decay curve (Inset Ⅱ) obtained at various periods of PLNPs powder and suspension. Data are presented as mean ± standard deviation (SD) (n = 3).

Figure 2 Characterization of the Apt@IMO nanostructure and PLNPs-Apt@IMO. (A) The design and pH-activated mechanism of Apt@IMO. (B) Electrophoretic characterization diagram of synthesized Apt@IMO. (C) Verification of structural dissociation of Apt@IMO in acidic environment. (D) The hydrodynamic diameter of PLNPs before and after modification with Apt@IMO. (E) The surface charge of PLNPs before and after modification with Apt@IMO. (F) The atomic percentage (at%) of Ga, Cr, Zn, Ge, and P before and after Apt@IMO modification on the surface of PLNPs. (G) TEM morphology of PLNPs before and after modification with Apt@IMO. (H) NIR luminescence decay images of PLNPs-Apt@IMO at various periods after stoppage of UV irradiation and the statistical graph of luminescence decay of PLNPs before and after modifying Apt@IMO. Data are presented as mean ± SD (n = 3). ***P < 0.001, t-test.

Figure 3 Imaging characterization of probe in cells. (A) Confocal imaging of PLNPs incubated with SK-N-AS and 293T cells, respectively. (B) Co-localization imaging of the targeted probe PLNPs-Apt-Cy3 and non-targeted probe PLNPs-DNA-Cy3 incubated with SK-N-AS cells. (C) Localization imaging of targeted probe PLNPs-Apt@IMO after binding with SK-N-AS cells. (D) Persistent luminescence performance of PLNPs-Apt@IMO complex after incubation with SK-N-AS cells. (E) Cytotoxicity analysis of PLNPs and PLNPs-Apt@IMO on SK-N-AS cells and 293T cells. Scale bar: 20 µm. Data are presented as mean ± SD (n = 3). ***P < 0.001, **P < 0.01, t-test.

Figure 4 Imaging characterization of probe in vivo and ex vivo. (A) The time points of excitation, injection, imaging, and re-excitation of nanoprobes. (B)Time-dependent imaging of mice with tumors injected with saline, PLNPs, PLNPs-Apt, and PLNPs-Apt@IMO. (C) The NIR luminescence intensity of the abdomen at different time points after intraperitoneal injection of PLNPs-Apt@IMO. (D) The NIR luminescence intensity statistics of the tumor site in mice after injection of different probes for 60 min and re-excitation in situ. (E) Flow cytometric analysis of GD2 expression in tumors. (F) NIR luminescence distribution of PLNPs in isolated organs. (G) Quantitative statistics of TBR. (H) H&E staining images of isolated organs showed normal tissue structure. Scale bar: 100 µm. Data are presented as mean ± SD (n = 3). ***P < 0.001, t-test.

 扫一扫看文章


扫一扫关注我们
 DownLoad:
 下载:
 下载: