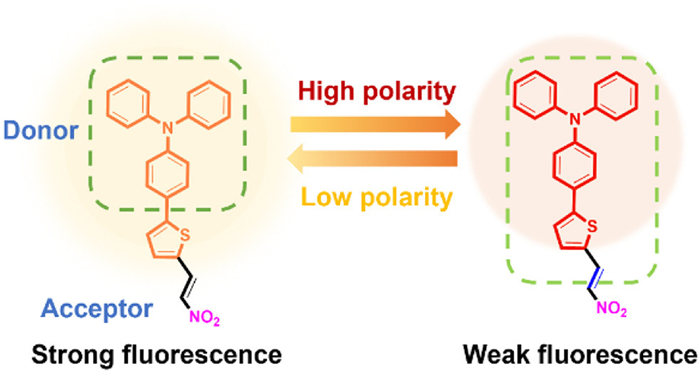
Scheme 1.
Illustration of LD-1 design principle.

Two-photon fluorescent probe for specific imaging of lipid droplets
Shiyue Zheng , Bokyeong Hwang , Eun Seo Kim , In-Jeong Lee , Xiaoqiang Chen , Yahui Chen , Hwan Myung Kim , Juyoung Yoon


Lipid droplets are dynamic intracellular organelles for lipid storage, composed of various neutral lipids such as triacylglycerols and cholesterol esters [1–3]. They play an essential role in energy regulation, membrane transport, and protein degradation, which are strongly connected to metabolic and liver disorders such as cancer [4], type Ⅱ diabetes, and nonalcoholic fatty liver disease (NAFLD) [5–9]. Lipid droplets are different from other organelles because they possess a hydrophobic core and a lower polarity, which is an important parameter for the real-time monitoring of biological systems to assist clinical diagnoses and reveal biological functions [3,10].
Fluorescence imaging, as a nondestructive tool for in vivo biomedical studies, exhibits excellent performance in localizing subcellular organelles and monitoring changes in biological parameters, with rapid response, high sensitivity, and straightforward on-site visualization [11]. Most existing fluorescent probes, such as Nile red [12] and BODIPY 493/503 [13,14], are designed as one-photon fluorescence imaging tools, with critical shortcomings such as poor anti-interference capability, small Stokes shift, and phototoxicity [15].
In comparison, two-photon fluorescence imaging exhibits significant advantages, including higher resolution, deeper tissue penetration, as well as reduced photodamage and photobleaching [16–19]. Additionally, organic dyes with donor-acceptor (D-A) structures are known for their bright fluorescence in nonpolar environments and their ability to stain lipid droplets [2,20]. However, current dyes often fail to localize accurately within lipid droplets and are incompatible with two-photon imaging, limiting their use in deeper tissue studies [9,21].
To overcome these challenges, we developed LD-1, a fluorescent probe with a D-A structure composed of triphenylamine as electron donor [22–24] and a nitro group (-NO2) as electron acceptor (Scheme 1). LD-1 produces strong fluorescence in nonpolar environments and responds sensitively to polarity changes in lipid droplets. Moreover, the probe possesses a two-photon absorption (TPA) cross-section over 200 GM, enabling its use for in vivo experiments with a mouse model of hepatic steatosis. The results showed that LD-1 can clearly visualize lipid droplets and their changes using two-photon microscopy (TPM). This study establishes LD-1 as a reliable probe for monitoring dynamic processes and polarity changes in lipid droplets. By addressing the limitations of current probes, LD-1 supports advances in research and diagnosis of lipid metabolism and associated diseases.
Polarity sensitivity and lipophilicity are essential requirements for the design of lipid droplet probes enabling precise targeting of lipid droplets in vivo. Typically, intramolecular charge transfer (ICT) probes with D-A structure can achieve selective localization of lipid droplets, with most ICT probes exhibiting two-photon properties [6,25]. Therefore, LD-1 consisting of triphenylamine as the lipophilic group (donor) and a nitro group as the acceptor was synthesized through two main steps (Scheme S1 in Supporting information). First, triphenylamine was reacted with 5-formyl-2-thienylboronic acid to produce TPA-T-CHO. Next, the aldehyde group (-CHO) in TPA-T-CHO was replaced with a nitro group (-NO2), resulting in the final LD-1 compound. This configuration ensures strong fluorescence and high stability in nonpolar environments. Moreover, it enables selective staining of lipid droplets, making LD-1 highly effective for in vivo imaging applications with deeper tissue penetration and lower photobleaching.
To verify the D-A structural characteristics of the fluorescent probe LD-1, theoretical calculations were employed to illustrate. Analysis of the frontier molecular orbitals reveals that the highest occupied molecular orbital (HOMO) (−7.16 eV) is largely delocalized over the electron-donating triphenylamine unit, whereas the lowest unoccupied molecular orbital (LUMO) (−1.09 eV) is mainly localized on the electron-withdrawing nitro group, identifying the donor and acceptor regions in LD-1 (Fig. S4 in Supporting information). The pronounced spatial separation between the HOMO and LUMO, coupled with a substantial energy gap (ΔE = 6.07 eV), is characteristic of a D-A conjugated system. This electronic structure favors efficient ICT, a key feature underpinning the fluorescent behavior of LD-1.
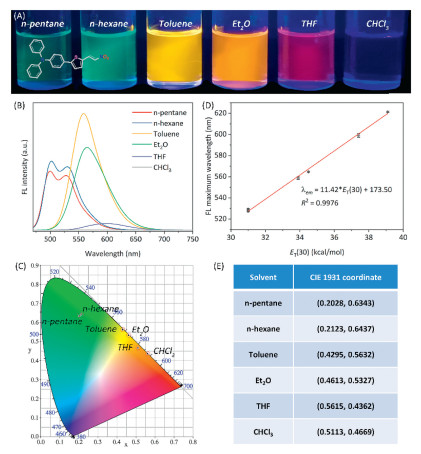
For LD probes with D-A structure, the photophysical properties have a significant solvatochromic effect, which leads to a strong fluorescence behavior in nonpolar environments similar to the conditions found within lipid droplets [26–28]. As shown in Fig. 1A, LD-1 displayed green fluorescence emission in nonpolar solvents, including n-pentane and n-hexane; a red-shifted emission from yellow to red was observed with increasing polarity of the solvent, as confirmed by the fluorescence emission spectra (Fig. 1B), along with the corresponding CIE 1931 chromaticity diagram and detailed data (Figs. 1C and E). Additionally, LD-1 exhibited weaker fluorescence in highly polar solvents such as THF and CHCl3, along with a much stronger intensity in low-polarity solvents such as toluene and diethyl ether (Fig. 1B). To specifically clarify the mechanism underlying the fluorescence quenching of LD-1 in chloroform (CHCl3) from a computational perspective, the systematic density functional theory (DFT) calculations were performed to analyze the charge transfer characteristics of its first singlet excited state in moderately polar toluene and polar CHCl3 [29]. The results explicitly demonstrate that the fluorescence quenching of LD-1 in CHCl3 arises from the solvent polarity-induced enhancement of ICT and nonradiative relaxation. As summarized in Table S1 (Supporting information), the charge separation in LD-1 is visually more pronounced in CHCl3 than in toluene. This observation is corroborated by quantitative parameters: In CHCl3, the electron–hole overlap indices (Sm = 0.42325 a.u., Sr = 0.68715 a.u.) are lower, the electron–hole centroid distance (D = 2.903 Å) is longer, the t value (–0.820 Å) is less negative, and the charge delocalization indices (hole delocalization index (HDI) = 6.18, electron delocalization index (EDI) = 6.46) are smaller, relative to those in toluene (Sm = 0.46935 a.u., Sr = 0.75158 a.u.; D = 2.565 Å; t = –1.231 Å; HDI = 6.34, EDI = 6.54) Therefore, the solvent-dependent charge transfer features promote ICT and enhance nonradiative relaxation, thereby efficiently quenching the fluorescence of LD-1 in CHCl3 by dissipating excitation energy as heat. Moreover, a strong correlation (R2 = 0.9976) was found between the maximum fluorescence emission wavelength and the ET (30) values, indicating the high sensitivity of LD-1 to the solvent polarity (Fig. 1D), which facilitates the specific imaging of lipid droplets. A red shift resulted from the enhanced interactions between solvent molecules and the electronic states of LD-1. The phenomenon is attributed to ICT effects, where the electron transfer from the donor to the acceptor extends the emission wavelength [30–32]. Therefore, the red shift and the ability of LD-1 to emit bright fluorescence in nonpolar environments highlight its potential for the real-time visualization of the lipid droplet behavior and for effectively tracking dynamic changes in intracellular lipid droplets.
Changes in the shape and distribution of lipid droplets are closely related to metabolic disorders in various cells, including hepatocytes. To further evaluate the practical biological application of the LD-1 probe, fluorescence imaging experiments and cytotoxicity assays were carried out on different cells. Prior to the bio-imaging experiments, the cytotoxicity of LD-1 was assessed using an MTT assay on L929, Huh-7, and A549 cells. The cells were incubated with LD-1 at concentrations ranging from 0 to 5 µmol/L under dark conditions. As shown in Fig. S5, the cell viability of the three different cell types remained above 90% at all tested concentrations, indicating that LD-1 has low toxicity and is safe for use in biological environments.
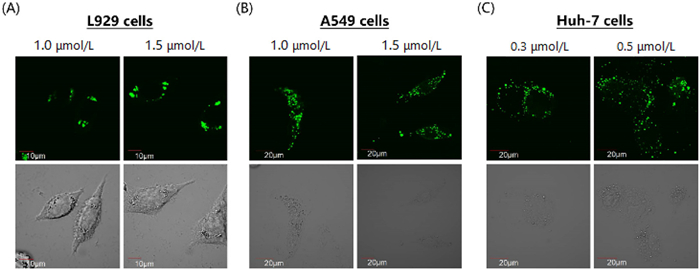
Next, the specific bio-imaging ability of LD-1 in various cell types, including L929, Huh-7, and A549, was evaluated by confocal microscopy. Within 30 min, LD-1 was absorbed by living cells, enabling their rapid imaging. Effective staining was achieved at concentrations of 1.0–1.5 µmol/L in L929 and A549 cells, while Huh-7 cells displayed strong fluorescence at even lower concentrations of 0.3–0.5 µmol/L (Fig. 2). These results confirm the strong fluorescence performance and fast cellular uptake of LD-1 in various cell types.
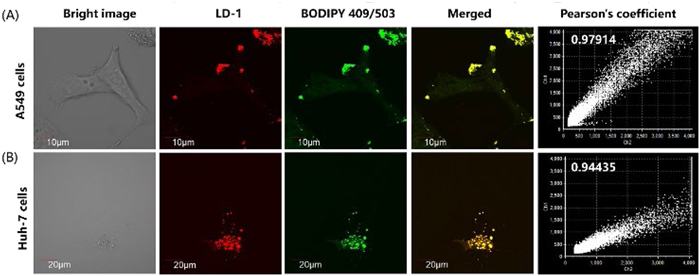
To explore the specific staining of lipid droplets, colocalization experiments were carried out in A549 and Huh-7 cells by incubation with LD-1 (0.5 µmol/L) for 30 min and subsequent treatment with the commercial LD dye BODIPY 493/503. As expected, LD-1 exhibited a clear spherical spot morphology and overlapped well with the commercial dye. The Pearson’s correlation coefficients (0.98 and 0.94 in A549 and Huh-7 cells, respectively) indicated a strong correlation between LD-1 and BODIPY 493/503 (Figs. 3A and B). This high level of colocalization indicates that LD-1 can effectively target lipid droplets with high specificity. The above results confirm the suitability of LD-1 for the precise diagnosis and monitoring of intracellular lipid droplets dynamics, owing to advantages such as low cytotoxicity, fast uptake, and high specificity.
Owing to its conjugated structure with strong electron-donating and -withdrawing groups, the LD-1 is expected to exhibit strong two-photon absorption. Two-photon action cross sections (TPA) in various organic solvents were measured in the 720–960 nm region (Fig. S6 in Supporting information). Notably, LD-1 showed a good TPA value (30–80 GM) in a nonpolar solvent such as toluene within the 820–860 nm range, along with an increasing trend (~200 GM) at wavelengths over 900 nm.
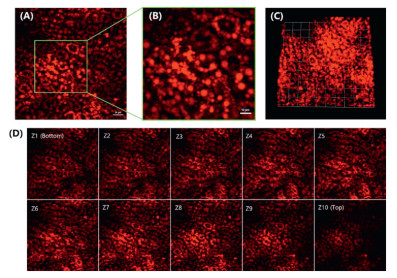
The above results indicate that LD-1 has high selectivity, good sensitivity for targeting lipid droplets, and superior two-photon properties; hence, we investigated its applicability for in vivo TPM imaging and for the real-time visualization of lipid droplets with deeper penetration and high specificity. To establish a NAFLD model, fatty liver disease was induced in mice by following a methionine-choline deficient (MCD) diet for 3 days. All animal experiments were approved by the Animal Ethics Committee of Ajou University. Excessive free fatty acids are esterified into triacylglycerols, leading to the accumulation of lipid droplets in the MCD diet mice, which causes impaired lipid metabolism [33]. To ensure the biological safety of LD-1, the liver tissues of mice were first stained with hematoxylin-eosin (H & E) staining, and the results showed that LD-1 dye did not cause any cytotoxic reaction (Fig. S7 in Supporting information). After injecting a mouse with 10 µL of 10 mmol/L LD-1, two-photon fluorescence images were acquired using a light source within the wavelength range of 780–920 nm. LD-1 displayed a strong and distinct fluorescent signal when excited at 840–880 nm (Fig. 4A). These results suggest that LD-1 can reliably label lipid droplets within hepatocytes and exhibits high specificity and sensitivity in vivo (Fig. 4B). Moreover, in vivo TPM imaging of LD-1 was performed to confirm its deep penetration ability, which is an advantage of two-photon imaging tools (Fig. 4C). Using this intravital mouse liver imaging setup, bright fluorescent images could be obtained at 2 µm intervals after examining the tissue surface (Fig. 4D).
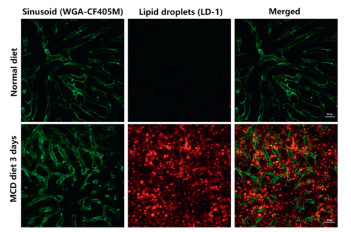
Additionally, in vivo TPM imaging was conducted to simultaneously observe the distribution of hepatic capillaries and lipid droplets. Hepatic capillaries and lipid droplets were stained with wheat germ agglutinin (WGA-CF405M) and LD-1, respectively. Both LD-1 and WGA-CF405M were excited at 840 nm, enabling the simultaneous visualization of lipid droplets and capillaries within liver tissue. As shown in Fig. 5, LD-1 selectively stained lipid droplets in the liver tissue of a fatty liver model mouse. By enabling simultaneous visualization of lipid droplets and capillaries in liver tissue, LD-1 provides deeper insights into the pathological characteristics of fatty liver disease.
In summary, we successfully developed a fluorescent LD-1 exhibiting high sensitivity, selectivity, and low cytotoxicity for detecting polarity changes and dynamic transformations in lipid droplets. Compared to existing commercial fluorescence dyes, the probe showed more reliable imaging performances in diverse biological environments. Additionally, LD-1 exhibited a remarkable TPA (over 200 GM), which enabled high-resolution imaging with deep tissue penetration (~16 µm) and minimal background interference. In vivo experiments further demonstrated the effectiveness of LD-1, which could successfully stain lipid droplets in hepatocytes within a fatty liver model. These findings show that LD-1 is a versatile tool for diagnosing and investigating lipid droplet-associated conditions. Its development represents a significant advance in both basic research and clinical applications, opening new avenues for studying lipid metabolism and associated disorders. Future investigations will further establish this probe as a valuable resource in both scientific and medical fields.
Shiyue Zheng: Writing – original draft, Funding acquisition. Bokyeong Hwang: Data curation. Eun Seo Kim: Data curation. In-Jeong Lee: Writing – review & editing, Data curation. Xiaoqiang Chen: Funding acquisition. Yahui Chen: Writing – review & editing, Funding acquisition, Conceptualization. Hwan Myung Kim: Writing – review & editing, Funding acquisition. Juyoung Yoon: Writing – review & editing, Funding acquisition, Conceptualization.
The authors declare that they have no known competing financial interests or personal relationships that could have appeared to influence the work reported in this paper.
The authors gratefully acknowledge financial support from the National Natural Science Foundation of China (Nos. 22408233, 22308220, and 22090011). Yahui Chen thanks to the General Program Sponsored by Shenzhen Natural Science Foundation in Basic Research Fund (No. JCYJ20250604181343059) and Scientific Foundation for Youth Scholars of Shenzhen University (No. 000001032410). The Shenzhen University 2035 Program for Excellent Research (Nos. 00000208 and 00000225) and the GuangDong Basic and Applied Basic Research Foundation (Nos. 2023B1515120001 and 2025A1515012197). Shiyue Zheng thanks to the Tianfu Yongxing Laboratory Organized Research Project Funding (No. 2023CXXM18). Juyoung Yoon thanks the Nano & Material Technology Development Program supported through the National Research Foundation of Korea (NRF), funded by Ministry of Science and ICT (No. RS-2024-00407093). Hwan Myung Kim thanks the NRF, funded by the Korean government (MSIT) (No. RS-2025-24534195).
Supplementary material associated with this article can be found, in the online version, at doi:
J. Yang, J. Ning, P. Sun, et al., Coord. Chem. Rev. 510 (2024) 215792. doi: 10.1016/j.ccr.2024.215792
D. Wang, L. Tang, J. Wang, et al., Dyes Pigm. 211 (2023) 111082. doi: 10.1016/j.dyepig.2023.111082
K. Wang, S. Ma, Y. Ma, et al., Anal. Chem. 92 (2020) 6631–6636. doi: 10.1021/acs.analchem.0c00456
J. Yin, M. Peng, Y. Ma, et al., Chem. Commun. 54 (2018) 12093–12096. doi: 10.1039/c8cc07398h
N.L. Gluchowski, M. Becuwe, T.C. Walther, et al., Nat. Rev. Gastroenterol. Hepatol. 14 (2017) 343–355. doi: 10.1038/nrgastro.2017.32
J. Sha, W. Liu, X. Zheng, et al., Anal. Chem. 95 (2023) 15350–15356. doi: 10.1021/acs.analchem.3c03047
D. Ramai, W. Tai, M. Rivera, et al., Biomedicines 9 (2021) 184–200. doi: 10.3390/biomedicines9020184
H. Huang, Y. Bu, Z.P. Yu, et al., Anal. Chem. 94 (2022) 13396–13403. doi: 10.1021/acs.analchem.2c01960
W. Hu, L. Chai, X. Chen, et al., Sens. Actuat. B: Chem. 422 (2025) 136509. doi: 10.1016/j.snb.2024.136509
S. Yuan, E. Zhao, Biosens. Bioelectron. 267 (2025) 116802. doi: 10.1016/j.bios.2024.116802
Y. Wang, Y. Qiu, A. Sun, et al., Anal. Chim. Acta 1133 (2020) 109–118. doi: 10.22323/1.390.0109
E. Kim, S. Lee, S.B. Park, Chem. Commun. 48 (2012) 2331–2333. doi: 10.1039/c2cc17496k
A. Tabero, F. García-Garrido, A. Prieto-Castañeda, et al., Chem. Commun. 56 (2020) 940–943. doi: 10.1039/c9cc09397d
J. Chen, W. Liu, X. Fang, et al., Chin. Chem. Lett. 33 (2022) 5042–5046. doi: 10.1016/j.cclet.2022.03.120
M. Kang, X. Gu, R.T.K. Kwok, et al., Chem. Commun. 52 (2016) 5957–5960. doi: 10.1039/C6CC01797E
J. Liu, M. Luo, W. Gao, et al., Biosens. Bioelectron. 267 (2025) 116774. doi: 10.1016/j.bios.2024.116774
M. Jiang, X. Gu, J.W.Y. Lam, et al., Chem. Sci. 8 (2017) 5440–5446. doi: 10.1039/C7SC01400G
G. Niu, R. Zhang, J.P.C. Kwong, et al., Chem. Mater. 30 (2018) 4778–4787. doi: 10.1021/acs.chemmater.8b01943
D. Wang, P. Wu, Z. Yang, et al., Sens. Actuat. B: Chem. 426 (2025) 137023. doi: 10.1016/j.snb.2024.137023
X. Tian, D. Wu, W. Wei, et al., Chin. Chem. Lett. 35 (2024) 108912. doi: 10.1016/j.cclet.2023.108912
K. Wang, W. Ma, Y. Xu, et al., Chin. Chem. Lett. 31 (2020) 3149–3152. doi: 10.1016/j.cclet.2020.08.039
W. Xu, M.M.S. Lee, Z. Zhang, et al., Chem. Sci. 10 (2019) 3494–3501. doi: 10.1039/c8sc05805a
X.Z. Yang, S. Yao, J. Wu, et al., Smart Mol. 2 (2024) e20240040. doi: 10.1002/smo.20240040
Y. Zhou, B. Huang, Y. Wang, et al., Dyes Pigm. 241 (2025) 112879–112885. doi: 10.1016/j.dyepig.2025.112879
M. Dong, D. Wang, J. Yang, et al., Smart Mol. 1 (2023) e20230011. doi: 10.1002/smo.20230011
J. Yin, M. Peng, W. Lin, Sens. Actuat. B: Chem. 288 (2019) 251–258. doi: 10.1016/j.snb.2019.02.122
Y. Pu, R. Huang, L. Chai, et al., Sens. Actuat. B: Chem. 380 (2023) 133343. doi: 10.1016/j.snb.2023.133343
N. Xu, Q. Qiao, X. Fang, et al., Anal. Chem. 96 (2024) 4709–4715. doi: 10.1021/acs.analchem.4c00292
Y. Lee, B. Hwang, B. Sun, et al., Bull. Korea. Chem. Soc. 46 (2025) 859. doi: 10.1002/bkcs.70061
A. Yu, W. Zhang, Q. Zhang, et al., Talanta 274 (2024) 126028. doi: 10.1016/j.talanta.2024.126028
S.T. Zeng, W. Shao, Z.Y. Yu, et al., ACS Sens. 8 (2022) 40–50. doi: 10.3390/w15010040
R.S. Fernandes, A. Himaja, B. Ghosh, et al., ACS Appl. Bio Mater. 7 (2024) 8248–8260. doi: 10.1021/acsabm.4c00970
H.W. Lee, I.J. Lee, S.J. Lee, et al., ACS Sens. 7 (2022) 1027–1035. doi: 10.1021/acssensors.1c02679

Figure 1 (A) Photographs of LD-1 in different solvents, taken under 365 nm UV irradiation from a hand-held UV lamp. (B) Fluorescence spectra of LD-1 in different solvents. (C) CIE 1931 chromaticity diagram of LD-1 in different solvents. (D) Plot of fluorescence emission maximum of LD-1 as a function of ET (30) in different solvents, where ET (30) is the empirical solvent polarity parameter. (E) Corresponding CIE 1931 coordinates of LD-1 in different solvents. LD-1 concentration: 10 µmol/L, λex = 450 nm.

Figure 2 Confocal images of different LD-1 concentrations in (A) L929 (1.0 and 1.5 µmol/L), (B) A549 (1.0 and 1.5 µmol/L), and (C) Huh-7 (0.3 and 0.5 µmol/L) cells.

Figure 3 (A, B) Colocalization of LD-1 (0.5 µmol/L, 30 min) and BODIPY 493/503 (0.3 µmol/L, 30 min) in live A549 (Pearson’s correlation coefficient (PCC) = 0.979) and Huh-7 (PCC = 0.944) cells. λex = 450 nm, λem = 500–600 nm.

Figure 4 In vivo two-photon images. (A, B) TPM snapshot images of LD-1 obtained using 860 nm excitation and 575–605 nm emission windows. Scale bar: 20 µm. (C) 3D rendering image of LD-1. Images were obtained at 575–605 nm with an excitation wavelength of 860 nm. (D) TPM cross section images of LD-1 along z-direction, acquired at 2 µm intervals.

Figure 5 In vivo TPM merged images of LDs (red, LD-1) and sinusoids (green, WGA-CF405M) in mice fed with normal or MCD diets. Imaging conditions: 840 nm excitation, 400–480 nm (green) and 575–605 nm (red) emission windows, 30 min incubation (10 µL of 10 mmol/L LD-1 + 50 µL of WGA-CF405M 50 µg). Scale bar: 20 µm.

 扫一扫看文章


扫一扫关注我们
 DownLoad:

 下载:
 下载: