
Scheme 1.
Synthetic routes of the ligand and complex
Synthesis, Crystal Structure, Anticancer Activity and Interaction with Bovine Serum Albumin of Copper(Ⅱ) Complex
Yan ZHANG , Xiang-Gao MENG , Ping CAI , Gong-Zhen CHENG , Shi-Fang JIA

Cancer is one of the major causes of death in the world. Current clinical treatment of cancer is limited to surgery, radiotherapy, and chemotherapy. Although surgical resection and/or radiotherapy could cure early-stage tumor, most patients are diagnosed with advanced disease and distant metastases. In fact, chemotherapy is the main treatment of hematological and metastatic tumor[1]. Development of new compounds with specific anticancer activity is a burning issue[2]. During recent decades, metal-based antitumor drugs have been playing a relevant role in antiblastic chemotherapy. Among the different metal complexes, copper complexes have shown great potential and remain the subject of extensive drug discovery efforts[3-4]. In addition, Schiff bases linked by diazo have regularly been studied as ligands in coordination chemistry as a result of their good metal binding ability. The azo linkage is responsible for the biological activity and lone pair electrons in nitrogen atom play chemical and biological role. The bidentate and multidentate Schiff bases with delocalized-orbitals are suitable ligands for the metals of biological importance, and the study of the chemical properties of such metal-Schiff base complexes also represents a good strategy for the design and synthesis of models of biological systems[5-11]. Several Cu(Ⅱ) Schiff base complexes show notable biological activities and pharmaceutical properties, such as DNA binding and cleavage[12-14], antioxidant[15], antimicrobial[16], anti-fungal[17], antibacterial[18], antidiabetic[19], antitumor, and anticancer properties[20-21]. Cu(Ⅱ) Schiff base complexes, which are known as favorable options to cisplatin as drugs in cancer chemotherapy, can inhibit in vitro tumor cell growth. Cu(Ⅱ) Schiff base complexes affect the function of proteins and target nucleic acids, and are able to bind and cleave DNA which leads to cell cycle arrest and apoptosis. It is generally accepted that only free drug molecules can pass through the cell membranes to be effective against the tumor[22-23].Thus, the anticancer activity may be strongly affected by drug-protein interactions in the blood stream. Serum albumin is the major transport protein and is capable of binding many endogenous and exogenous drugs reversibly and it may aid in selective delivery of these studied drugs to tumor region and facilitate drug access into the cell. For effective therapeutic monitoring, it is necessary to know the parameters of binding to serum albumin during its destabilization. Most recently, many studies on the drug-serum albumin using techniques such as fluorescence[24-27], FT-IR[28-30], CD spectroscopy[31-32] and NMR[33-34] were reported. Fluorescence served as a sensitive and convenient means indicating the alteration of the fluorophore environment which can provide plenty of useful information.
In this work, one four-coordinated Cu(Ⅱ) complex with Schiff base ligand was synthesized and characterized by the elemental analysis and infrared spectroscopy. The inhibitory activities of the complex on cancer cells in vitro was studied. In addition, Cu(Ⅱ) complex with bovine serum albumin (BSA) was investigated by fluorescence spectroscopy. On the basis of the spectroscopic data, the quenching constants and thermodynamic parameters, binding constants, the number of binding sites and binding distance were calculated. The obtained results may have important applications in drug delivery and drug design procedures.
Hela (human cervical carcinoma), SGC-7901 (human gastric carcinoma), MCF-7(human breast cancer) and HepG2 (human liver cancer) cell lines were purchased from the American Type Culture Collection. Bovine serum albumin (BSA) was obtained from Sigma, the BSA binding studies were carried on in 5 mmol Tris buffer (pH 7.4), containing 50 mmol NaCl. The stock solution of the Cu(Ⅱ) complex was prepared in DMSO. The BSA solutions were used freshly after preparation and its concentration was determined spectrophotometrically, using a molar excitation coefficient of 43 800 L·mol-1·cm-1 at 280 nm. 4-aminoazobenzene, salicylaldehyde and Cu(OAc)2·H2O were obtained from Wuhan Shenshihuagong. All other chemicals were of analytical grade and double distilled water was used in all the studies.
Microanalysis (C, H, and N) was conducted with a Perkin-Elmer 240Q elemental analyzer. 1H NMR spectroscopic measurements (300 MHz) were performed on a Bruker AM-300 NMR spectrometer, using CDCl3 as solvent and TMS (SiMe4) as an internal reference at 25 ℃. Infrared spectra were recorded on a Perkin-Elmer Spectrum using KBr pellets. All fluorescence spectra were measured using a Shimadzu RF-5301PC fluorophotometer with a quartz cell of 1 cm path length, both excitation and emission slits were 5 nm, and the excitation wavelength of BSA was at 280 nm. UV spectra measurements were performed on a Shimadzu 3100 spectrophotometer using a 1 cm cell at 1.0 nm intervals.
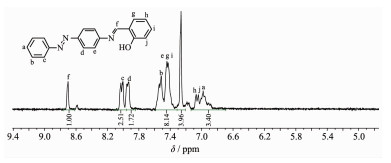
4-aminoazobenzene (0.50 g, 2.5 mmol) was dissolved in ethanol (40 mL), salicylaldehyde (240 μL) was added dropwise to the solution. The mixture was stirred at 90 ℃ for 8 h. After being cooled to room temperature, the solution was concentrated, and the solid was collected by filtration, washed thoroughly with water and dried in vacuum over P2O5. Then the crude product thus obtained was recrystallized from ethanol. 2-(4-phenylazo-phenylimino)-phenol (L) was obtained as yellow-orange powder (Yield: 85.5%). Elemental analysis Calcd. for C19H15N3O(%): C 75.75, H 4.98, N 13.95. Found(%):C 75.78, H 4.97, N 13.94. 1H NMR(300 MHz, CDCl3, 298 K): δ 6.98(m, 1H, Ha), 7.04(m, 2H, Hh, Hj), 7.41(t, 4H, He, Hg, Hi), 7.51(m, 2H, Hb), 7.93(d, 2H, Hd), 8.00(d, 2H, Hc), 8.70(s, 1H, Hf).
A solution of Cu(OAc)2·H2O (0.100 g, 0.5 mmol) in ethanol (20 mL) was added to a solution of the ligand L (0.301 g, 1 mmol) in absolute ethanol (40 mL). The mixture was stirred at 80 ℃. The precipitated complex was filtered, washed with cold ethanol, and dried in vacuo over P4O10. The product was dissolved by dichloromethane in the tube, which was put in the glass jar, with ethyl ether in it. Ethyl ether was diffused into the tube, and then a week later, yellow acicular crystals were obtained. Elemental analysis Calcd. for C38H28N6O2Cu(%): C 68.67, H 4.22, N 12.65. Found (%):C 68.44, H 4.27, N 12.54. FT-IR (KBr, cm-1): 1 601, 1 527, 1 437, 1 315, 1 279 ν(C=N, N=N, C=C), 1 184, 1 143 ν(Ph-O), 842, 744 ν(=C-H), 670, 597, 547 ν(C-H).
X-ray diffraction data for the crystal was collected with graphite-monochromatic Mo Kα radiation(λ=0.071 073 nm) on a Bruker Smart Apex Ⅱ CCD diffractometer, by the φ-ω scan technique at ambient temperature. Multi-scan absorption correction was applied to the data. The crystal structure was solved by direct methods and refined by full-matrix least-squares on F2. All the non-hydrogen atoms were located in successive difference Fourier syntheses and then refined anisotropically. Hydrogen atoms were placed in the calculated positions or located from Fourier maps, and refined isotropically with isotropic vibration parameters related to the non-hydrogen atoms to which they are bonded. All calculations were performed with the SHELXL-97[35] programs. The crystallographic data were listed in Table 1.
 下载:
导出CSV
下载:
导出CSV
| Molecular formula | C38H28N6O2Cu | V/nm3 | 1.524 2(17) | |
| Formula weight | 664.2 | Z | 2 | |
| Crystal system | Monoclinic | Dc/(g·cm-3) | 1.447 | |
| Space group | P21/c | μ/mm-1 | 0.763 | |
| a/nm | 1.755 2(12) | Reflection measured | 2 628 | |
| b/nm | 1.130 8(7) | R1 | 0.122 7 | |
| c/nm | 0.768 3(5) | wR2 | 0.222 6 | |
| β/(°) | 91.799(11) | GOF | 1.019 |
CCDC: 1567198.
Standard MTT assay procedures were used[36]. Cells were placed in 96-well microassay culture plates (8×10³ cells per well) and grown overnight at 37 ℃ in a 5% (V/V) CO2 incubator. The tested complex were then added to the wells to achieve final concentrations ranging from 1.56 to 25 μmol·L-1. Control wells were prepared by addition of culture medium (200 μL). The plates were incubated at 37 ℃ in a 5% (V/V) CO2 incubator for 48 h. On completion of the incuba-tion, stock MTT dye solution (20 μL, 5 mg·mL-1) was added to each well. After 4 h, 150 mL dimethyl sulfoxide (DMSO) was added to solubilize the MTT formazan. The optical density of each well was then measured with a microplate spectrophotometer at a wavelength of 490 nm. The IC50 values were determined by plotting the percentage viability versus the concentration and reading off the concentration at which 50% of the cells remained viable relative to the control. Each experiment was repeated at least three times to obtain the mean values. Four different tumor cell lines were the subjects of this study: MCF-7 (human breast carcinoma), SGC-7901 (human gastric carcinoma), Hela (human cervical carcinoma) and HepG2 (human liver carcinoma).
All fluorescence measurements were performed on a Shimadzu RF-5301PC spectrofluorometer with water bath in a 1 cm quartz cuvette. The fluorescence spectra were measured from 290 to 450 nm with an excitation wavelength of 280 nm[37]. The excitation and emission slits were both set to 5 nm. The scanning speed was 200 nm·min-1. To measure the polarity of Trp environment upon binding of the Cu(Ⅱ) complex to BSA, intrinsic fluorescence experiments were performed. The fixed concentration of BSA (5.0 μmol·L-1) was titrated with various concentrations of each Cu(Ⅱ) complex (0~24.0 μmol·L-1). The solutions incubated for 5 min, before the spectra were recorded. The BSA solution were freshly prepared just before performing the measurements and the observed fluorescence intensities corrected for the dilutions. All experiments were performed at three different temperatures (287, 303 and 313 K) and the maximum fluorescence intensity (about 340 nm) was used in order to calculate the thermodynamic parameters.
The 1H NMR spectrum of L showed seven sets of signals in the aromatic region, as illustrated in Fig. 1. The signal assignment was rather straightforward by the comparison of chemical shifts with those of similar Schiff-base ligands, and the resonances at δ 6.98, 7.51 and 8.00 were assigned to the Ha, Hb and Hc protons, respectively, of the benzene ring. The resonances at δ 7.93 and 7.41 were assigned to the Hd and He protons, respectively, of the phenyl spacer. The resonances at δ 7.04 and 7.41 were assigned to the Hg, Hh Hi and Hj protons, respectively, of the salicylaldehyde ring. It′s worth noting that there was a singlet at δ 8.70, which indicated formation of -C=N in the Schiff base.
Infrared spectra of the Cu(Ⅱ) complex does not display any band near 3 300 cm-1, which suggested that the -OH of salicylaldehyde is deprotonated in the complex. IR spectra shows two bands at 1 601 and 1 527 cm-1, which are assigned to the absorption of ν(C=N) and ν(N=N), respectively[38]. The absorption bands in the ranges of 1 437, 1 315 and 1 279 cm-1 correspond to the ν(C=C) of benzene ring. The values of ν(C-O) being 1 184 and 1 143 cm-1, 842 and 744 cm-1 belong to the δ (=C-H) of benzene ring.
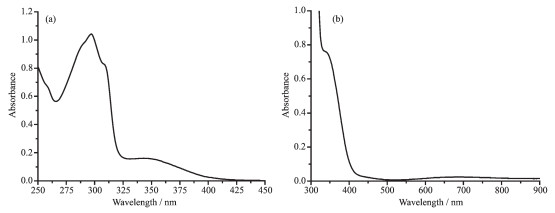
The absorption spectra of the ligand and complex were recorded in ethanol (Fig. 2). Ligand L displayed three absorptions peaks at 296, 309 and 350 nm. These absorption peaks are attributed to intraligand n→π* and π→π* transitions. The absorption band of Cu(Ⅱ) complex at 340 nm corresponds to intraligand transition of π-π* orbitals of the ligand, and the band at 436 nm is assigned as the ligand to metal transition of Cu(Ⅱ) complex. The low-energy band around 667 nm for Cu(Ⅱ) complex is assigned as the metal d-d transition typical of copper(Ⅱ) complexes[39].
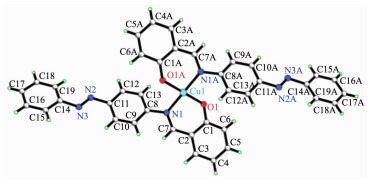
The selected bond lengths and bond angles are listed in Table 2. The molecular structure of Cu(Ⅱ) complex is shown in Fig. 3, and its packing in a unit cell in Fig. 4. This complex is mononuclear molecule. The central metal atom is four-coordinated by two oxygen atoms (O(1) and O(1A)) and two nitrogen atom (N(1) and N(1A)) from the ligand. O(1), O(1A), N(1) and N(1A) are placed in equatorial sites. The bond angles of O(1)-Cu(1)-O(1A), N(1)-Cu(1)-N(1A) and O(1)-Cu(1)-N(1) are 179.9°, 180° and 89.5°, respectively, which obviously indicates that the Cu(Ⅱ) complex is quadrilateral plane structure[40-41].
下载:
导出CSV
| Cu1-O1 | 0.189 9(5) | Cu1-N1 | 0.201 6(5) | O1-C1 | 0.133 0(8) |
| N1-C7 | 0.130 9(9) | N1-C8 | 0.143 2(9) | N2-N3 | 0.124 7(8) |
| N2-C11 | 0.143 3(9) | N3-C14 | 0.144 8(9) | ||
| O1-Cu1-O1 | 180.0 | N1-C7-H7 | 116.7(0) | O1-Cu1-N1 | 90.5(2) |
| C2-C7-H7 | 116.7(0) | O1-Cu1-N1 | 89.5(2) | C13-C8-C9 | 119.8(7) |
| N1-Cu1-N1 | 180.0 | C13-C8-N1 | 117.8(6) | C1-O1-Cu1 | 123.6(4) |
| C9-C8-N1 | 122.3(6) | C7-N1-C8 | 116.8(5) | C15-C14-N3 | 114.9(7) |
| C7-N1-Cu1 | 121.2(4) | C19-C14-N3 | 124.8(7) | C8-N1-Cu1 | 121.5(4) |
| C12-C11-N2 | 115.3(6) | N3-N2-C11 | 114.5(6) | C10-C11-N2 | 125.0(6) |
| N2-N3-C14 | 113.0(6) | C9-C8-N1 | 122.3(6) | O1-C1-C6 | 120.8(6) |
| C13-C8-N1 | 117.8(6) | O1-C1-C2 | 122.1(6) | N1-C7-H7 | 116.7(0) |
| N1-C7-C2 | 126.6(6) |
Cu(Ⅱ) complex Symmetry codes: A: 1-x, 1-y, -z
The cytotoxicity of Cu(Ⅱ) complex towards the four cancer cell lines was evaluated using the MTT method. The cytotoxicity of the complexes was found to be concentration dependent. The cell viability decreased with increasing concentration of the complex. Table 3 lists the half inhibitory concentration (IC50) of the complex and carboplatin on cultured cancer cells in vitro. As shown in Fig. 5 and Table 3, the Cu(Ⅱ) complex have obvious inhibitory effect on four cancer cells, and the effect was better than carboplatin. The prominent cytotoxicity of the complex is probably related to the strong DNA binding involving hydrophobic interaction forces[42] or the dissociation of the complex in the cell, resulting in intracellular accumulation of high amounts of copper and the chelation with biological components such as proteins from the nucleus[43-44]. Recently, four novel Cu(Ⅱ) complexes of bidentate Schiff base ligands were reported by Abbasi′s group. The in vitro anticancer activity of compounds was screened by MTT assays against gastric cancer cell line (MKN-45), the IC50 values were 1.542~4.560 μg·mL-1 [45]. These results show that Cu(Ⅱ) complex may be better potential candidates for further chemical optimization and cancer therapy.
下载:
导出CSV
| Complex | IC50/(μmol·L-1) | |||
| Hela | HepG2 | SGC-7901 | MCF-7 | |
| Cu(Ⅱ) complex | 9.52±2.6 | 9.44±0.44 | 4.67±1.98 | 4.52±0.98 |
| Carboplatin | 19.21±3.5 | 20.33±1.02 | 13.39±0.82 | 10.92±1.01 |

Among the several techniques, fluorescence spectroscopy is very useful to obtain quantity and quality information on the protein-drug interaction[46]. Although BSA have two intrinsic fluorophores such as Tyr and Trp; most of fluorescence characteristic of this protein comes from the only Trp residue in subdomain ⅡA, which is very sensitive to the environmental changes[47-48]. In order to determine the quenching mechanism of the interaction between BSA and Cu(Ⅱ) complex, the fluorescence experiments were carried out at three different temperatures (287, 303 and 313 K). The fluorescence emission spectra of BSA in the absence and presence of different concentrations of Cu(Ⅱ) complex at 287 K are shown in Fig. 6. As shown in Fig. 6, the BSA fluorescence intensities were gradually decreased with increasing concentration of Cu(Ⅱ) complex, indicating that the Trp residue was transferred into a more hydrophobic environment during the interaction. The similar emission profiles were observed as the experiments were repeated at 303 and 313 K.
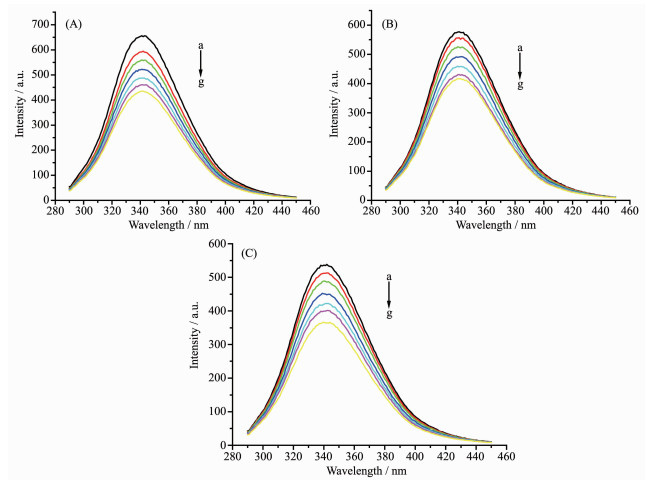
cBSA=5.0 μmol·L-1, a~g: ccomplex=0, 4, 8, 12, 16, 20, 24 μmol·L-1
There are two quenching types in characterizing the mechanism of the binding of quencher and macromolecules: static and dynamic (or collision) quenching. Static quenching refers to the formation of a non-fluorescence fluorophore-quencher complex. Dynamic quenching refers to that the quencher diffuses to the fluorophore during the lifetime of the exited state and upon contact, and the fluorophore returns to ground state without emission of a photon[49]. The mechanism of the drug binding to serum albumin was probed using Stern-Volmer equation[50]:
|
$ {F_0}/F = 1 + {K_{\rm{q}}}{\tau _0}{c_{\rm{D}}} = 1 + {K_{{\rm{sv}}}}{c_{\rm{D}}} $ |
(1) |
where F0 and F are the fluorescence intensities in the absence and presence of drug, respectively, cD is the drug (complex) concentration, Kq is the biomolecular quenching rate constant, τ0 is the average lifetime of molecule in the absence of drug and its value is 10-8 s[51], Ksv is the Stern-Volmer quenching constant. For the drug-BSA system, the Stern-Volmer plots are presented in Fig. 7 and the values of Ksv obtained from the plots are listed in Table 4. It is obvious that the Ksv decreases with increasing temperature for Cu(Ⅱ) complex. Furthermore, it was found all values of Kq were larger than 2.0×10¹⁰ L·mol-1·s-1, the maximum diffusion collision quenching rate constant of various quenchers with the biopolymer[52]. So the quenching process between Cu(Ⅱ) complex and BSA was static quenching and not dynamic quenching.
 下载:
导出CSV
下载:
导出CSV
| T/K | Ksv/(L·mol-1) | Kq/(L·mol-1·s-1) | R* |
| 287 | 2.044×10⁴ | 2.044×10¹² | 0.990 90 |
| 303 | 1.900×10⁴ | 1.900×10¹² | 0.991 27 |
| 313 | 1.848×10⁴ | 1.848×10¹² | 0.998 18 |
| *R is regression coefficient | |||
For the static quenching interaction, when drug molecules bind independently to a set of equivalent sites on a macromolecule, the binding constant(KA) and the number of binding sites (n) can be determined by the following equation[53]:
|
$ \lg \frac{{{F_0} - F}}{F} = n\lg {K_{\rm{A}}} + n\lg \left( {{c_{\rm{D}}} - {c_{\rm{P}}}\frac{{{F_0} - F}}{F}} \right) $ |
(2) |
where F0 and F are the fluorescence intensities in the absence and presence of the Cu(Ⅱ) complex, cD and cP are the concentration of the Cu(Ⅱ) complex and protein, respectively, KA is the binding constant and n is the number of binding sites. The values of n and KA at physiological pH 7.4 were obtained from the double logarithmic plots of lg[(F0-F)/F] versus lgcD. The binding constants and binding sites at three different temperatures are listed in Table 5.
下载:
导出CSV
| T/K | KA/(L·mol-1) | n | R* |
| 287 | 2.61×10⁴ | 1.56 | 0.990 13 |
| 303 | 2.44×10⁴ | 1.28 | 0.997 27 |
| 313 | 2.20×10⁴ | 1.13 | 0.995 86 |
| *R is regression coefficient | |||
The thermodynamic studies reveal that free energy changes are negative for interaction between the Cu(Ⅱ) complex and protein which show that binding processes are spontaneous. The interaction forces between drug and biomolecules include hydrogen bonds and van der Waals forces as well as, electrostatic and hydrophobic attraction[54]. The sign and magnitude of ΔS and ΔH for protein binding can account for the main force contributing to protein stability. When the temperature change is not very enormous, the ΔH of a system can be regarded as a constant, and its value and ΔS can be calculated from the van′t Hoff equation:
|
$ \ln \frac{{{K_{{\rm{A2}}}}}}{{{K_{{\rm{A1}}}}}} = \frac{{\Delta H}}{R}\left( {\frac{1}{{{T_1}}} - \frac{1}{{{T_2}}}} \right) $ |
(3) |
|
$ \Delta G = - RG\ln {K_{\rm{A}}} = \Delta H - T\Delta S $ |
(4) |
where KA is the binding constant, and R is the universal gas constant; ΔG, ΔH and ΔS are the standard free energy change, enthalpy change and entropy change for the binding interaction, respectively. The values of thermodynamic parameters obtained through these equations are presented in Table 6. The values of ΔH for the binding reaction between Cu(Ⅱ) complex and BSA are found to be negative, while ΔS are positive, which indicates that in this system electrostatic interaction plays a major role in the formation of the Cu(Ⅱ) complex-protein adduct.
下载:
导出CSV
| T/K | ΔH/(kJ·mol-1) | ΔG/(kJ·mol-1) | ΔS/(J·mol-1·K-1) |
| 287 | -3.04 | -24.27 | 73.97 |
| 303 | -8.16 | -25.45 | 57.06 |
| 313 | -8.16 | -26.02 | 57.06 |
The binding distance concerning donor-acceptor pair can be obtained from the Frster theory of non-radiation energy transfer[55]. It is well known that BSA contains two tryptophane (Trp 135, Trp 214), but the crystallography analysis reveals that many drugs are bound at subdomains ⅡA and ⅢA, while Trp 214 is at ⅡA. And in general, the fluorescence of BSA arises mainly from Trp 214. So the distance between the drug and BSA generally means the distance between Trp 214 and the drug. The rate of energy transfer depends on the extent of overlapping of the donor emission spectrum with the acceptor absorption spectrum, the relative orientation of the donor and acceptor transition dipoles, and the distance between the donor and the acceptor[56].
The energy transfer efficiency E is
|
$ E = 1 - F/{F_0} $ |
(5) |
Where F is the fluorescence intensity of BSA in the presence of the complex and the concentration ratio of BSA to complex is 1: 1. E is also expressed as:
|
$ E = R_0^6/\left( {R_0^6 + r_0^6} \right) $ |
(6) |
where r0 is the acting distance between the donor and acceptor and R0 is a characteristic distance, called as the Förster distance or critical distance, at which the efficiency of transfer is 50%:
|
$ R_0^6 = 8.8 \times {10^{ - 25}}{K^{ - 2}}{N^{ - 4}}\mathit{\Phi }J $ |
(7) |
where K2 is the spatial orientation factor describing the relative orientation in space of the transition dipoles of the donor and acceptor, K2=2/3, N is the refraction index for the medium, Φ is the fluorescence quantum yield of the donor in the absence of the acceptor, N=1.33, Φ=0.13 and J is the overlap integral between the donor fluorescence emission spectrum and the acceptor absorption spectrum. J can be calculated by
|
$ J = \sum {F\left( \lambda \right)} \varepsilon \left( \lambda \right){\lambda ^4}\Delta \lambda /\sum {F\left( \lambda \right)} \Delta \lambda $ |
(8) |
In Eq.(8), F(λ) is the fluorescence intensity of the fluorescence donor at wavelength λ, ε(λ) is the molar absorption coefficient of the acceptor at wavelength λ and its unit is L·mol-1·cm-1.
The over lapping of the absorption spectra of 5.00 μmol·L-1 Cu(Ⅱ) complex with the fluorescence emission spectra of 50 μmol·L-1 BSA were shown in Fig. 8. The spectrum ranging from 290~450 nm was chosen to calculate J. By Eq.(7), the critical distance R0 could be calculated. And the distance between the Cu(Ⅱ) complex and tryptophan could be obtained from Eq.(6). The value of r0 for the Cu(Ⅱ) complex is 3.92 nm, less than the academic value (8 nm)[57], which indicates that the fluorescence quenching of BSA is also a non-radiation transfer process.
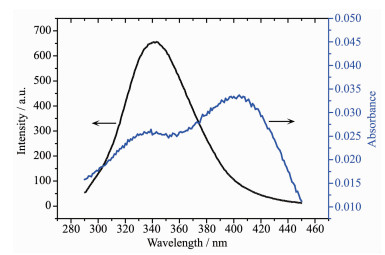
cBSA=50 μmol·L-1, ccomplex=5 μmol·L-1
One copper(Ⅱ) complex has been synthesized by the reaction of 4-aminoazobenzene, salicylaldehyde and Cu(OAc)2·H2O. Structural analysis shows that the complex is mononuclear molecule. The central copper atom is four-coordinated in a plane square structure. The inhibitory activity of complex on cultured cancer cells (Hela, HepG2, MCF-7, SGC-7901) in vitro was studied, and the results showed that it has obvious inhibitory effect on four kinds of cancer cells and may be better potential candidates for further chemical optimization and cancer therapy. The interaction between the complex and BSA was studied by the fluorescence quenching technique. The binding properties of Cu(Ⅱ) complex and bovine serum albumin indicated that serum albumin can serve as a carrier of DNA binders. Under the conditions selected in this work, the binding constant, binding force and binding distance between Cu(Ⅱ) complex and serum albumin were obtained.
These results may be important, which may give us a better understanding of pharmacokinetics such as drug metabolism and distribution. And they may be useful for deciding the dosage in therapeutics as well as designing the new anti-tumor agents. Further studies on protein binding of drugs will be in progress in our laboratory.
Acknowledgements: This work was supported by the National Natural Science Foundation of China (Grant No.21101121) and Doctor Fund of Taiyuan University of Science and Technology (Grant No.20172005).
Kostova I. Curr. Med. Chem., 2006, 13(9):1085-1107 doi: 10.2174/092986706776360941
DiSaia P J, Bloss J D. Gynecol. Oncol., 2003, 90(2):24-32 doi: 10.1016/S0090-8258(03)00341-X
Nagesh G Y, Mahendra Raj K, Mruthyunjayaswamy B H M. J. Mol. Struct., 2015, 1079:423-432 doi: 10.1016/j.molstruc.2014.09.013
Abu-Dief A M, Mohamed I M A. Beni-Suef Univ. J. Appl. Sci., 2015, 4:119-123 doi: 10.1016/j.bjbas.2015.05.004
Garza-Ortiz A, Maheswari P U, Lutz M, et al. J. Biol. Inorg. Chem., 2014, 19(4/5):675-689 doi: 10.1007/s00775-013-1083-4
Selvamurugan S, Viswanathamurthi P, Endo A, et al. J. Coord. Chem., 2013, 66:4052-4066 doi: 10.1080/00958972.2013.858135?journalCode=gcoo20
Sathiyaraj S, Sampath K, Butcher R J, et al. Eur. J. Med. Chem., 2013, 64:81-89 doi: 10.1016/j.ejmech.2013.03.047
Garza-Ortiz A, Maheswari P U, Siegler M, et al. New. J. Chem., 2013, 37:3450-3460 doi: 10.1039/c3nj00415e
Sathiyaraj S, Butcher R J, Jayabalakrishnan C. J. Mol. Struct., 2012, 1030:95-109 doi: 10.1016/j.molstruc.2012.07.021
Raja G, Butcher R J, Jayabalakrishnan C. Spectrochim. Acta Part A, 2012, 94:210-215 doi: 10.1016/j.saa.2012.03.035
陈延民, 冯英健, 蔡明瑜, 等.无机化学学报, 2018, 34(1):123-128 http://qikan.cqvip.com/article/detail.aspx?id=674185889CHEN Yan-Min, FENG Ying-Jian, CAI Ming-Yu, et al. Chinese J. Inorg. Chem., 2018, 34(1):123-128 http://qikan.cqvip.com/article/detail.aspx?id=674185889
Li L, Guo Q, Dong J, et al. J. Photochem. Photobiol. B, 2013, 125:56-62 doi: 10.1016/j.jphotobiol.2013.05.007
da Silveira V, Luz J, Oliveira C, et al. J. Inorg. Biochem., 2008, 102(5/6):1090-1103 http://med.wanfangdata.com.cn/Paper/Detail?id=PeriodicalPaper_JJ024917518
Reddy P A N, Nethaji M, Chakravarty A R. Eur. J. Inorg. Chem., 2004:1440-1446 doi: 10.1002/ejic.200300514/full
Saif M, El-Shafiy H F, Mashaly M M, et al. J. Mol. Struct., 2016, 1118:75-82 doi: 10.1016/j.molstruc.2016.03.060
Zaltariov M, Cazacu M, Avadanei M, et al. Polyhedron, 2015, 100:121-131 doi: 10.1016/j.poly.2015.07.030
Patil S A, Prabhakara C T, Halasangi B M, et al. Spectrochim. Acta Part A, 2015, 137:641-647 doi: 10.1016/j.saa.2014.08.028
Salehi M, Ghasemi F, Kubicki M, et al. Inorg. Chim. Acta, 2016, 453:238-246 doi: 10.1016/j.ica.2016.07.028
Vančo J, Marek J, Travniček Z, et al. J. Inorg. Biochem., 2008, 102:595-605 doi: 10.1016/j.jinorgbio.2007.10.003
Chakraborty A, Kumar P, Ghosh K, et al. Eur. J. Pharmacol., 2010, 647(1/2/3):1-12 http://www.europepmc.org/abstract/MED/20797395
Qiao X, Ma Z Y, Xie C Z, et al. J. Inorg. Biochem., 2011, 105(5):728-737 doi: 10.1016/j.jinorgbio.2011.01.004
Koch-Weser J, Sellers E M, Engl N. J. Med., 1976, 294(6):311-316 http://www.ncbi.nlm.nih.gov/pubmed/1107839
Kunin C M. Clin. Pharmacol. Ther., 1966, 7(2):166-179 doi: 10.1002/cpt.1966.7.issue-2
Silva D, Cortez C M, Louro S R W. Spectrochim. Acta Part A, 2004, 60:1215-1223 doi: 10.1016/j.saa.2003.08.003
Sułkowska A, Bojko B, Rownicka J, et al. J. Mol. Struct., 2003, 651:237-243 doi: 10.1016/S0022-2860(02)00635-X
Birla L, Cristian A M, Hillebrand M. Spectrochim. Acta Part. A, 2004, 60(3):551-556 doi: 10.1016/S1386-1425(03)00261-0
Deepa S, Mishra A K. J. Pharm. Biomed. Anal., 2005, 38(3):556-563 doi: 10.1016/j.jpba.2005.01.023
Purcell M, Neault J F, Tajmir-Riahi H A. Biochim. Biophys. Acta, 2000, 1478:61-68 doi: 10.1016/S0167-4838(99)00251-4
Xie M X, Xu X Y, Wang Y D. Biochim. Biophys. Acta, 2005, 1724:215-224 doi: 10.1016/j.bbagen.2005.04.009
Li Y, He W Y, Tian J N, et al. J. Mol. Struct., 2005, 743(1/2/3):79-84 doi: 10.1016/j.molstruc.2004.11.029
Trynda-Lemiesz L. Bioorg. Med. Chem., 2004, 12(12):3269-3275 doi: 10.1016/j.bmc.2004.03.073
Bian Q Q, Liu J Q, Tian J N, et al. Int. J. Biol. Macromol., 2004, 34(5):275-279 doi: 10.1016/j.ijbiomac.2004.09.005
Ji Z S, Yuan H Z, Liu M L, et al. J. Pharm. Biomed. Anal., 2005, 781:744-757
Sułkowska A, Michnik A. J. Mol. Struct., 1997, 410:27-29 http://www.sciencedirect.com/science/article/pii/S0022286096096810
SHELXTL, Version 5.0, Siemens Industrial Automation, Inc., Analytical Instrumentation, Madison, WI, 1995.
Mosmann T. J. Immunol. Med., 1983, 65(1/2):55-63
Chatterjee T, Pal A, Dey S, et al. Plos One, 2012, 7(5):37468-37480 doi: 10.1371/journal.pone.0037468
Peker E, Serin S. Synth. React. Inorg. Met., 2004, 34(5):859-872 doi: 10.1081/SIM-120037512
Li M J, Lan T Y, Lin Z S, et al. J. Biol. Inorg. Chem., 2013, 18(8):993-1003 doi: 10.1007/s00775-013-1048-7
Huang Y Q, Wan Y, Chen H Y, et al. New J. Chem., 2016, 40:7587-7595 doi: 10.1039/C6NJ01231K
Huang Y Q, Cheng H D, Chen H Y, et al. CrystEngComm, 2015, 17:5690-5701 doi: 10.1039/C5CE00677E
Bhat S S, Kumbhar A A, Heptullah H, et al. Inorg. Chem., 2011, 50(2):545-558 doi: 10.1021/ic101534n
Tardito S, Bassanetti I, Bignardi C, et al. J. Am. Chem. Soc., 2011, 133(16):6235-6242 doi: 10.1021/ja109413c
李婧, 吴春阳, 张莹, 等.无机化学学报, 2018, 34(1):135-141 http://qikan.cqvip.com/article/detail.aspx?id=674185893LI Jing, WU Chun-Yang, ZHANG Ying, et al. Chinese J. Inorg. Chem., 2018, 34(1):135-141 http://qikan.cqvip.com/article/detail.aspx?id=674185893
Abbasi Z, Salehi M, Kubicki M, et al. J. Coord. Chem., 2017, 70(12):2074-2093 doi: 10.1080/00958972.2017.1323082
Ding F, Liu W, Diao J X, et al. J. Lumin., 2011, 131(7):1327-1335 doi: 10.1016/j.jlumin.2011.03.007
Huang B X, Kim H Y, Dass C. J. Am. Soc. Mass Spectrom., 2004, 15(8):1237-1247 doi: 10.1016/j.jasms.2004.05.004
张静, 陈霖锋, 朱亚先, 等.高等学校化学学报, 2017, 38(1):28-34 http://qikan.cqvip.com/article/detail.aspx?id=670978690ZHANG Jing, CHEN Lin-Feng, ZHU Ya-Xian, et al. Chem. J. Chinese Universities, 2017, 38(1):28-34 http://qikan.cqvip.com/article/detail.aspx?id=670978690
Streyer L. J. Mol. Biol., 1965, 13:482-495 doi: 10.1016/S0022-2836(65)80111-5
Lakowicz J R. Principles of Fluorescence Spectroscopy. 2nd Ed. New York:Plenum Press, 1999:237-265
Dewey T G. Biophysical and Biochemical Aspects of Fluore-scence Spectroscopy. New York:Plenum Press, 1991:1-41
Lakowica J R, Weber G. Biochemistry, 1973, 12(21):4161-4170 doi: 10.1021/bi00745a020
Hu Y J, Liu Y, Wang J B, et al. J. Pharmaceut. Biomed., 2004, 36(4):915-919 doi: 10.1016/j.jpba.2004.08.021
Ross P D, Subhramanian S. Biochemistry, 1981, 20(11):3096-3102 doi: 10.1021/bi00514a017
Suzukida M, Le H P, Shahid F, et al. Biochemistry, 1983, 22(10):2415-2420 doi: 10.1021/bi00279a017
Sharma A, Schulman S G. Introduction to Fluorescence Spectroscopy. New York:Wiley, 1999:58-59
Valeur B, Brochon J C. New Trends in Fluorescence Spectroscopy. 6th Ed. Berlin:Springer Press, 1999:25

Figure 3 Molecular structure of the Cu(Ⅱ) complex
Cu(Ⅱ) complex Symmetry codes: A: 1-x, 1-y, -z

Figure 5 Representative graphs showing the survival of Hela, HepG2, SGC-7901 and MCF-7 cells grown for 48 h in the presence of Cu(Ⅱ) complex and carboplatin

Figure 6 Effect of Cu(Ⅱ) complex on BSA fluorescence at different temperatures: (A) 287 K; (B) 303 K; (c) 313
cBSA=5.0 μmol·L-1, a~g: ccomplex=0, 4, 8, 12, 16, 20, 24 μmol·L-1

Figure 7 Stern-Volmer plots of quenching of BSA fluorescence by Cu(Ⅱ) complex at different temperatures

Figure 8 Overlapping of the fluorescence spectra of BSA with the absorption spectra of Cu(Ⅱ) complex
cBSA=50 μmol·L-1, ccomplex=5 μmol·L-1
Table 1. Crystallographic data of the Cu(Ⅱ) complex
| Molecular formula | C38H28N6O2Cu | V/nm3 | 1.524 2(17) | |
| Formula weight | 664.2 | Z | 2 | |
| Crystal system | Monoclinic | Dc/(g·cm-3) | 1.447 | |
| Space group | P21/c | μ/mm-1 | 0.763 | |
| a/nm | 1.755 2(12) | Reflection measured | 2 628 | |
| b/nm | 1.130 8(7) | R1 | 0.122 7 | |
| c/nm | 0.768 3(5) | wR2 | 0.222 6 | |
| β/(°) | 91.799(11) | GOF | 1.019 |
 下载: 导出CSV
Table 2. Selected bond lengths (nm) and bond angles (°) of Cu(Ⅱ) complex
| Cu1-O1 | 0.189 9(5) | Cu1-N1 | 0.201 6(5) | O1-C1 | 0.133 0(8) |
| N1-C7 | 0.130 9(9) | N1-C8 | 0.143 2(9) | N2-N3 | 0.124 7(8) |
| N2-C11 | 0.143 3(9) | N3-C14 | 0.144 8(9) | ||
| O1-Cu1-O1 | 180.0 | N1-C7-H7 | 116.7(0) | O1-Cu1-N1 | 90.5(2) |
| C2-C7-H7 | 116.7(0) | O1-Cu1-N1 | 89.5(2) | C13-C8-C9 | 119.8(7) |
| N1-Cu1-N1 | 180.0 | C13-C8-N1 | 117.8(6) | C1-O1-Cu1 | 123.6(4) |
| C9-C8-N1 | 122.3(6) | C7-N1-C8 | 116.8(5) | C15-C14-N3 | 114.9(7) |
| C7-N1-Cu1 | 121.2(4) | C19-C14-N3 | 124.8(7) | C8-N1-Cu1 | 121.5(4) |
| C12-C11-N2 | 115.3(6) | N3-N2-C11 | 114.5(6) | C10-C11-N2 | 125.0(6) |
| N2-N3-C14 | 113.0(6) | C9-C8-N1 | 122.3(6) | O1-C1-C6 | 120.8(6) |
| C13-C8-N1 | 117.8(6) | O1-C1-C2 | 122.1(6) | N1-C7-H7 | 116.7(0) |
| N1-C7-C2 | 126.6(6) |
下载: 导出CSV
Table 3. Inhibition action of complexes to the cancer cell in vitro
| Complex | IC50/(μmol·L-1) | |||
| Hela | HepG2 | SGC-7901 | MCF-7 | |
| Cu(Ⅱ) complex | 9.52±2.6 | 9.44±0.44 | 4.67±1.98 | 4.52±0.98 |
| Carboplatin | 19.21±3.5 | 20.33±1.02 | 13.39±0.82 | 10.92±1.01 |
下载: 导出CSV
Table 4. Quenching parameters of Cu(Ⅱ) complex-BSA interactions
| T/K | Ksv/(L·mol-1) | Kq/(L·mol-1·s-1) | R* |
| 287 | 2.044×10⁴ | 2.044×10¹² | 0.990 90 |
| 303 | 1.900×10⁴ | 1.900×10¹² | 0.991 27 |
| 313 | 1.848×10⁴ | 1.848×10¹² | 0.998 18 |
| *R is regression coefficient | |||
下载: 导出CSV
Table 5. Binding constants (KA) and binding sites (n) at various temperatures
| T/K | KA/(L·mol-1) | n | R* |
| 287 | 2.61×10⁴ | 1.56 | 0.990 13 |
| 303 | 2.44×10⁴ | 1.28 | 0.997 27 |
| 313 | 2.20×10⁴ | 1.13 | 0.995 86 |
| *R is regression coefficient | |||
下载: 导出CSV
Table 6. Thermodynamic parameters for the interaction of Cu(Ⅱ) complex and BSA
| T/K | ΔH/(kJ·mol-1) | ΔG/(kJ·mol-1) | ΔS/(J·mol-1·K-1) |
| 287 | -3.04 | -24.27 | 73.97 |
| 303 | -8.16 | -25.45 | 57.06 |
| 313 | -8.16 | -26.02 | 57.06 |
下载: 导出CSV

 扫一扫看文章

扫一扫关注我们


 下载:
下载: