Table 1.
Structures, Experimental and Predicted Activities of 63 Molecules in Dataset
Citation:
Wen-Guang LIU, Dan-Feng HONG, Chang-Cheng XI, Chao MA, Fei XIONG, Shu-Ping ZHANG. 3D-QSAR Analysis of a Series of Dihydroquinolizinone Derivatives as a Hepatitis B Virus Expression Inhibitor[J]. Chinese Journal of Structural Chemistry,
2020, 39(9): 1615-1626.
doi:
10.14102/j.cnki.0254-5861.2011-2661

3D-QSAR Analysis of a Series of Dihydroquinolizinone Derivatives as a Hepatitis B Virus Expression Inhibitor
English
3D-QSAR Analysis of a Series of Dihydroquinolizinone Derivatives as a Hepatitis B Virus Expression Inhibitor
Abstract:
In this study, we explored a three-dimensional quantitative structure-activity relationship (3D-QSAR) model of 63 HBV viral gene expression inhibitors containing dihydroquinolizinones. Two high predictive QSAR models have been built, including comparative molecular field analysis (CoMFA) and comparative molecular similarity indices analysis (CoMSIA). The internal validation parameter (CoMFA, q2 = 0.701, r2 = 0.999; CoMSIA, q2 = 0.721, r2 = 0.998) and external validation parameter (CoMFA, rpred = 0.9992; CoMSIA, rpred = 0.9992) indicated that the models have good predictive abilities and significant statistical reliability. We designed several molecules with potentially higher predicted activity on the basis of the result of the models. This work might provide useful information to design novel HBV viral gene expression inhibitors.
-
Key words:
- 3D-QSAR
- / CoMFA
- / CoMSIA
- / dihydroquinolizinones
- / HBV
-
1. INTRODUCTION
Hepatitis B virus (HBV) infection remains a major epidemic and a global healthcare threat. Depending on the World Health Organization (WHO), there are approximately 350 million chronically infected individuals[1]. People with chronic hepatitis B (CHB) infection is under a higher probability of causing liver fibrosis, cirrhosis and primary hepatocellular carcinoma[2, 3]. More than 600, 000 people die each year from liver diseases caused by hepatitis B virus infection[4]. Despite the availability of a preventive vaccine reducing HBV infection risk and the promotion of neonatal vaccination of many countries for decades, the total number of patients with chronic hepatitis B is still rising[5]. At the moment, the standard therapy for HBV infection includes immunomodulator, interferons (interferon-alpha and pegylated interferon), and nucleoside drugs (lamivudine, adefovir dipivoxil, entecavir, telbivudine and tenofovir)[6, 7]. While interferons and nucleoside drugs have been proved to effectively suppress viral replication, and the required long term treatment can be plagued by adverse effects and drug resistance[8-10]. This is exactly why even with a fairly large number of FDA-approved drugs, there is still an urgent need for improved antivirals, particularly those with novel and distinct mechanisms of action to combat drug resistance.
The goal of therapy for CHB is to improve the quality of life and survival by suppressing viral replication to the lowest possible level, and thereby to halt the progression of liver disease and prevent the complications happening[11]. This goal can be achieved if HBV replication is restrained in a sustained manner. However, a true cure may not be feasible with current technologies because the HBV genome is not only present in the hepatocyte nucleus in the form of cccDNA (viral covalently closed circular DNA) but also integrates into the host genome; even among persons who have recovered from acute HBV, cccDNA can be detected in the liver, explaining the reactivation of HBV replication when these "recovered" persons are profoundly immunosuppressed[12, 13]. As a consequence, functional cure, which is defined as durable HBsAg loss (with or without anti-HBs seroconversion), is thought to be the most promising and attainable goal for future therapies in the near future[14].
Recently, a series of dihydroquinolizinones as a novel inhibitor of HBV viral gene expression has been studied[15]. Most of them exhibited good antiviral activity against HBV. To understand the three-dimensional quantitative structure-activity relationships (3D-QSARs) of these novel dihydroquinolizinones, in the present study, the comparative molecular field analysis (CoMFA) and the comparative molecular similarity indices analysis (CoMSIA) were performed on the novel series of dihydroquinolizinones. Contour maps of CoMFA and CoMSIA models were generated which helped us in analyzing the variation in activity and guided us to design new molecules. The contour maps obtained in CoMFA and CoMSIA models were employed to predict the biological activity of the designed compounds. Our results will give some useful suggestions on developing novel dihydroquinolizinones inhibitor.
2. MATERIALS AND METHODS
2.1 Database and biological activity
CoMFA and CoMSIA studies were performed on a set of 69 HBV inhibitors recently reported by Han et al.[15]. The corresponding half maximal inhibitory concentration (IC50) nM values were transformed to pIC50 (log(1/IC50) values which were utilized as the dependent variable in CoMFA and CoMSIA analyses. 47 compounds were randomly selected as the training set and 17 compounds as the test set. The experimental activity was stemmed from the literature, while the predicted activity was calculated with CoMFA and CoMSIA models for both training and test sets of the compounds. The structures of all compounds and the biological data are listed in Table 1.
Table 1

 DownLoad:
CSV
DownLoad:
CSV

ID R1 R2 R3 Actual pIC50 Predicted pIC50 CoMFA Residue CoMSIA Residue 1* -OMe -OMe -H 5.578 5.559 –0.019 5.635 0.057 2 -H -OMe -Me 5.304 5.403 0.099 5.438 0.134 3 -H -H -Me 4.284 4.305 0.021 4.268 –0.016 4 -Me -OMe -Me 6.620 6.709 0.089 6.528 –0.092 5 -Cl -OMe -Me 6.538 6.414 –0.124 6.505 –0.033 6* -OEt -OMe -Me 5.921 5.894 –0.027 5.880 –0.041 7 
-OMe -Me 5.703 5.636 –0.067 5.700 –0.003 8 -OBn -OMe -Me 4.538 4.553 0.015 4.496 –0.042 9 -OMe -OH -Me 5.140 5.184 0.044 5.169 0.029 10 -OMe -H -Me 5.115 5.143 0.028 5.147 0.032 11 -OMe -OBn -Me 7.000 6.986 –0.014 7.037 0.037 12 -H -Br -Me 5.323 5.306 –0.017 5.366 0.043 13 -H 
-Me 6.237 6.304 0.067 6.234 –0.003 14 -H 
-Me 7.092 7.096 0.004 7.099 0.007 15 -H 
-Me 5.046 4.944 –0.102 5.041 –0.005 16 -OH -OEt -Me 5.730 5.749 0.019 5.721 –0.009 17 -OMe -OMe -Et 6.959 6.852 –0.107 6.846 –0.113 18 -OMe -OMe 
7.167 7.198 0.031 7.067 –0.100 19 -OMe -OMe 
7.284 7.239 –0.045 7.299 0.015 20 -OMe -OBn -Et 7.408 7.408 0.000 7.422 0.014 21 -OMe -OEt -Et 7.367 7.409 0.042 7.397 0.030 22 -OMe 
-Et 7.699 7.699 0.000 7.754 0.055 23 -OMe 
-Et 7.745 7.744 –0.001 7.709 –0.036 24 -OMe 
-Et 7.886 7.838 –0.048 7.908 0.022 25 -OMe 
-Et 7.367 7.041 0.034 7.357 –0.010 26 -OMe 
-Et 7.046 7.057 0.011 7.028 –0.018 27* -OMe 
-Et 6.432 6.471 0.039 6.418 –0.014 28 -OMe -CN -Et 6.481 6.494 0.013 6.399 –0.082 29 -Et -OMe -Et 7.620 7.608 –0.012 7.640 0.020 30 
-OMe -Et 7.886 7.898 0.012 7.967 0.081 31 -OMe 
-Et 5.409 5.403 –0.006 5.449 0.040 32 -OMe 
-Et 5.301 5.276 –0.025 5.258 –0.043 33 -OMe 
-Et 6.745 6.732 –0.013 6.809 0.064 34 -OMe 
-Et 5.509 5.532 0.023 5.529 0.020 35* -OMe 
-Et 6.796 6.794 –0.002 6.909 0.028 36* -OMe 
-Et 6.252 6.229 –0.023 6.212 –0.040 37* -OMe 
-Et 6.699 6.690 –0.009 6.689 0.010 38 -OMe 
-Et 7.194 7.173 –0.021 7.111 –0.083 39* -OMe 
-Et 7.721 7.750 0.029 7.663 –0.058 40 -OMe 
-Et 6.658 6.687 0.029 6.704 0.046 41* -OMe 
-Et 7.553 7.509 –0.044 7.597 0.044 42* -OMe 

8.046 8.117 0.071 8.144 0.098 43 -OMe 

9.000 8.957 –0.043 9.005 0.005 44 -OMe 

8.699 8.738 0.039 8.706 0.007 45 -OMe 

7.409 7.403 –0.006 7.411 0.002 46 -OMe 

7.131 7.129 –0.002 7.133 0.002 47* -OMe 

8.301 8.326 0.025 8.258 –0.043 48* -OMe 

6.886 6.887 0.001 6.901 0.015 49 -OMe 

8.222 8.250 0.028 8.210 –0.012 50 -OMe 

8.000 8.024 0.024 7.967 –0.033 51 -OMe 

7.194 7.188 –0.006 7.219 0.025 52 -OMe 

6.097 6.105 0.008 6.075 –0.022 53 -OMe 

7.036 6.999 –0.037 7.064 0.028 54* -OMe 

8.000 8.024 0.024 8.023 0.023 55 -OMe 

8.523 8.532 0.009 8.535 0.012 
ID R4 Actual pIC50 Predicted pIC50 CoMFA Residue CoMSIA Residue 56 
4.721 4.707 –0.014 4.737 0.016 57* 
5.194 5.185 –0.009 5.191 –0.003 58* 
4.366 4.380 0.014 4.381 0.015 59 
4.886 4.911 0.025 4.871 –0.015 60* 
5.180 5.210 0.030 5.148 –0.032 61 
6.284 6.242 –0.042 6.289 0.005 62* 
4.721 4.705 –0.016 4.726 0.005 63 
6.009 6.030 0.021 6.007 –0.002 *Test-set molecule 2.2 Molecular modelling and alignment
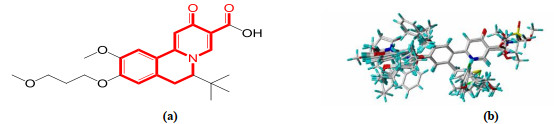
Firstly, we built the three-dimensional structure of molecules by the Sybyl 2.0 software. Then, molecules were optimized using Tripos force field, Gasteiger-Hückel charge, Powell energy gradient method, 10, 000 times optimization, and energy convergence difference 0.05 kcal/mol[16, 17]. Other values are default and molecular mechanics optimization is performed on the compounds to obtain the lowest energy conformation. Molecular alignment of the compound database is the key part of the 3D-QSAR studies and is a determining factor of the successful model. To attain a significant result, CoMFA and CoMSIA study required that the three-dimensional structures of all molecules in the training and test sets needed to be aligned according to a template-based conformation[18]. Compound 43 was used as reference for the alignment of both the training and test sets, since it was the highest biological activity in the series. Then, the alignment of all compounds of the training set is shown in Fig. 1.
Figure 1
 Figure 1. (a) Structure of compound 43. Common substructure is shown in red bold lines. (b) Alignment of molecules on the bioactive conformation of the highest active compound, molecule-43
2.3 Partial least-squares analysis
Partial least squares (PLS) is a statistical technique which describes the relationship between the experimental biological activity and the model[19]. PLS analysis with leave-one-out (LOO) cross-validation was carried out to obtain the optimal number of components (ONC) and squared cross-validated correlation coefficient (q2). Then, the non-cross-validation was performed to obtain the final CoMFA and CoMSIA models, yielding the correlation coefficient (r2), significant test value (F) and standard error of estimate (SEE). The value of the cross-validation correlation coefficient q2 > 0.5 and r2 > 0.9 indicated that the 3D-QSAR models were reasonable and reliable enough for the prediction of biological activities[20, 21]. The cross-validated coefficient (q2) is evaluated based on the following Eq. (1):
$ {q}^{2}= 1-\frac{\sum {\left({Y}_{\mathrm{p}\mathrm{r}\mathrm{e}\mathrm{d}}-{Y}_{\mathrm{e}\mathrm{x}\mathrm{p}}\right)}^{2}}{\sum {\left({Y}_{\mathrm{a}\mathrm{c}\mathrm{t}\mathrm{u}\mathrm{a}\mathrm{l}}-{Y}_{\mathrm{e}\mathrm{x}\mathrm{p}}\right)}^{2}} $ (1) Where Yactual, Yexp and Ymean represented the predicted, experimental, and mean biologic activities of training-set compounds, respectively.
2.4 External validation of the CoMFA and CoMSIA models
The predictive power of the models is assessed by calculating the predictive r2 (rpred2)[22], which measures the predictive performance of a PLS model, and is defined according to Eq. (2):
$ {r}_{\mathrm{p}\mathrm{r}\mathrm{e}\mathrm{d}}^{2}=\frac{SD-PRESS}{SD}$ (2) Where SD is the sum of the squared deviations between the experimental activities of the test set and the mean activities of the training set compounds, and PRESS is the sum of the squared deviations between the predicted and experimental activities for all compounds of the test set. In general, rpred2 > 0.5 indicates that the model has a strong exterior predicative ability.
3. RESULTS AND DISCUSSION
3.1 Analyses of the CoMFA and CoMSIA models
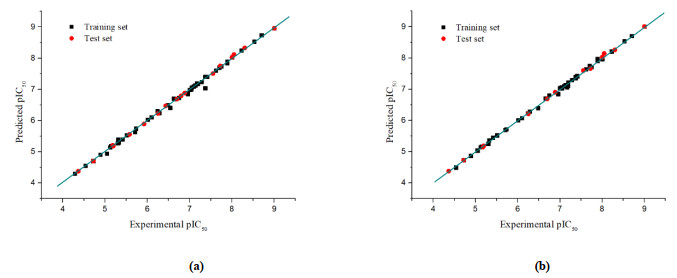
Table 2 lists the partial least-squares analysis results of the CoMFA and CoMSIA methods. All the permutation and combination of steric (S), electrostatic (E), hydrophobic (H), hydrogen-bond donor (D), and hydrogen-bond acceptor (A) fields of CoMSIA were calculated by PLS. High q2 and r2 values (q2 > 0.5, r2 > 0.9) are considered as a proof of credible models. For CoMFA model, PLS analysis results show the q2 value of 0.701. A non-cross-validated PLS analysis in a conventional r2 is 0.999. F-statistic value is 1826.354 and SEE is 0.052 with 13 components. In addition to that, the steric effect is significantly more important than the electrostatic according to the accounts of field contribution. rpred2 of the test set is 0.999, indicating that the CoMFA model has high predictive ability. In the CoMSIA model, the best model (with combination of S, H and D) shows the statistical metrics of q2, r2, rpred2, F, SEE and ONC values are 0.721, 0.998, 0.999, 942.736, 0.061 and 18, respectively. Binding affinity also mostly comes from the steric effort. Experimental data and predicted activities with residues of the training and test sets based on the two models are given in Table 1. Fig. 2 shows the experimental results which consist with the predicted values and indicate the reliability of the CoMFA and CoMSIA models.
Table 2
Table 2. Partial Least Squares (PLS) Statistics of CoMFA and CoMSIA Models in Different Molecular Field CombinationsDownLoad:
CSV
Field contribution (%) Model q2 N SEE r2 F rpred2 S E H D A CoMFA S+E 0.701 13 0.052 0.999 1826.354 0.999 78.3 21.7 CoMSIA S 0.428 5 0.506 0.834 41.185 0.811 E 0.306 3 0.608 0.749 42.828 0.888 H 0.471 5 0.369 0.912 85.031 0.983 D -0.016 2 1.019 0.278 8.491 0.676 A -0.009 1 1.089 0.157 8.364 0.820 S+E 0.372 3 0.525 0.813 62.364 0.901 42.6 57.4 S+H 0.540 20 0.030 1.000 3592.078 0.995 26.6 73.4 S+D 0.198 3 0.673 0.692 32.227 0.915 58.6 41.4 S+A 0.261 3 0.647 0.716 36.159 0.848 54.8 45.2 E+H 0.495 11 0.116 0.993 426.511 0.999 65.1 34.9 E+D 0.228 3 0.692 0.675 29.736 0.937 42.8 57.2 E+A 0.171 6 0.425 0.886 51.869 0.936 60.0 40.0 H+D 0.638 17 0.131 0.992 215.599 0.999 77.7 22.3 H+A 0.445 14 0.108 0.994 388.391 0.967 74.4 25.6 D+A 0.226 3 0.863 0.495 14.032 0.935 67.9 32.1 S+E+H 0.540 16 0.044 0.999 2041.177 0.999 19.3 26.0 54.7 S+E+D 0.389 3 0.551 0.794 55.100 0.979 24.6 31.4 44.0 S+E+A 0.265 4 0.470 0.854 61.216 0.848 30.7 38.6 30.7 S+H+D 0.721 18 0.061 0.998 942.736 0.999 22.6 57.4 20.0 S+H+A 0.593 19 0.023 1.000 6453.718 0.980 23.2 57.9 18.9 S+D+A 0.422 3 0.627 0.733 39.395 0.987 26.4 49.6 24.0 E+H+D 0.617 18 0.070 0.998 721.159 0.999 24.1 55.5 20.4 E+H+A 0.487 15 0.059 0.998 1218.305 0.999 26.4 56.8 16.8 E+D+A 0.423 9 0.362 0.923 49.589 0.907 44.1 31.9 24.0 H+D+A 0.526 16 0.142 0.990 194.289 0.999 60.1 24.3 15.6 S+E+H+D 0.635 19 0.049 0.999 1379.069 0.998 16.7 18.1 47.2 18.0 S+E+H+A 0.529 19 0.022 1.000 6618.679 0.999 17.3 20.7 48.2 13.8 S+E+D+A 0.485 3 0.561 0.786 52.666 0.915 18.8 21.5 41.9 17.8 S+H+D+A 0.650 17 0.080 0.997 583.182 0.997 20.0 49.0 20.4 10.6 E+H+D+A 0.581 17 0.084 0.997 524.967 0.999 20.4 50.1 18.8 10.7 S+E+H+D+A 0.602 19 0.051 0.999 1264.852 0.997 15.9 16.0 43.5 16.2 8.5 q2: Cross-validated correlation coefficient.
N: Optimum number of compoents.
SEE: Standard error of estimate.
r2: Non-cross-validated correlation coefficient.
F: The Fisher test value.
rpred2: Predictive correlation coefficient.
S, E, H, D and A: Steric, electrostatic, hydrophobic, hydrogen-bond donor and hydrogen-bond acceptor.Figure 2
 Figure 2. Correlation between experimental pIC50 values and predicted pIC50 values for the training and test sets: (a) CoMFA model; (b) CoMSIA model
3.2 CoMFA contour maps
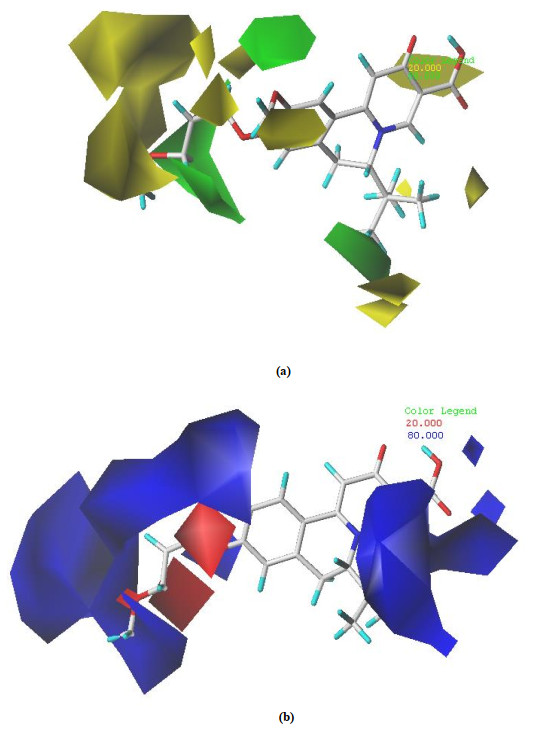
The CoMFA and CoMSIA contour maps could vividly explain and predict the effects of different substituents on the bioactivity. Compound 43 was selected as a reference and overlaid in the maps, as it was the most active compound in the training and test sets. The contour maps of steric and electrostatic fields for the analysis of CoMFA are presented as Fig. 3.
Figure 3
 Figure 3. CoMFA contour maps of the template compound 43. (a) Steric field: the green contours indicate bulk groups are favored and yellow contours mean small groups are favored. (b) Electrostatic field: blue contours show regions where positively charged groups are favored and red contours show positions where negatively charged groups are favored
The green contours indicate sterically favorable bulky substituent and the yellow contours mean that bulky groups are disfavored. As shown in Fig. 3a, the yellow contours near the R1 and R4 positions indicate that the compound with bulky substituent at this position is not beneficial for the activity. These characteristics may explain higher activity of compound 4 (pIC50 = 6.620) with a methyl group as R1, whereas lower activity of compound 8 (pIC50 = 4.538) with methoxy benzene. Moreover, compound 20 with small group substituent is better than compounds 56~63 with large group substituent. However, the structure-activity relationships of several compounds are not consistent with this finding, for example, for compounds 56 (R4 = NHCH3) < 57 (R4 = NHCH2CH2CH3). This may be caused by other properties of the substitutions or the effects of other fields and remain to be studied. On the other hand, the green contours near the R2 and R3 positions indicate that bulky groups in this region are favorable to enhance the activity. This trend is confirmed in the following series: 11 (R2 = OBn, pIC50 = 7.000) > 10 (R2 = H, pIC50 = 5.115), 18 (R3 = CH2CH2CH3, pIC50 = 7.167) > 17 (R3 = CH2CH3, pIC50 = 6.959) > 1 (R3 = H, pIC50 = 5.578).
In electrostatic contours maps (Fig. 3b), blue contours denote regions where positive electrostatic substituents may increase the activity, and the red contours illustrate negative electrostatic groups are beneficial for enhancing the activity. R1 and R3 substitutes of the referent molecule 43 are observed in the region of blue contour which shows favorable electropositive substitution. This can be explained by the fact that compounds 4 (pIC50 = 6.620, R1 = Me) and 39 (pIC50 = 7.721, R3 = CH2CH3) show better biological activities relative to 5 (pIC50 = 6.538, R1 = Cl) and 45 (pIC50 = 7.409, R3 = CH2CF3) because of the electropositive groups. Two red contours sandwich R2 substituents of the benzene ring suggest that negative electrostatic group in this position enhances the biological activity. This can be explained by the fact that molecule 3 (pIC50 = 4.284) has hydrogen group and molecule 12 (pIC50 = 5.323) has bromine group.
3.3 CoMSIA contour maps
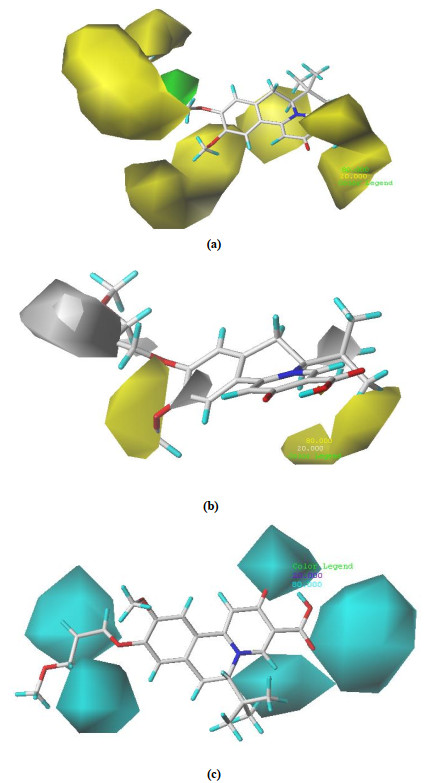
The best CoMSIA model is developed using three descriptor fields: steric, hydrophobic and hydrogen-bond donor fields. The steric, hydrophobic and hydrogen-bond donor contours of the CoMSIA model are shown in Fig. 4. The CoMSIA steric contour map is similar to CoMFA. Thus, the way of modifying the molecule is the same as CoMFA.
Figure 4
 Figure 4. CoMSIA contour maps of the template compound 43. (a) Favorable (green) and unfavorable (yellow) steric fields. (b) Favorable (yellow) and unfavorable (white) hydrophobic fields. (c) Favorable (cyan) and unfavorable (pueple) hydrogen bond donor fields
Hydrophobic contour maps are shown in Fig. 4b. Yellow and white represent favorable and unfavorable regions for hydrophobic field. The yellow contours near the R1, R2 and R3 positions indicate that the compound with hydrophobic substituent at this position is beneficial for the activity. This can be explained by the activity of molecules 6 (pIC50 = 5.921, R1 = OEt), 22 (pIC50 = 7.699, R2 = OCH2CH2CH3) and 43 (pIC50 = 9.000, R3 = C(CH3)3) higher than that of molecules 2 (pIC50 = 5.304, R1 = H), 36 (pIC50 = 6.252, R2 = OCH2CH2CH3OH) and 48 (pIC50 = 6.886, R3 = C(CH3)3OH). Fig. 4c reveals the hydrogen-bond donor contour map, and cyan contours highlight areas where hydrogen bond donor groups are favored. Since hydrogen bond donors have the lowest contribution to molecular activity and molecular docking requires further research, we omitted the analysis of the contour map.
4. DESIGN OF NEW DRUGS
Based on the analyses of CoMFA and CoMSIA models, the following substituents which are introduced into the corresponding regions might be favored for the inhibitory activity of HBV: (1) small, positively charged groups and/or hydrophobic groups at the R1 substituents position; (2) large, negatively charged groups and/or hydrophobic groups at the R2 substituents position; (3) large, positively charged groups and/or hydrophobic groups at the R3 substituents position; (4) small groups at the R4 substituents position. Using this information, design of new compounds has been done by considering the replacement groups in compound 43 with the highest inhibition activity. Designed molecules were optimized in the same way as that of the data set compounds. All of these candidates have better activities than the found compounds. The structures and predicted inhibition efficiency of newly designed compounds are shown in Table 3.
Table 3
Table 3. List of Molecular Structures of Newly Designed Compounds with Predicted Activity ValuesDownLoad:
CSV
ID R1 R2 R3 R4 CoMFA CoMSIA N1 -Me 

-H 10.062 10.467 N2 -Me 

-OH 10.041 9.079 N3 -Me 

-OH 9.474 9.712 N4 -Me 

-OH 9.486 10.246 N5 -Me 

-OH 9.423 10.212 N6 -Me 

-H 9.015 9.749 N7 -Me 

-H 9.047 9.205 N8 -Me 

-H 9.516 10.935 N9 -Me 

-H 9.716 10.233 N10 -Me 

-H 9.150 10.015 5. CONCLUSION
In this study, we have investigated the quantitative structure-activity relationships of 63 of dihydroquinolizinone derivatives under CoMFA and CoMSIA models. The CoMFA and CoMSIA models have values of q2 = 0.701, r2 = 0.999, N = 13, SEE = 0.052, F = 1826.354 and q2 = 0.721, r2 = 0.998, N = 19, SEE = 0.061 and F = 942.736, respectively. Moreover, the two models are all statistically significant with high external predictability (both of their rpred2 are 0.999). This result indicated that the two models have excellent predictive ability and could be prospectively used in structure modification and optimization. Furthermore, we designed a series of new dihydroquinolizinone inhibitors with better inhibition efficiency than the template molecule by the CoMFA and CoMSIA contour maps. This work will provide new theoretical insights for synthetic medicinal chemists to design and synthesize novel dihydroquinolizinone inhibitors.
-
-
[1]
Zhang, H. H.; Li, H.; Yang, Y. X.; Li, S. L.; Ren, H.; Zhang, D. Z.; Hu, H. D. Differential regulation of host genes including hepatic fatty acid synthase in HBV-transgenic mice. J. Proteome Res. 2013, 12, 2967−2979. doi: 10.1021/pr400247f
-
[2]
Mueller, A, H.; Wildum, S.; Luangsay, S.; Walther, J.; Lopez, A.; Tropberger, P.; Ottaviani, G.; Lu, W. Z.; Parrott, N. J.; Zhang, J. D.; Schmucki, R.; Racek, T.; Hoflack, J. C.; Kueng, E.; Point, F.; Zhou, X.; Steiner, G.; Lütgehetmann, M.; Rapp, G.; Volz, T.; Dandri, M.; Yang, S.; Young, J. A. T.; Javanbakht, H. Novel orally available small molecule that inhibits hepatitis B virus expression. J. Hepatol. 2017, 68, 412−420.
-
[3]
Thi, E. P.; Dhillon, A. P.; Ardzinski, A.; Bidirici-Ertekin, L.; Cobarrubias, K. D.; Cuconati, A.; Kondratowicz, A. S.; Kwak, K.; Li, A. H. L.; Miller, A.; Pasetka, C.; Pei, L.; Phelps, J. R.; Snead, N. M.; Wang, X. H.; Ye, X.; Sofia, M. J.; Lee, A. C. H. ARB-1740, a RNA interference therapeutic for chronic hepatitis B infection. ACS Infect. Dis. 2019, 5, 725−737. doi: 10.1021/acsinfecdis.8b00191
-
[4]
Qiu, Z. X.; Lin, X. F.; Zhou, M. W.; Liu, F. F.; Zhu, W.; Chen, W. M.; Zhang, W. X.; Guo, L.; Liu, H. X.; Wu, G. L.; Huang, M. W.; Jiang, M.; Xu, Z. H.; Zhou, Z.; Qin, N.; Ren, S.; Qiu, H. X.; Zhong, S.; Zhang, Y. X.; Zhang, Y.; Wu, X. Y.; Shi, L. P.; Shen, F.; Mao, Y.; Zhou, X.; Yang, W. G.; Wu, J. Z.; Yang, G.; Mayweg, A. V.; Shen, H. C.; Tang, G. Z. Design and synthesis of orally bioavailable 4-methyl heteroaryldihydropyrimidine based hepatitis B virus (HBV) capsid inhibitors. J. Med. Chem. 2016, 59, 7651−7666. doi: 10.1021/acs.jmedchem.6b00879
-
[5]
Stanaway, J. D.; Flaxman, A. D.; Naghavi, M.; Fitzmaurice, C.; Vos, T.; Abubakar, I.; Abu-Raddad, L. J.; Assadi, R.; Bhala, N.; Cowie, B.; Forouzanfour, M. H.; Groeger, J.; Hanafiah, K. M.; Jacobsen, K. H.; James, S. L.; MacLachlan, J.; Malekzadeh, R.; Martin, N. K.; Mokdad, A. A.; Mokdad, A. H.; Murray, C. J. L.; Plass, D.; Rana, S.; Rein, D. B.; Richardus, J. H.; Sanabria, J.; Saylan, M.; Shahraz, S.; So, S.; Vlassov, V. V.; Weiderpass, E.; Wiersma, S. T.; Younis, M.; Yu, C. H.; Zaki, M. E. S.; Cooke, G. S. The global burden of viral hepatitis from 1990 to 2013: findings from the global burden of disease study 2013. Lancet. 2016, 388, 1081−88. doi: 10.1016/S0140-6736(16)30579-7
-
[6]
Zhang, P. H.; Zhai, S.; Chang, J. H.; Guo, J. T. In vitro anti-hepatitis B virus activity of 2΄, 3΄-dideoxyguanosine. Virologica Sinica 2018, 33, 538−544. doi: 10.1007/s12250-018-0065-7
-
[7]
Yang, J.; Ma, M.; Wang, X. D.; Jiang, X. J.; Zhang, Y. Y.; Yang, W. Q.; Li, Z. C.; Wang, X. H.; Yang, B.; Ma, M. L. Synthesis and quantitative structure activity relationships study for phenylpropenamide derivatives as inhibitors of hepatitis B virus replication. Eur. J. Med. Chem. 2015, 99, 82−91. doi: 10.1016/j.ejmech.2015.05.032
-
[8]
Marcellin, P.; Ahn, S. H.; Ma, X. L.; Caruntu, F. A.; Tak, W. Y.; Elkashab, M.; Chuang, W. L.; Lim, S. G.; Tabak, F.; Mehta, R.; Petersen, J.; Foster, G. R.; Lou, L.; Martins, E. B.; Dinh, P.; Lin, L.; Corsa, A.; Charuworn, P.; Subramanian, G. M.; Reiser, H.; Reesink, H. W.; Fung, S.; Strasser, S. I.; Trinh, H.; Buti, M.; Gaeta, G. B.; Hui, A. J.; Papatheodoridis, G.; Flisiak, R.; Chan, H. L. Y. Combination of tenofovir disoproxil fumarate and peginterferon α-2a increases loss of hepatitis B surface antigen in patients with chronic hepatitis B. Gastroenterology 2016, 150, 134−144. doi: 10.1053/j.gastro.2015.09.043
-
[9]
Zhou, T. L.; Block, T.; Liu, F.; Kondratowicz, A. S.; Sun, L. R.; Rawat, S.; Branson, J.; Guo, F.; Steuer, H. M.; Liang, H. Y.; Bailey, L.; Moore, C.; Wang, X. H.; Cuconatti, A.; Gao, M.; Lee, A. C. H.; Harasym, T.; Chiu, T.; Gotchev, D.; Dorsey, B.; Rijnbrand, R.; Sofia, M. J. HBsAg mRNA degradation induced by a dihydroquinolizinone compound depends on the HBV posttranscriptional regulatory element. Antiviral Res. 2018, 149, 191−201. doi: 10.1016/j.antiviral.2017.11.009
-
[10]
Yang, L.; Liu, F. F.; Tong, X. K.; Hoffmann, D.; Zuo, J. P.; Lu, M. J. Treatment of chronic hepatitis B virus infection using small molecule modulators of nucleocapsid assembly: recent advances and perspectives. ACS Infect. Dis. 2019, 5, 713−724. doi: 10.1021/acsinfecdis.8b00337
-
[11]
Mueller, H.; Lopez, A.; Tropberger, P.; Wildum, S.; Schmaler, J.; Pedersen, L.; Han, X. C.; Wang, Y. G.; Ottosen, S.; Yang, S.; Young, J. A. T.; Javanbakht, H. PAPD5/7 are host factors that are required for hepatitis B virus RNA stabilization. Hepatology 2019, 69, 1398−1411. doi: 10.1002/hep.30329
-
[12]
Prescott, N. A.; Bram, Y.; Schwartz, R. E.; David, Y. Targeting hepatitis B virus covalently closed circular DNA and hepatitis B virus X protein: recent advances and new approaches. ACS Infect. Dis. 2019, 5, 1657−1667. doi: 10.1021/acsinfecdis.9b00249
-
[13]
Ko, C.; Chakraborty, A.; Chou, W. M.; Hasreiter, J.; Wettengel, J. M.; Stadler, D.; Bester, R.; Asen, T.; Zhang, K.; Wisskirchen, K.; McKeating, J. A.; Ryu, W. S.; Protzer, U. Hepatitis B virus genome recycling and de novo secondary infection events maintain stable cccDNA levels. J. Hepatol. 2018, 69, 1231−1241. doi: 10.1016/j.jhep.2018.08.012
-
[14]
Zoulim, F. Inhibition of hepatitis B virus gene expression: a step towards functional cure. J. Hepatol. 2018, 68, 386−388. doi: 10.1016/j.jhep.2017.11.036
-
[15]
Han, X. C.; Zhou, C. G.; Jiang, M.; Wang, Y. G.; Wang, J. H.; Cheng, Z. L.; Wang, M.; Liu, Y. Q.; Liang, C. G.; Wang, J. P.; Wang, Z. G.; Weikert, R.; Lv, W. Z.; Xie, J. X.; Yu, X.; Zhou, X.; Luangsay, S.; Shen, H. C.; Mayweg, A. V.; Javanbakht, H.; Yang, S. Discovery of RG7834: the first-in-class selective and orally available small molecule hepatitis B virus expression inhibitor with novel mechanism of action. J. Med. Chem. 2018, 61, 10619−10634. doi: 10.1021/acs.jmedchem.8b01245
-
[16]
Tsai, K. C.; Chen, Y. C.; Hsiao, N. W.; Wang, C. L.; Lin, C. L.; Lee, Y. C.; Li, M. Y.; Wang, B. H. A comparison of different electrostatic potentials on prediction accuracy in CoMFA and CoMSIA studies. Eur. J. Med. Chem. 2010, 45, 1544−1551. doi: 10.1016/j.ejmech.2009.12.063
-
[17]
Tu, J.; Li, J. J.; Shan, Z. J.; Zhai, H. L. Exploring the binding mechanism of heteroaryldihydropyrimidines and hepatitis B virus capsid combined 3D-QSAR and molecular dynamics. Antiviral Res. 2017, 137, 151−164. doi: 10.1016/j.antiviral.2016.11.026
-
[18]
Chai, H. F.; Liang, X. X.; Li, L.; Zhao, C. S.; Gong, P.; Liang, Z. J.; Zhu, W. L.; Jiang, H, L.; Luo, C. Identification of novel 5-hydroxy-1H-indole-3-carboxylates with anti-HBV activities based on 3D QSAR studies. J. Mol. Model. 2011, 17, 1831−1840. doi: 10.1007/s00894-010-0873-7
-
[19]
Wold, S.; Sjöström, M.; Eriksson, L. PLS-regression: a basic tool of chemometrics. Chemometrics Intell. Lab. Syst. 2001, 58, 109−130. doi: 10.1016/S0169-7439(01)00155-1
-
[20]
Kubinyi, H.; Hamprecht, F. A.; Mietzner, T. Three-dimensional quantitative similarity-activity relationships (3D QSiAR) from SEAL similarity matrices. J. Med. Chem. 1998, 41, 2553−2564. doi: 10.1021/jm970732a
-
[21]
Yang, J.; Ma, M.; Wang, X. D.; Jiang, X. J.; Zhang, Y. Y.; Yang, W. Q.; Li, Z. C.; Wang, X. H.; Yang, B.; Ma, M. L. Synthesis and quantitative structure-activity relationships study for phenylpropenamide derivatives as inhibitors of hepatitis B virus replication. Eur. J. Med. Chem. 2015, 99, 82−91. doi: 10.1016/j.ejmech.2015.05.032
-
[22]
Benigni, R.; Bossa, C. Predictivity of QSAR. J. Chem. Inf. Model. 2008, 48, 971−980. doi: 10.1021/ci8000088
-
[1]
-
Figure 1 (a) Structure of compound 43. Common substructure is shown in red bold lines. (b) Alignment of molecules on the bioactive conformation of the highest active compound, molecule-43
Figure 2 Correlation between experimental pIC50 values and predicted pIC50 values for the training and test sets: (a) CoMFA model; (b) CoMSIA model
Figure 3 CoMFA contour maps of the template compound 43. (a) Steric field: the green contours indicate bulk groups are favored and yellow contours mean small groups are favored. (b) Electrostatic field: blue contours show regions where positively charged groups are favored and red contours show positions where negatively charged groups are favored
Figure 4 CoMSIA contour maps of the template compound 43. (a) Favorable (green) and unfavorable (yellow) steric fields. (b) Favorable (yellow) and unfavorable (white) hydrophobic fields. (c) Favorable (cyan) and unfavorable (pueple) hydrogen bond donor fields
Table 1. Structures, Experimental and Predicted Activities of 63 Molecules in Dataset
ID R1 R2 R3 Actual pIC50 Predicted pIC50 CoMFA Residue CoMSIA Residue 1* -OMe -OMe -H 5.578 5.559 –0.019 5.635 0.057 2 -H -OMe -Me 5.304 5.403 0.099 5.438 0.134 3 -H -H -Me 4.284 4.305 0.021 4.268 –0.016 4 -Me -OMe -Me 6.620 6.709 0.089 6.528 –0.092 5 -Cl -OMe -Me 6.538 6.414 –0.124 6.505 –0.033 6* -OEt -OMe -Me 5.921 5.894 –0.027 5.880 –0.041 7 -OMe -Me 5.703 5.636 –0.067 5.700 –0.003 8 -OBn -OMe -Me 4.538 4.553 0.015 4.496 –0.042 9 -OMe -OH -Me 5.140 5.184 0.044 5.169 0.029 10 -OMe -H -Me 5.115 5.143 0.028 5.147 0.032 11 -OMe -OBn -Me 7.000 6.986 –0.014 7.037 0.037 12 -H -Br -Me 5.323 5.306 –0.017 5.366 0.043 13 -H -Me 6.237 6.304 0.067 6.234 –0.003 14 -H -Me 7.092 7.096 0.004 7.099 0.007 15 -H -Me 5.046 4.944 –0.102 5.041 –0.005 16 -OH -OEt -Me 5.730 5.749 0.019 5.721 –0.009 17 -OMe -OMe -Et 6.959 6.852 –0.107 6.846 –0.113 18 -OMe -OMe 7.167 7.198 0.031 7.067 –0.100 19 -OMe -OMe 7.284 7.239 –0.045 7.299 0.015 20 -OMe -OBn -Et 7.408 7.408 0.000 7.422 0.014 21 -OMe -OEt -Et 7.367 7.409 0.042 7.397 0.030 22 -OMe -Et 7.699 7.699 0.000 7.754 0.055 23 -OMe -Et 7.745 7.744 –0.001 7.709 –0.036 24 -OMe -Et 7.886 7.838 –0.048 7.908 0.022 25 -OMe -Et 7.367 7.041 0.034 7.357 –0.010 26 -OMe -Et 7.046 7.057 0.011 7.028 –0.018 27* -OMe -Et 6.432 6.471 0.039 6.418 –0.014 28 -OMe -CN -Et 6.481 6.494 0.013 6.399 –0.082 29 -Et -OMe -Et 7.620 7.608 –0.012 7.640 0.020 30 -OMe -Et 7.886 7.898 0.012 7.967 0.081 31 -OMe -Et 5.409 5.403 –0.006 5.449 0.040 32 -OMe -Et 5.301 5.276 –0.025 5.258 –0.043 33 -OMe -Et 6.745 6.732 –0.013 6.809 0.064 34 -OMe -Et 5.509 5.532 0.023 5.529 0.020 35* -OMe -Et 6.796 6.794 –0.002 6.909 0.028 36* -OMe -Et 6.252 6.229 –0.023 6.212 –0.040 37* -OMe -Et 6.699 6.690 –0.009 6.689 0.010 38 -OMe -Et 7.194 7.173 –0.021 7.111 –0.083 39* -OMe -Et 7.721 7.750 0.029 7.663 –0.058 40 -OMe -Et 6.658 6.687 0.029 6.704 0.046 41* -OMe -Et 7.553 7.509 –0.044 7.597 0.044 42* -OMe 8.046 8.117 0.071 8.144 0.098 43 -OMe 9.000 8.957 –0.043 9.005 0.005 44 -OMe 8.699 8.738 0.039 8.706 0.007 45 -OMe 7.409 7.403 –0.006 7.411 0.002 46 -OMe 7.131 7.129 –0.002 7.133 0.002 47* -OMe 8.301 8.326 0.025 8.258 –0.043 48* -OMe 6.886 6.887 0.001 6.901 0.015 49 -OMe 8.222 8.250 0.028 8.210 –0.012 50 -OMe 8.000 8.024 0.024 7.967 –0.033 51 -OMe 7.194 7.188 –0.006 7.219 0.025 52 -OMe 6.097 6.105 0.008 6.075 –0.022 53 -OMe 7.036 6.999 –0.037 7.064 0.028 54* -OMe 8.000 8.024 0.024 8.023 0.023 55 -OMe 8.523 8.532 0.009 8.535 0.012 ID R4 Actual pIC50 Predicted pIC50 CoMFA Residue CoMSIA Residue 56 4.721 4.707 –0.014 4.737 0.016 57* 5.194 5.185 –0.009 5.191 –0.003 58* 4.366 4.380 0.014 4.381 0.015 59 4.886 4.911 0.025 4.871 –0.015 60* 5.180 5.210 0.030 5.148 –0.032 61 6.284 6.242 –0.042 6.289 0.005 62* 4.721 4.705 –0.016 4.726 0.005 63 6.009 6.030 0.021 6.007 –0.002 *Test-set molecule  下载: 导出CSV
Table 2. Partial Least Squares (PLS) Statistics of CoMFA and CoMSIA Models in Different Molecular Field Combinations
Field contribution (%) Model q2 N SEE r2 F rpred2 S E H D A CoMFA S+E 0.701 13 0.052 0.999 1826.354 0.999 78.3 21.7 CoMSIA S 0.428 5 0.506 0.834 41.185 0.811 E 0.306 3 0.608 0.749 42.828 0.888 H 0.471 5 0.369 0.912 85.031 0.983 D -0.016 2 1.019 0.278 8.491 0.676 A -0.009 1 1.089 0.157 8.364 0.820 S+E 0.372 3 0.525 0.813 62.364 0.901 42.6 57.4 S+H 0.540 20 0.030 1.000 3592.078 0.995 26.6 73.4 S+D 0.198 3 0.673 0.692 32.227 0.915 58.6 41.4 S+A 0.261 3 0.647 0.716 36.159 0.848 54.8 45.2 E+H 0.495 11 0.116 0.993 426.511 0.999 65.1 34.9 E+D 0.228 3 0.692 0.675 29.736 0.937 42.8 57.2 E+A 0.171 6 0.425 0.886 51.869 0.936 60.0 40.0 H+D 0.638 17 0.131 0.992 215.599 0.999 77.7 22.3 H+A 0.445 14 0.108 0.994 388.391 0.967 74.4 25.6 D+A 0.226 3 0.863 0.495 14.032 0.935 67.9 32.1 S+E+H 0.540 16 0.044 0.999 2041.177 0.999 19.3 26.0 54.7 S+E+D 0.389 3 0.551 0.794 55.100 0.979 24.6 31.4 44.0 S+E+A 0.265 4 0.470 0.854 61.216 0.848 30.7 38.6 30.7 S+H+D 0.721 18 0.061 0.998 942.736 0.999 22.6 57.4 20.0 S+H+A 0.593 19 0.023 1.000 6453.718 0.980 23.2 57.9 18.9 S+D+A 0.422 3 0.627 0.733 39.395 0.987 26.4 49.6 24.0 E+H+D 0.617 18 0.070 0.998 721.159 0.999 24.1 55.5 20.4 E+H+A 0.487 15 0.059 0.998 1218.305 0.999 26.4 56.8 16.8 E+D+A 0.423 9 0.362 0.923 49.589 0.907 44.1 31.9 24.0 H+D+A 0.526 16 0.142 0.990 194.289 0.999 60.1 24.3 15.6 S+E+H+D 0.635 19 0.049 0.999 1379.069 0.998 16.7 18.1 47.2 18.0 S+E+H+A 0.529 19 0.022 1.000 6618.679 0.999 17.3 20.7 48.2 13.8 S+E+D+A 0.485 3 0.561 0.786 52.666 0.915 18.8 21.5 41.9 17.8 S+H+D+A 0.650 17 0.080 0.997 583.182 0.997 20.0 49.0 20.4 10.6 E+H+D+A 0.581 17 0.084 0.997 524.967 0.999 20.4 50.1 18.8 10.7 S+E+H+D+A 0.602 19 0.051 0.999 1264.852 0.997 15.9 16.0 43.5 16.2 8.5 q2: Cross-validated correlation coefficient.
N: Optimum number of compoents.
SEE: Standard error of estimate.
r2: Non-cross-validated correlation coefficient.
F: The Fisher test value.
rpred2: Predictive correlation coefficient.
S, E, H, D and A: Steric, electrostatic, hydrophobic, hydrogen-bond donor and hydrogen-bond acceptor.
下载: 导出CSV
Table 3. List of Molecular Structures of Newly Designed Compounds with Predicted Activity Values
ID R1 R2 R3 R4 CoMFA CoMSIA N1 -Me -H 10.062 10.467 N2 -Me -OH 10.041 9.079 N3 -Me -OH 9.474 9.712 N4 -Me -OH 9.486 10.246 N5 -Me -OH 9.423 10.212 N6 -Me -H 9.015 9.749 N7 -Me -H 9.047 9.205 N8 -Me -H 9.516 10.935 N9 -Me -H 9.716 10.233 N10 -Me -H 9.150 10.015
下载: 导出CSV
-


 扫一扫看文章
计量
- PDF下载量: 4
- 文章访问数: 861
- HTML全文浏览量: 8
 下载:
下载:
